
|
|||||
|
 | |
| |
| |
| |
| |
| |
|
Gene: STIP1 |
Gene summary for STIP1 |
| Gene information | Species | Human | Gene symbol | STIP1 | Gene ID | 10963 |
| Gene name | stress induced phosphoprotein 1 | |
| Gene Alias | HEL-S-94n | |
| Cytomap | 11q13.1 | |
| Gene Type | protein-coding | GO ID | GO:0008150 | UniProtAcc | P31948 |
Top |
Malignant transformation analysis |
| Identification of the aberrant gene expression in precancerous and cancerous lesions by comparing the gene expression of stem-like cells in diseased tissues with normal stem cells |
| Entrez ID | Symbol | Replicates | Species | Organ | Tissue | Adj P-value | Log2FC | Malignancy |
| 10963 | STIP1 | HTA11_3410_2000001011 | Human | Colorectum | AD | 8.95e-06 | 1.49e-01 | 0.0155 |
| 10963 | STIP1 | HTA11_2487_2000001011 | Human | Colorectum | SER | 5.04e-03 | 3.00e-01 | -0.1808 |
| 10963 | STIP1 | HTA11_1938_2000001011 | Human | Colorectum | AD | 1.58e-05 | 4.59e-01 | -0.0811 |
| 10963 | STIP1 | HTA11_78_2000001011 | Human | Colorectum | AD | 7.21e-03 | 3.44e-01 | -0.1088 |
| 10963 | STIP1 | HTA11_347_2000001011 | Human | Colorectum | AD | 2.46e-09 | 3.74e-01 | -0.1954 |
| 10963 | STIP1 | HTA11_3361_2000001011 | Human | Colorectum | AD | 8.51e-03 | 3.81e-01 | -0.1207 |
| 10963 | STIP1 | HTA11_696_2000001011 | Human | Colorectum | AD | 1.60e-11 | 5.35e-01 | -0.1464 |
| 10963 | STIP1 | HTA11_866_2000001011 | Human | Colorectum | AD | 2.52e-05 | 2.77e-01 | -0.1001 |
| 10963 | STIP1 | HTA11_1391_2000001011 | Human | Colorectum | AD | 3.19e-17 | 7.09e-01 | -0.059 |
| 10963 | STIP1 | HTA11_866_3004761011 | Human | Colorectum | AD | 1.25e-12 | 4.92e-01 | 0.096 |
| 10963 | STIP1 | HTA11_8622_2000001021 | Human | Colorectum | SER | 3.25e-06 | 5.39e-01 | 0.0528 |
| 10963 | STIP1 | HTA11_7663_2000001011 | Human | Colorectum | SER | 2.60e-04 | 6.14e-01 | 0.0131 |
| 10963 | STIP1 | HTA11_10623_2000001011 | Human | Colorectum | AD | 1.43e-02 | 4.30e-01 | -0.0177 |
| 10963 | STIP1 | HTA11_10711_2000001011 | Human | Colorectum | AD | 4.51e-03 | 3.05e-01 | 0.0338 |
| 10963 | STIP1 | HTA11_7696_3000711011 | Human | Colorectum | AD | 4.56e-11 | 4.61e-01 | 0.0674 |
| 10963 | STIP1 | HTA11_6818_2000001021 | Human | Colorectum | AD | 1.07e-06 | 4.83e-01 | 0.0588 |
| 10963 | STIP1 | HTA11_99999970781_79442 | Human | Colorectum | MSS | 2.18e-20 | 6.06e-01 | 0.294 |
| 10963 | STIP1 | HTA11_99999965062_69753 | Human | Colorectum | MSI-H | 1.19e-05 | 1.08e+00 | 0.3487 |
| 10963 | STIP1 | HTA11_99999965104_69814 | Human | Colorectum | MSS | 3.87e-13 | 6.09e-01 | 0.281 |
| 10963 | STIP1 | HTA11_99999971662_82457 | Human | Colorectum | MSS | 4.24e-42 | 1.17e+00 | 0.3859 |
| Page: 1 2 3 4 5 6 7 8 |
| Tissue | Expression Dynamics | Abbreviation |
| Colorectum (GSE201348) |  | FAP: Familial adenomatous polyposis |
| CRC: Colorectal cancer | ||
| Colorectum (HTA11) |  | AD: Adenomas |
| SER: Sessile serrated lesions | ||
| MSI-H: Microsatellite-high colorectal cancer | ||
| MSS: Microsatellite stable colorectal cancer | ||
| Esophagus | 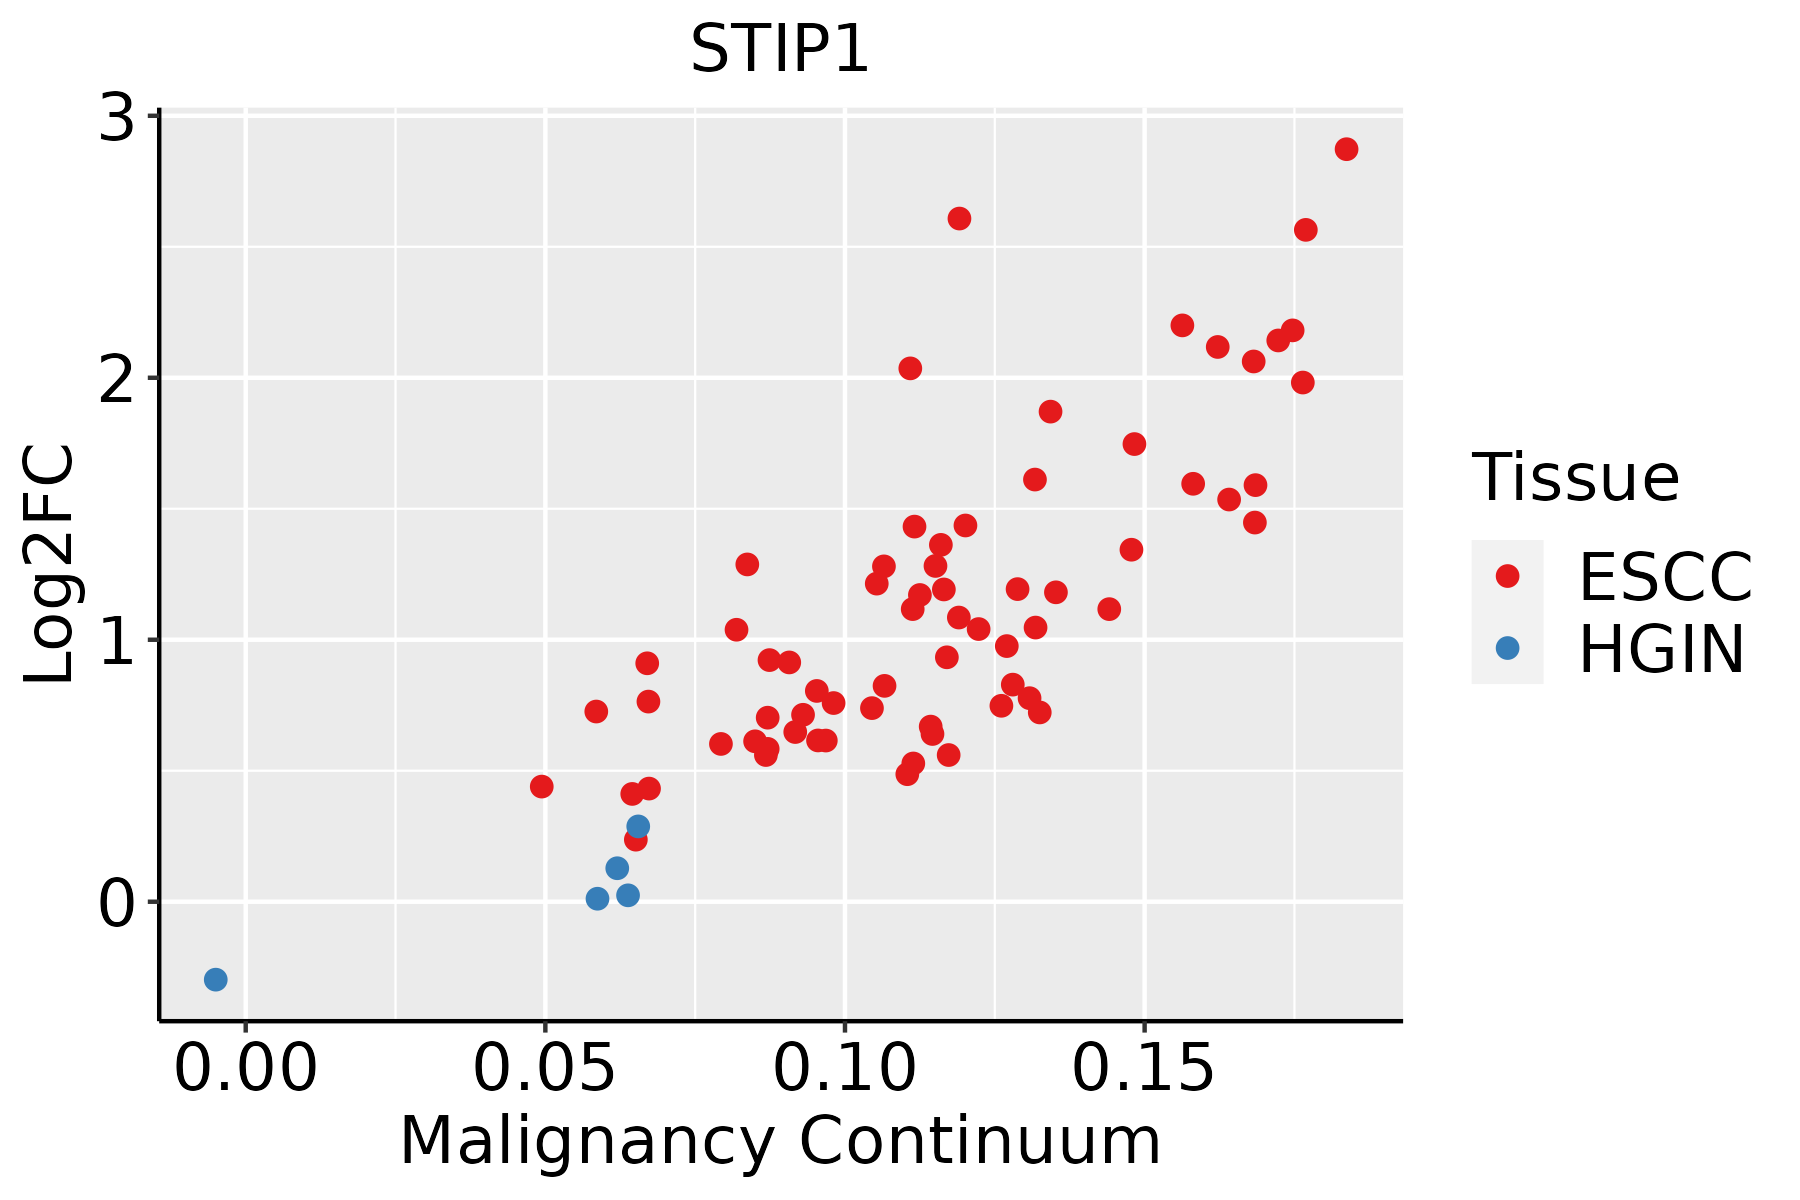 | ESCC: Esophageal squamous cell carcinoma |
| HGIN: High-grade intraepithelial neoplasias | ||
| LGIN: Low-grade intraepithelial neoplasias | ||
| Liver | 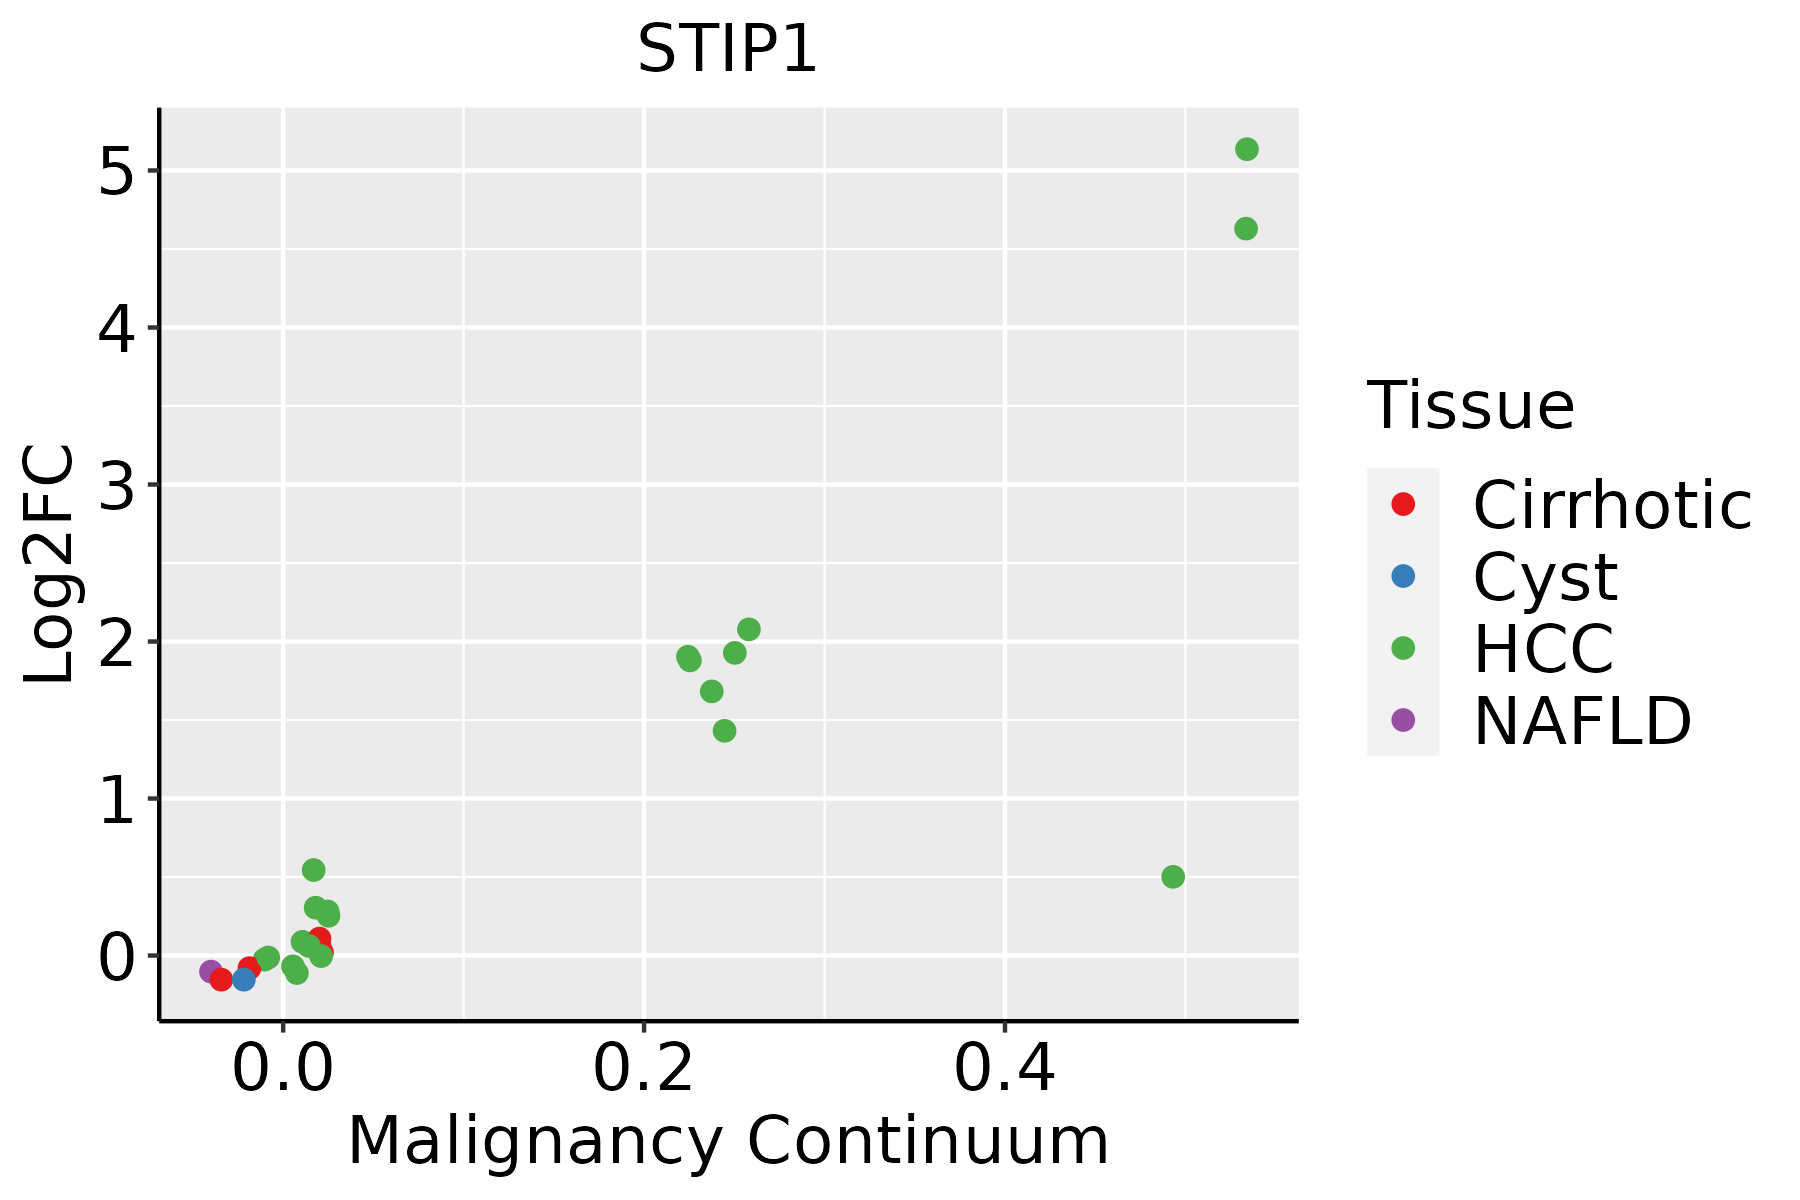 | HCC: Hepatocellular carcinoma |
| NAFLD: Non-alcoholic fatty liver disease | ||
| Oral Cavity |  | EOLP: Erosive Oral lichen planus |
| LP: leukoplakia | ||
| NEOLP: Non-erosive oral lichen planus | ||
| OSCC: Oral squamous cell carcinoma | ||
| Prostate |  | BPH: Benign Prostatic Hyperplasia |
| Skin |  | AK: Actinic keratosis |
| cSCC: Cutaneous squamous cell carcinoma | ||
| SCCIS:squamous cell carcinoma in situ | ||
| Thyroid | 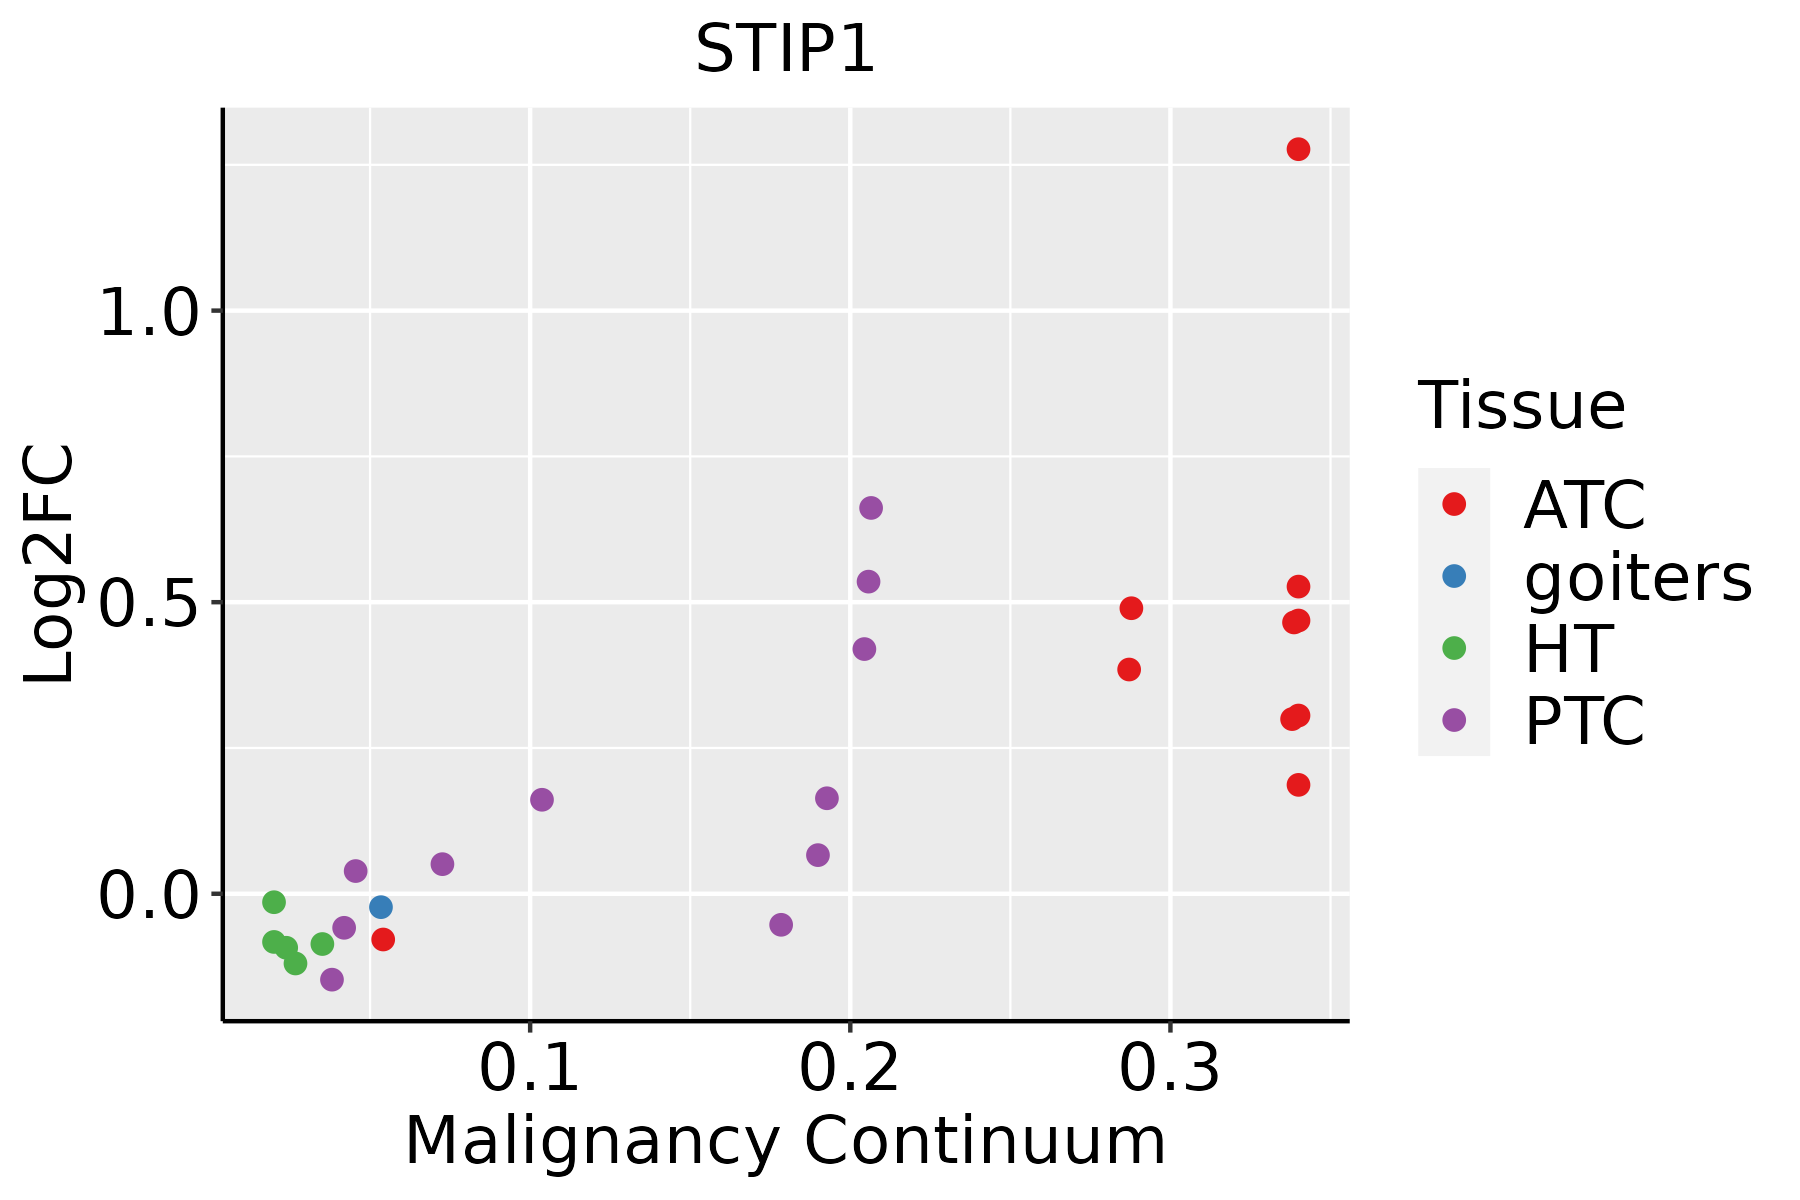 | ATC: Anaplastic thyroid cancer |
| HT: Hashimoto's thyroiditis | ||
| PTC: Papillary thyroid cancer |
| ∗log2FC in expression of this searched gene in stem-like cells from each diseased tissue sample relative to stem-like cells in normal samples in each tissue plotted against the malignancy continuum. Samples are colored based on if they are from different disease stage. |
Top |
Malignant transformation related pathway analysis |
| Find out the enriched GO biological processes and KEGG pathways involved in transition from healthy to precancer to cancer |
| Tissue | Disease Stage | Enriched GO biological Processes |
| Cervix | N_HPV |  |
| Endometrium | AEH |  |
| Endometrium | EEC |  |
| Prostate | BPH |  |
| Prostate | Tumor |  |
| ∗Top 15 enriched GO BP terms are showed in the bar plot of each disease state in each tissue. Each row represents a significant GO biological process which is colored according to the -log10(p.adjust). |
| Page: 1 2 3 4 5 6 7 8 9 |
| GO ID | Tissue | Disease Stage | Description | Gene Ratio | Bg Ratio | pvalue | p.adjust | Count |
| GO:0098760 | Colorectum | AD | response to interleukin-7 | 10/3918 | 15/18723 | 1.68e-04 | 2.29e-03 | 10 |
| GO:0098761 | Colorectum | AD | cellular response to interleukin-7 | 10/3918 | 15/18723 | 1.68e-04 | 2.29e-03 | 10 |
| GO:00987601 | Colorectum | SER | response to interleukin-7 | 8/2897 | 15/18723 | 7.51e-04 | 9.68e-03 | 8 |
| GO:00987611 | Colorectum | SER | cellular response to interleukin-7 | 8/2897 | 15/18723 | 7.51e-04 | 9.68e-03 | 8 |
| GO:00987602 | Colorectum | MSS | response to interleukin-7 | 10/3467 | 15/18723 | 5.64e-05 | 9.87e-04 | 10 |
| GO:00987612 | Colorectum | MSS | cellular response to interleukin-7 | 10/3467 | 15/18723 | 5.64e-05 | 9.87e-04 | 10 |
| GO:00987603 | Colorectum | MSI-H | response to interleukin-7 | 8/1319 | 15/18723 | 2.44e-06 | 1.43e-04 | 8 |
| GO:00987613 | Colorectum | MSI-H | cellular response to interleukin-7 | 8/1319 | 15/18723 | 2.44e-06 | 1.43e-04 | 8 |
| GO:009876019 | Esophagus | HGIN | response to interleukin-7 | 8/2587 | 15/18723 | 3.41e-04 | 5.55e-03 | 8 |
| GO:009876119 | Esophagus | HGIN | cellular response to interleukin-7 | 8/2587 | 15/18723 | 3.41e-04 | 5.55e-03 | 8 |
| GO:0098760110 | Esophagus | ESCC | response to interleukin-7 | 14/8552 | 15/18723 | 1.47e-04 | 9.85e-04 | 14 |
| GO:0098761110 | Esophagus | ESCC | cellular response to interleukin-7 | 14/8552 | 15/18723 | 1.47e-04 | 9.85e-04 | 14 |
| GO:00987607 | Liver | Cirrhotic | response to interleukin-7 | 10/4634 | 15/18723 | 7.26e-04 | 5.36e-03 | 10 |
| GO:00987617 | Liver | Cirrhotic | cellular response to interleukin-7 | 10/4634 | 15/18723 | 7.26e-04 | 5.36e-03 | 10 |
| GO:009876012 | Liver | HCC | response to interleukin-7 | 12/7958 | 15/18723 | 3.56e-03 | 1.59e-02 | 12 |
| GO:009876112 | Liver | HCC | cellular response to interleukin-7 | 12/7958 | 15/18723 | 3.56e-03 | 1.59e-02 | 12 |
| GO:009876017 | Oral cavity | OSCC | response to interleukin-7 | 14/7305 | 15/18723 | 1.79e-05 | 1.74e-04 | 14 |
| GO:009876117 | Oral cavity | OSCC | cellular response to interleukin-7 | 14/7305 | 15/18723 | 1.79e-05 | 1.74e-04 | 14 |
| GO:009876018 | Oral cavity | LP | response to interleukin-7 | 11/4623 | 15/18723 | 1.01e-04 | 1.24e-03 | 11 |
| GO:009876118 | Oral cavity | LP | cellular response to interleukin-7 | 11/4623 | 15/18723 | 1.01e-04 | 1.24e-03 | 11 |
| Page: 1 2 |
| Pathway ID | Tissue | Disease Stage | Description | Gene Ratio | Bg Ratio | pvalue | p.adjust | qvalue | Count |
| hsa05020 | Colorectum | AD | Prion disease | 133/2092 | 273/8465 | 2.47e-18 | 8.29e-17 | 5.29e-17 | 133 |
| hsa050201 | Colorectum | AD | Prion disease | 133/2092 | 273/8465 | 2.47e-18 | 8.29e-17 | 5.29e-17 | 133 |
| hsa050202 | Colorectum | SER | Prion disease | 119/1580 | 273/8465 | 4.61e-22 | 3.06e-20 | 2.22e-20 | 119 |
| hsa050203 | Colorectum | SER | Prion disease | 119/1580 | 273/8465 | 4.61e-22 | 3.06e-20 | 2.22e-20 | 119 |
| hsa050204 | Colorectum | MSS | Prion disease | 129/1875 | 273/8465 | 1.04e-20 | 5.00e-19 | 3.06e-19 | 129 |
| hsa050205 | Colorectum | MSS | Prion disease | 129/1875 | 273/8465 | 1.04e-20 | 5.00e-19 | 3.06e-19 | 129 |
| hsa050206 | Colorectum | MSI-H | Prion disease | 80/797 | 273/8465 | 1.79e-21 | 1.45e-19 | 1.21e-19 | 80 |
| hsa050207 | Colorectum | MSI-H | Prion disease | 80/797 | 273/8465 | 1.79e-21 | 1.45e-19 | 1.21e-19 | 80 |
| hsa0502030 | Esophagus | HGIN | Prion disease | 117/1383 | 273/8465 | 4.15e-26 | 3.38e-24 | 2.69e-24 | 117 |
| hsa05020113 | Esophagus | HGIN | Prion disease | 117/1383 | 273/8465 | 4.15e-26 | 3.38e-24 | 2.69e-24 | 117 |
| hsa05020210 | Esophagus | ESCC | Prion disease | 193/4205 | 273/8465 | 6.42e-13 | 1.34e-11 | 6.89e-12 | 193 |
| hsa0502038 | Esophagus | ESCC | Prion disease | 193/4205 | 273/8465 | 6.42e-13 | 1.34e-11 | 6.89e-12 | 193 |
| hsa0502014 | Liver | Cirrhotic | Prion disease | 152/2530 | 273/8465 | 1.84e-19 | 8.78e-18 | 5.41e-18 | 152 |
| hsa0502015 | Liver | Cirrhotic | Prion disease | 152/2530 | 273/8465 | 1.84e-19 | 8.78e-18 | 5.41e-18 | 152 |
| hsa0502022 | Liver | HCC | Prion disease | 195/4020 | 273/8465 | 3.26e-16 | 1.56e-14 | 8.67e-15 | 195 |
| hsa0502032 | Liver | HCC | Prion disease | 195/4020 | 273/8465 | 3.26e-16 | 1.56e-14 | 8.67e-15 | 195 |
| hsa0502028 | Oral cavity | OSCC | Prion disease | 181/3704 | 273/8465 | 2.05e-14 | 5.30e-13 | 2.70e-13 | 181 |
| hsa05020112 | Oral cavity | OSCC | Prion disease | 181/3704 | 273/8465 | 2.05e-14 | 5.30e-13 | 2.70e-13 | 181 |
| hsa0502029 | Oral cavity | LP | Prion disease | 149/2418 | 273/8465 | 4.88e-20 | 1.81e-18 | 1.16e-18 | 149 |
| hsa0502037 | Oral cavity | LP | Prion disease | 149/2418 | 273/8465 | 4.88e-20 | 1.81e-18 | 1.16e-18 | 149 |
| Page: 1 2 |
Top |
Cell-cell communication analysis |
| Identification of potential cell-cell interactions between two cell types and their ligand-receptor pairs for different disease states |
| Ligand | Receptor | LRpair | Pathway | Tissue | Disease Stage |
| Page: 1 |
Top |
Single-cell gene regulatory network inference analysis |
| Find out the significant the regulons (TFs) and the target genes of each regulon across cell types for different disease states |
| TF | Cell Type | Tissue | Disease Stage | Target Gene | RSS | Regulon Activity |
| ∗The dot plots of a searched regulon are shown for all cell subpopulations in each disease state of each tissue based on the regulon specific score inferred using pySCENIC and by calculating the average expression. |
| Page: 1 |
Top |
Somatic mutation of malignant transformation related genes |
| Annotation of somatic variants for genes involved in malignant transformation |
| Hugo Symbol | Variant Class | Variant Classification | dbSNP RS | HGVSc | HGVSp | HGVSp Short | SWISSPROT | BIOTYPE | SIFT | PolyPhen | Tumor Sample Barcode | Tissue | Histology | Sex | Age | Stage | Therapy Types | Drugs | Outcome |
| STIP1 | SNV | Missense_Mutation | novel | c.114A>C | p.Glu38Asp | p.E38D | P31948 | protein_coding | tolerated_low_confidence(0.34) | benign(0) | TCGA-A2-A3XY-01 | Breast | breast invasive carcinoma | Female | <65 | I/II | Chemotherapy | adriamycin | PD |
| STIP1 | SNV | Missense_Mutation | novel | c.1131C>G | p.His377Gln | p.H377Q | P31948 | protein_coding | deleterious(0) | possibly_damaging(0.877) | TCGA-A8-A07R-01 | Breast | breast invasive carcinoma | Female | >=65 | III/IV | Ancillary | zoledronic | SD |
| STIP1 | SNV | Missense_Mutation | c.340N>G | p.Leu114Val | p.L114V | P31948 | protein_coding | deleterious(0.01) | benign(0.436) | TCGA-BH-A0BZ-01 | Breast | breast invasive carcinoma | Female | <65 | III/IV | Chemotherapy | doxorubicin | CR | |
| STIP1 | SNV | Missense_Mutation | novel | c.1133N>A | p.Arg378Gln | p.R378Q | P31948 | protein_coding | deleterious(0) | probably_damaging(0.97) | TCGA-E2-A10C-01 | Breast | breast invasive carcinoma | Female | <65 | I/II | Chemotherapy | cytoxan | SD |
| STIP1 | SNV | Missense_Mutation | c.1507G>C | p.Asp503His | p.D503H | P31948 | protein_coding | deleterious(0) | benign(0.393) | TCGA-EW-A1PB-01 | Breast | breast invasive carcinoma | Female | >=65 | III/IV | Unknown | Unknown | SD | |
| STIP1 | insertion | Nonsense_Mutation | novel | c.413_414insTGCAAGACTGTCGACCTAAAGCCTGACTGGGGCAAGGT | p.Lys139AlafsTer6 | p.K139Afs*6 | P31948 | protein_coding | TCGA-A2-A0D1-01 | Breast | breast invasive carcinoma | Female | >=65 | I/II | Chemotherapy | taxotere | SD | ||
| STIP1 | insertion | Frame_Shift_Ins | novel | c.1133_1134insCGGAG | p.Thr379GlyfsTer17 | p.T379Gfs*17 | P31948 | protein_coding | TCGA-A8-A07R-01 | Breast | breast invasive carcinoma | Female | >=65 | III/IV | Ancillary | zoledronic | SD | ||
| STIP1 | insertion | In_Frame_Ins | novel | c.1429_1430insTTTCACCAT | p.Gly477delinsValSerProCys | p.G477delinsVSPC | P31948 | protein_coding | TCGA-AN-A0FX-01 | Breast | breast invasive carcinoma | Female | <65 | I/II | Unknown | Unknown | SD | ||
| STIP1 | insertion | Frame_Shift_Ins | novel | c.1431_1432insTGGCCAGGCTGGTGTCAAACTCC | p.Tyr478TrpfsTer19 | p.Y478Wfs*19 | P31948 | protein_coding | TCGA-AN-A0FX-01 | Breast | breast invasive carcinoma | Female | <65 | I/II | Unknown | Unknown | SD | ||
| STIP1 | SNV | Missense_Mutation | novel | c.941N>T | p.Ala314Val | p.A314V | P31948 | protein_coding | deleterious(0) | probably_damaging(1) | TCGA-2W-A8YY-01 | Cervix | cervical & endocervical cancer | Female | <65 | I/II | Chemotherapy | cisplatin | CR |
| Page: 1 2 3 4 5 6 7 |
Top |
Related drugs of malignant transformation related genes |
| Identification of chemicals and drugs interact with genes involved in malignant transfromation |
| (DGIdb 4.0) |
| Entrez ID | Symbol | Category | Interaction Types | Drug Claim Name | Drug Name | PMIDs |
| Page: 1 |

Copyright 2023-Present -The University of Texas Health Science Center at Houston |