
|
|||||
|
 | |
| |
| |
| |
| |
| |
|
Gene: SLC16A1-AS1 |
Gene summary for SLC16A1-AS1 |
| Gene information | Species | Human | Gene symbol | SLC16A1-AS1 | Gene ID | 100506392 |
| Gene name | SLC16A1 antisense RNA 1 | |
| Gene Alias | SLC16A1-AS1 | |
| Cytomap | 1p13.2 | |
| Gene Type | ncRNA | GO ID | NA | UniProtAcc | NA |
Top |
Malignant transformation analysis |
| Identification of the aberrant gene expression in precancerous and cancerous lesions by comparing the gene expression of stem-like cells in diseased tissues with normal stem cells |
| Entrez ID | Symbol | Replicates | Species | Organ | Tissue | Adj P-value | Log2FC | Malignancy |
| 100506392 | SLC16A1-AS1 | HTA11_3410_2000001011 | Human | Colorectum | AD | 6.35e-04 | 2.81e-01 | 0.0155 |
| 100506392 | SLC16A1-AS1 | HTA11_1391_2000001011 | Human | Colorectum | AD | 4.37e-04 | 4.47e-01 | -0.059 |
| 100506392 | SLC16A1-AS1 | HTA11_7696_3000711011 | Human | Colorectum | AD | 5.79e-08 | 4.61e-01 | 0.0674 |
| 100506392 | SLC16A1-AS1 | HTA11_99999970781_79442 | Human | Colorectum | MSS | 1.17e-10 | 5.45e-01 | 0.294 |
| 100506392 | SLC16A1-AS1 | HTA11_99999971662_82457 | Human | Colorectum | MSS | 1.02e-20 | 8.61e-01 | 0.3859 |
| 100506392 | SLC16A1-AS1 | A015-C-104 | Human | Colorectum | FAP | 7.03e-03 | -1.22e-01 | -0.1899 |
| 100506392 | SLC16A1-AS1 | A002-C-016 | Human | Colorectum | FAP | 4.38e-06 | -1.45e-01 | 0.0521 |
| 100506392 | SLC16A1-AS1 | CRC-1-8810 | Human | Colorectum | CRC | 3.97e-03 | 3.98e-01 | 0.6257 |
| 100506392 | SLC16A1-AS1 | LZE7T | Human | Esophagus | ESCC | 1.75e-02 | 1.29e-01 | 0.0667 |
| 100506392 | SLC16A1-AS1 | LZE6T | Human | Esophagus | ESCC | 5.05e-03 | 1.58e-01 | 0.0845 |
| 100506392 | SLC16A1-AS1 | P2T-E | Human | Esophagus | ESCC | 5.92e-17 | 4.07e-01 | 0.1177 |
| 100506392 | SLC16A1-AS1 | P4T-E | Human | Esophagus | ESCC | 1.88e-02 | 1.40e-01 | 0.1323 |
| 100506392 | SLC16A1-AS1 | P5T-E | Human | Esophagus | ESCC | 6.75e-12 | 3.49e-01 | 0.1327 |
| 100506392 | SLC16A1-AS1 | P9T-E | Human | Esophagus | ESCC | 9.10e-04 | 1.53e-01 | 0.1131 |
| 100506392 | SLC16A1-AS1 | P10T-E | Human | Esophagus | ESCC | 3.31e-41 | 8.38e-01 | 0.116 |
| 100506392 | SLC16A1-AS1 | P11T-E | Human | Esophagus | ESCC | 2.53e-02 | 1.02e-01 | 0.1426 |
| 100506392 | SLC16A1-AS1 | P12T-E | Human | Esophagus | ESCC | 8.74e-20 | 4.77e-01 | 0.1122 |
| 100506392 | SLC16A1-AS1 | P15T-E | Human | Esophagus | ESCC | 5.91e-03 | 9.31e-02 | 0.1149 |
| 100506392 | SLC16A1-AS1 | P16T-E | Human | Esophagus | ESCC | 2.23e-02 | 9.96e-02 | 0.1153 |
| 100506392 | SLC16A1-AS1 | P20T-E | Human | Esophagus | ESCC | 1.30e-13 | 2.20e-01 | 0.1124 |
| Page: 1 2 3 4 |
| Tissue | Expression Dynamics | Abbreviation |
| Colorectum (GSE201348) |  | FAP: Familial adenomatous polyposis |
| CRC: Colorectal cancer | ||
| Colorectum (HTA11) |  | AD: Adenomas |
| SER: Sessile serrated lesions | ||
| MSI-H: Microsatellite-high colorectal cancer | ||
| MSS: Microsatellite stable colorectal cancer | ||
| Esophagus |  | ESCC: Esophageal squamous cell carcinoma |
| HGIN: High-grade intraepithelial neoplasias | ||
| LGIN: Low-grade intraepithelial neoplasias | ||
| Liver |  | HCC: Hepatocellular carcinoma |
| NAFLD: Non-alcoholic fatty liver disease | ||
| Oral Cavity |  | EOLP: Erosive Oral lichen planus |
| LP: leukoplakia | ||
| NEOLP: Non-erosive oral lichen planus | ||
| OSCC: Oral squamous cell carcinoma | ||
| Thyroid | 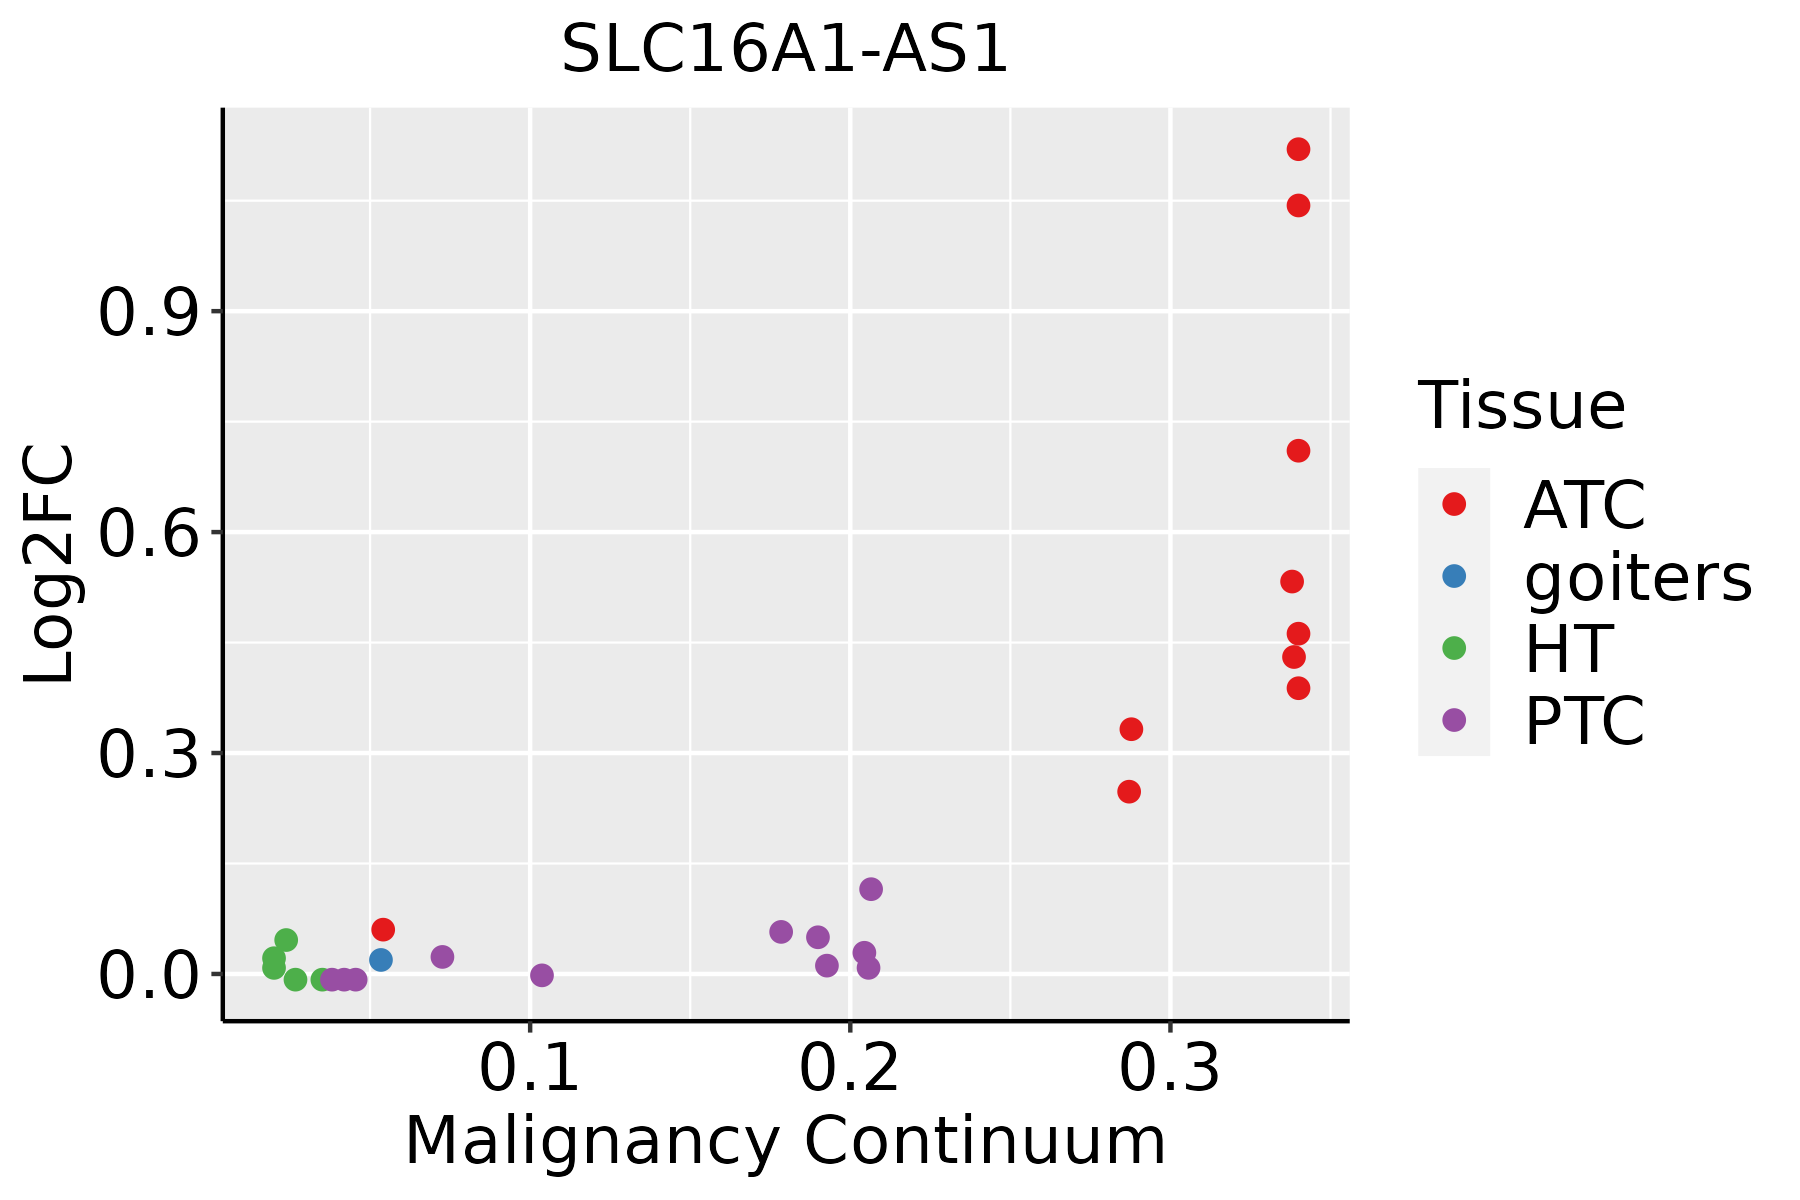 | ATC: Anaplastic thyroid cancer |
| HT: Hashimoto's thyroiditis | ||
| PTC: Papillary thyroid cancer |
| ∗log2FC in expression of this searched gene in stem-like cells from each diseased tissue sample relative to stem-like cells in normal samples in each tissue plotted against the malignancy continuum. Samples are colored based on if they are from different disease stage. |
Top |
Malignant transformation related pathway analysis |
| Find out the enriched GO biological processes and KEGG pathways involved in transition from healthy to precancer to cancer |
| Tissue | Disease Stage | Enriched GO biological Processes |
| Cervix | N_HPV |  |
| Endometrium | AEH |  |
| Endometrium | EEC |  |
| Prostate | BPH |  |
| Prostate | Tumor |  |
| ∗Top 15 enriched GO BP terms are showed in the bar plot of each disease state in each tissue. Each row represents a significant GO biological process which is colored according to the -log10(p.adjust). |
| Page: 1 2 3 4 5 6 7 8 9 |
| GO ID | Tissue | Disease Stage | Description | Gene Ratio | Bg Ratio | pvalue | p.adjust | Count |
| Page: 1 |
| Pathway ID | Tissue | Disease Stage | Description | Gene Ratio | Bg Ratio | pvalue | p.adjust | qvalue | Count |
| Page: 1 |
Top |
Cell-cell communication analysis |
| Identification of potential cell-cell interactions between two cell types and their ligand-receptor pairs for different disease states |
| Ligand | Receptor | LRpair | Pathway | Tissue | Disease Stage |
| Page: 1 |
Top |
Single-cell gene regulatory network inference analysis |
| Find out the significant the regulons (TFs) and the target genes of each regulon across cell types for different disease states |
| TF | Cell Type | Tissue | Disease Stage | Target Gene | RSS | Regulon Activity |
| ∗The dot plots of a searched regulon are shown for all cell subpopulations in each disease state of each tissue based on the regulon specific score inferred using pySCENIC and by calculating the average expression. |
| Page: 1 |
Top |
Somatic mutation of malignant transformation related genes |
| Annotation of somatic variants for genes involved in malignant transformation |
| Hugo Symbol | Variant Class | Variant Classification | dbSNP RS | HGVSc | HGVSp | HGVSp Short | SWISSPROT | BIOTYPE | SIFT | PolyPhen | Tumor Sample Barcode | Tissue | Histology | Sex | Age | Stage | Therapy Types | Drugs | Outcome |
| Page: 1 |
Top |
Related drugs of malignant transformation related genes |
| Identification of chemicals and drugs interact with genes involved in malignant transfromation |
| (DGIdb 4.0) |
| Entrez ID | Symbol | Category | Interaction Types | Drug Claim Name | Drug Name | PMIDs |
| Page: 1 |

Copyright 2023-Present -The University of Texas Health Science Center at Houston |