
|
|||||
|
 | |
| |
| |
| |
| |
| |
|
Gene: SEPTIN10 |
Gene summary for SEPTIN10 |
| Gene information | Species | Human | Gene symbol | SEPTIN10 | Gene ID | 151011 |
| Gene name | septin 10 | |
| Gene Alias | SEPT10 | |
| Cytomap | 2q13 | |
| Gene Type | protein-coding | GO ID | GO:0000910 | UniProtAcc | B7Z371 |
Top |
Malignant transformation analysis |
| Identification of the aberrant gene expression in precancerous and cancerous lesions by comparing the gene expression of stem-like cells in diseased tissues with normal stem cells |
| Entrez ID | Symbol | Replicates | Species | Organ | Tissue | Adj P-value | Log2FC | Malignancy |
| 151011 | SEPTIN10 | HTA11_3410_2000001011 | Human | Colorectum | AD | 5.90e-11 | 2.41e-01 | 0.0155 |
| 151011 | SEPTIN10 | HTA11_2487_2000001011 | Human | Colorectum | SER | 2.31e-21 | 5.82e-01 | -0.1808 |
| 151011 | SEPTIN10 | HTA11_2951_2000001011 | Human | Colorectum | AD | 3.40e-02 | 1.93e-01 | 0.0216 |
| 151011 | SEPTIN10 | HTA11_1938_2000001011 | Human | Colorectum | AD | 2.53e-23 | 5.63e-01 | -0.0811 |
| 151011 | SEPTIN10 | HTA11_78_2000001011 | Human | Colorectum | AD | 3.53e-25 | 5.74e-01 | -0.1088 |
| 151011 | SEPTIN10 | HTA11_347_2000001011 | Human | Colorectum | AD | 4.40e-49 | 8.86e-01 | -0.1954 |
| 151011 | SEPTIN10 | HTA11_411_2000001011 | Human | Colorectum | SER | 3.33e-15 | 8.27e-01 | -0.2602 |
| 151011 | SEPTIN10 | HTA11_2112_2000001011 | Human | Colorectum | SER | 5.26e-10 | 7.06e-01 | -0.2196 |
| 151011 | SEPTIN10 | HTA11_3361_2000001011 | Human | Colorectum | AD | 2.02e-14 | 4.28e-01 | -0.1207 |
| 151011 | SEPTIN10 | HTA11_83_2000001011 | Human | Colorectum | SER | 1.71e-21 | 6.06e-01 | -0.1526 |
| 151011 | SEPTIN10 | HTA11_696_2000001011 | Human | Colorectum | AD | 4.78e-17 | 3.33e-01 | -0.1464 |
| 151011 | SEPTIN10 | HTA11_866_2000001011 | Human | Colorectum | AD | 1.23e-23 | 4.18e-01 | -0.1001 |
| 151011 | SEPTIN10 | HTA11_1391_2000001011 | Human | Colorectum | AD | 2.44e-13 | 3.15e-01 | -0.059 |
| 151011 | SEPTIN10 | HTA11_2992_2000001011 | Human | Colorectum | SER | 2.31e-08 | 4.44e-01 | -0.1706 |
| 151011 | SEPTIN10 | HTA11_5216_2000001011 | Human | Colorectum | SER | 3.34e-04 | 2.80e-01 | -0.1462 |
| 151011 | SEPTIN10 | HTA11_546_2000001011 | Human | Colorectum | AD | 2.76e-07 | 2.75e-01 | -0.0842 |
| 151011 | SEPTIN10 | HTA11_7862_2000001011 | Human | Colorectum | AD | 1.38e-12 | 4.82e-01 | -0.0179 |
| 151011 | SEPTIN10 | HTA11_866_3004761011 | Human | Colorectum | AD | 7.84e-09 | 2.33e-01 | 0.096 |
| 151011 | SEPTIN10 | HTA11_4255_2000001011 | Human | Colorectum | SER | 3.22e-05 | 3.36e-01 | 0.0446 |
| 151011 | SEPTIN10 | HTA11_7663_2000001011 | Human | Colorectum | SER | 7.22e-10 | 5.85e-01 | 0.0131 |
| Page: 1 2 3 |
| Tissue | Expression Dynamics | Abbreviation |
| Colorectum (GSE201348) |  | FAP: Familial adenomatous polyposis |
| CRC: Colorectal cancer | ||
| Colorectum (HTA11) |  | AD: Adenomas |
| SER: Sessile serrated lesions | ||
| MSI-H: Microsatellite-high colorectal cancer | ||
| MSS: Microsatellite stable colorectal cancer | ||
| Esophagus |  | ESCC: Esophageal squamous cell carcinoma |
| HGIN: High-grade intraepithelial neoplasias | ||
| LGIN: Low-grade intraepithelial neoplasias | ||
| Lung | 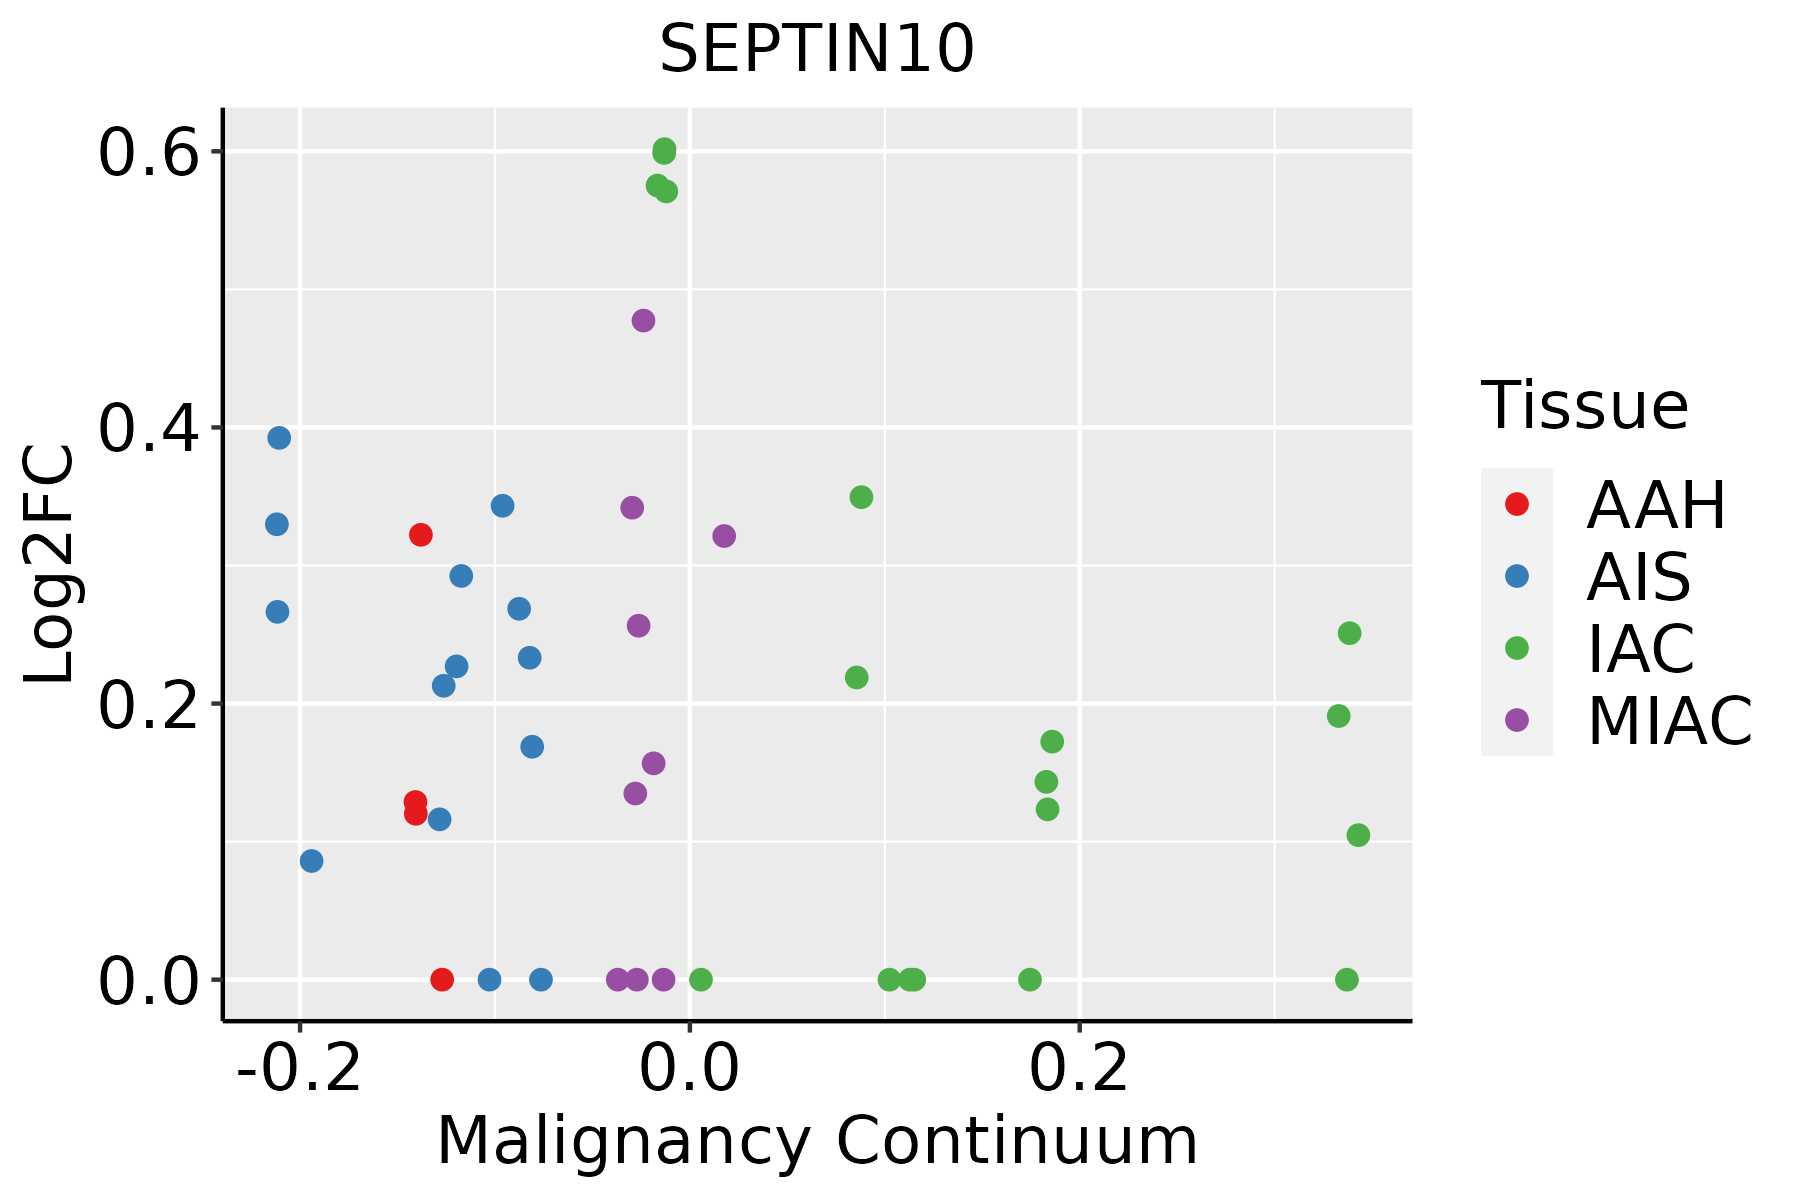 | AAH: Atypical adenomatous hyperplasia |
| AIS: Adenocarcinoma in situ | ||
| IAC: Invasive lung adenocarcinoma | ||
| MIA: Minimally invasive adenocarcinoma | ||
| Skin | 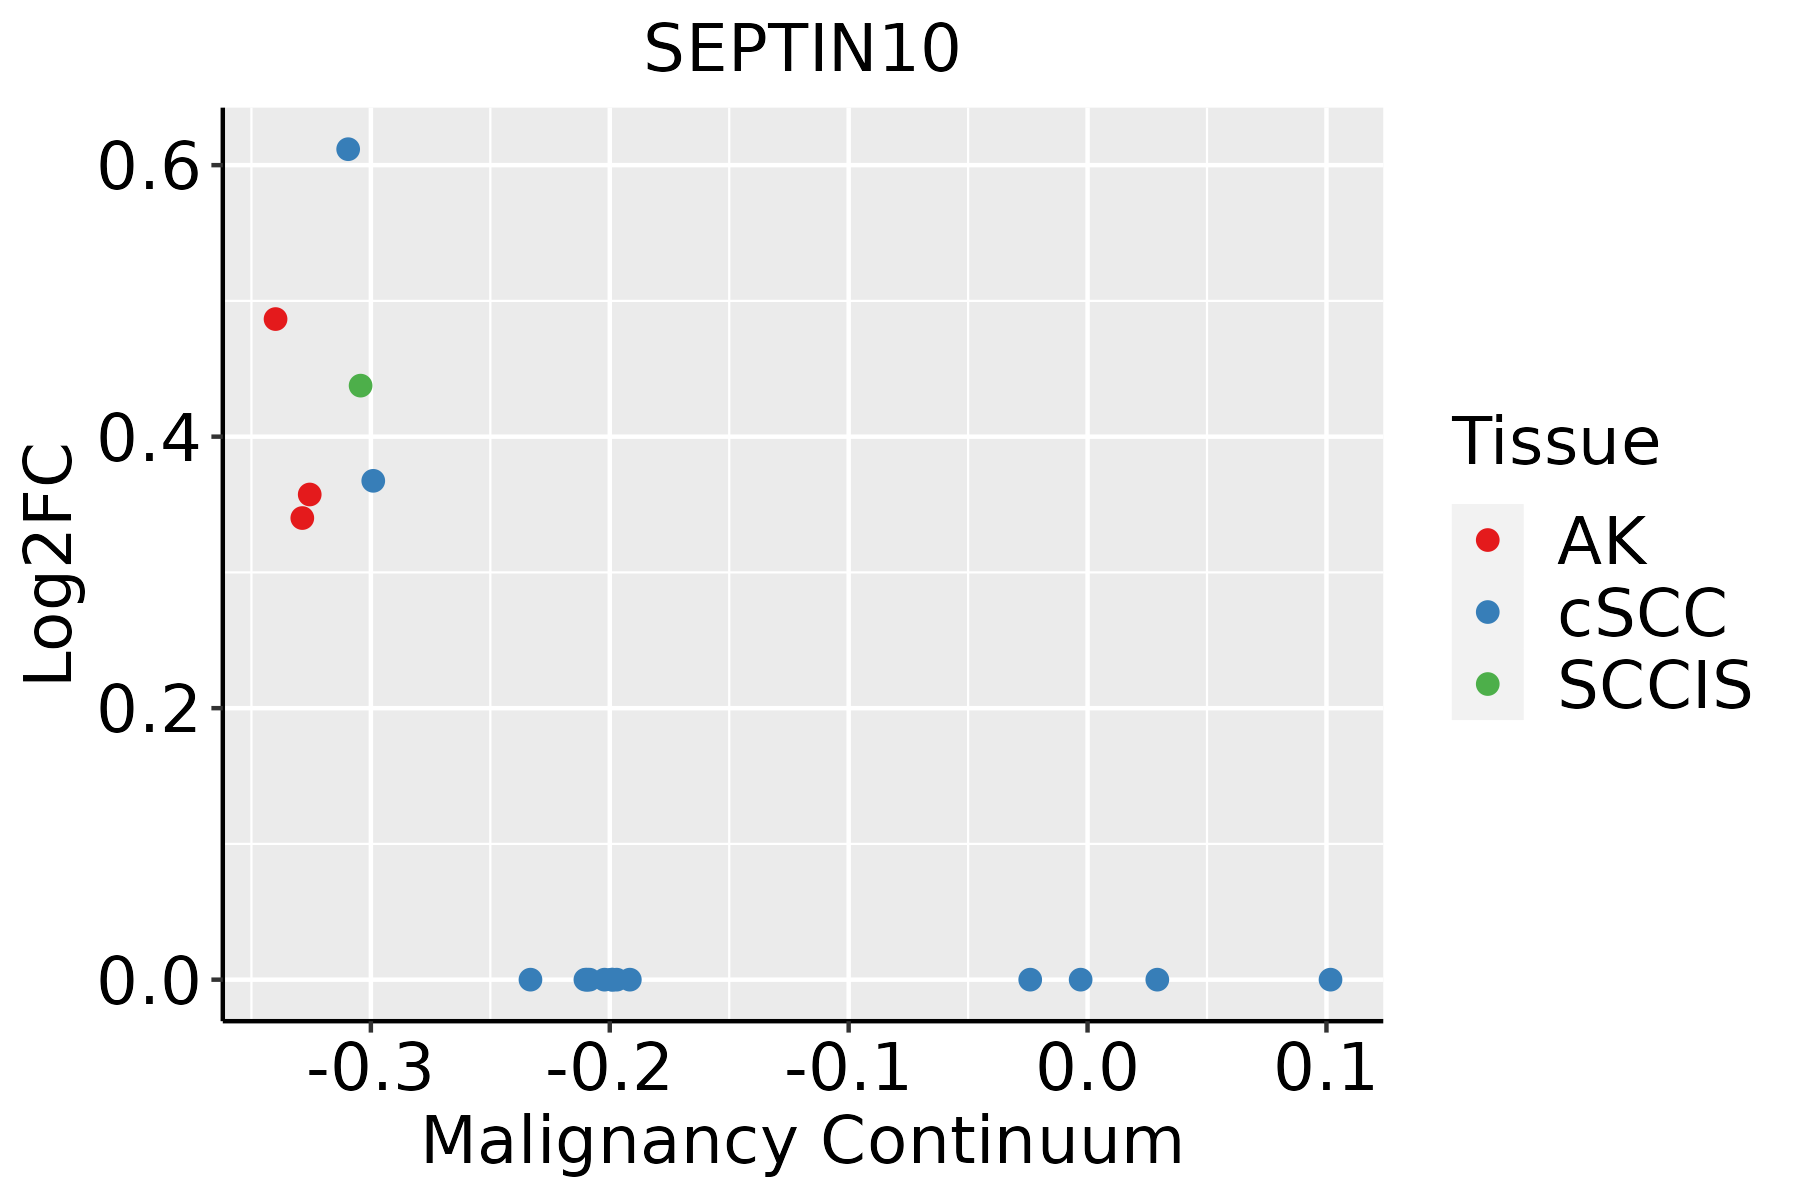 | AK: Actinic keratosis |
| cSCC: Cutaneous squamous cell carcinoma | ||
| SCCIS:squamous cell carcinoma in situ |
| ∗log2FC in expression of this searched gene in stem-like cells from each diseased tissue sample relative to stem-like cells in normal samples in each tissue plotted against the malignancy continuum. Samples are colored based on if they are from different disease stage. |
Top |
Malignant transformation related pathway analysis |
| Find out the enriched GO biological processes and KEGG pathways involved in transition from healthy to precancer to cancer |
| Tissue | Disease Stage | Enriched GO biological Processes |
| Cervix | N_HPV |  |
| Endometrium | AEH |  |
| Endometrium | EEC |  |
| Prostate | BPH |  |
| Prostate | Tumor |  |
| ∗Top 15 enriched GO BP terms are showed in the bar plot of each disease state in each tissue. Each row represents a significant GO biological process which is colored according to the -log10(p.adjust). |
| Page: 1 2 3 4 5 6 7 8 9 |
| GO ID | Tissue | Disease Stage | Description | Gene Ratio | Bg Ratio | pvalue | p.adjust | Count |
| GO:0000910 | Colorectum | AD | cytokinesis | 59/3918 | 173/18723 | 3.74e-05 | 6.75e-04 | 59 |
| GO:0061640 | Colorectum | AD | cytoskeleton-dependent cytokinesis | 37/3918 | 100/18723 | 1.58e-04 | 2.20e-03 | 37 |
| GO:00009101 | Colorectum | SER | cytokinesis | 45/2897 | 173/18723 | 2.28e-04 | 3.93e-03 | 45 |
| GO:00616401 | Colorectum | SER | cytoskeleton-dependent cytokinesis | 29/2897 | 100/18723 | 4.25e-04 | 6.25e-03 | 29 |
| GO:000091015 | Esophagus | HGIN | cytokinesis | 44/2587 | 173/18723 | 3.26e-05 | 8.32e-04 | 44 |
| GO:00616406 | Esophagus | HGIN | cytoskeleton-dependent cytokinesis | 27/2587 | 100/18723 | 3.71e-04 | 5.77e-03 | 27 |
| GO:000091016 | Esophagus | ESCC | cytokinesis | 115/8552 | 173/18723 | 2.48e-08 | 4.68e-07 | 115 |
| GO:006164015 | Esophagus | ESCC | cytoskeleton-dependent cytokinesis | 72/8552 | 100/18723 | 8.10e-08 | 1.39e-06 | 72 |
| GO:00009106 | Lung | IAC | cytokinesis | 31/2061 | 173/18723 | 4.28e-03 | 3.41e-02 | 31 |
| GO:000091017 | Skin | AK | cytokinesis | 36/1910 | 173/18723 | 2.48e-05 | 4.47e-04 | 36 |
| GO:00616407 | Skin | AK | cytoskeleton-dependent cytokinesis | 20/1910 | 100/18723 | 2.43e-03 | 1.59e-02 | 20 |
| GO:000091018 | Skin | SCCIS | cytokinesis | 18/919 | 173/18723 | 2.16e-03 | 2.18e-02 | 18 |
| GO:006164016 | Skin | cSCC | cytoskeleton-dependent cytokinesis | 57/4864 | 100/18723 | 4.65e-11 | 2.21e-09 | 57 |
| GO:000091021 | Skin | cSCC | cytokinesis | 84/4864 | 173/18723 | 1.36e-10 | 6.04e-09 | 84 |
| Page: 1 |
| Pathway ID | Tissue | Disease Stage | Description | Gene Ratio | Bg Ratio | pvalue | p.adjust | qvalue | Count |
| Page: 1 |
Top |
Cell-cell communication analysis |
| Identification of potential cell-cell interactions between two cell types and their ligand-receptor pairs for different disease states |
| Ligand | Receptor | LRpair | Pathway | Tissue | Disease Stage |
| Page: 1 |
Top |
Single-cell gene regulatory network inference analysis |
| Find out the significant the regulons (TFs) and the target genes of each regulon across cell types for different disease states |
| TF | Cell Type | Tissue | Disease Stage | Target Gene | RSS | Regulon Activity |
| ∗The dot plots of a searched regulon are shown for all cell subpopulations in each disease state of each tissue based on the regulon specific score inferred using pySCENIC and by calculating the average expression. |
| Page: 1 |
Top |
Somatic mutation of malignant transformation related genes |
| Annotation of somatic variants for genes involved in malignant transformation |
| Hugo Symbol | Variant Class | Variant Classification | dbSNP RS | HGVSc | HGVSp | HGVSp Short | SWISSPROT | BIOTYPE | SIFT | PolyPhen | Tumor Sample Barcode | Tissue | Histology | Sex | Age | Stage | Therapy Types | Drugs | Outcome |
| Page: 1 |
Top |
Related drugs of malignant transformation related genes |
| Identification of chemicals and drugs interact with genes involved in malignant transfromation |
| (DGIdb 4.0) |
| Entrez ID | Symbol | Category | Interaction Types | Drug Claim Name | Drug Name | PMIDs |
| Page: 1 |

Copyright 2023-Present -The University of Texas Health Science Center at Houston |