
|
|||||
|
 | |
| |
| |
| |
| |
| |
|
Gene: POU2F1 |
Gene summary for POU2F1 |
| Gene information | Species | Human | Gene symbol | POU2F1 | Gene ID | 5451 |
| Gene name | POU class 2 homeobox 1 | |
| Gene Alias | OCT1 | |
| Cytomap | 1q24.2 | |
| Gene Type | protein-coding | GO ID | GO:0006139 | UniProtAcc | P14859 |
Top |
Malignant transformation analysis |
| Identification of the aberrant gene expression in precancerous and cancerous lesions by comparing the gene expression of stem-like cells in diseased tissues with normal stem cells |
| Entrez ID | Symbol | Replicates | Species | Organ | Tissue | Adj P-value | Log2FC | Malignancy |
| 5451 | POU2F1 | CCI_1 | Human | Cervix | CC | 5.25e-10 | 1.34e+00 | 0.528 |
| 5451 | POU2F1 | CCI_2 | Human | Cervix | CC | 2.46e-13 | 1.77e+00 | 0.5249 |
| 5451 | POU2F1 | CCI_3 | Human | Cervix | CC | 7.50e-14 | 1.18e+00 | 0.516 |
| 5451 | POU2F1 | LZE2T | Human | Esophagus | ESCC | 5.10e-04 | 6.56e-01 | 0.082 |
| 5451 | POU2F1 | LZE7T | Human | Esophagus | ESCC | 1.45e-03 | 3.28e-01 | 0.0667 |
| 5451 | POU2F1 | LZE22T | Human | Esophagus | ESCC | 1.50e-02 | 2.69e-01 | 0.068 |
| 5451 | POU2F1 | LZE24T | Human | Esophagus | ESCC | 1.82e-09 | 1.67e-01 | 0.0596 |
| 5451 | POU2F1 | P1T-E | Human | Esophagus | ESCC | 4.85e-04 | 3.26e-01 | 0.0875 |
| 5451 | POU2F1 | P2T-E | Human | Esophagus | ESCC | 2.36e-19 | 3.76e-01 | 0.1177 |
| 5451 | POU2F1 | P4T-E | Human | Esophagus | ESCC | 1.15e-10 | 1.90e-01 | 0.1323 |
| 5451 | POU2F1 | P5T-E | Human | Esophagus | ESCC | 3.30e-05 | 1.01e-01 | 0.1327 |
| 5451 | POU2F1 | P8T-E | Human | Esophagus | ESCC | 8.46e-13 | 2.36e-01 | 0.0889 |
| 5451 | POU2F1 | P9T-E | Human | Esophagus | ESCC | 3.09e-09 | 2.02e-01 | 0.1131 |
| 5451 | POU2F1 | P10T-E | Human | Esophagus | ESCC | 1.68e-14 | 3.51e-01 | 0.116 |
| 5451 | POU2F1 | P11T-E | Human | Esophagus | ESCC | 1.53e-04 | 3.50e-01 | 0.1426 |
| 5451 | POU2F1 | P12T-E | Human | Esophagus | ESCC | 1.31e-08 | 2.23e-01 | 0.1122 |
| 5451 | POU2F1 | P15T-E | Human | Esophagus | ESCC | 9.77e-14 | 3.17e-01 | 0.1149 |
| 5451 | POU2F1 | P16T-E | Human | Esophagus | ESCC | 1.15e-07 | 2.19e-01 | 0.1153 |
| 5451 | POU2F1 | P17T-E | Human | Esophagus | ESCC | 1.16e-04 | 1.84e-01 | 0.1278 |
| 5451 | POU2F1 | P20T-E | Human | Esophagus | ESCC | 1.04e-11 | 1.93e-01 | 0.1124 |
| Page: 1 2 3 4 5 |
| Tissue | Expression Dynamics | Abbreviation |
| Cervix | 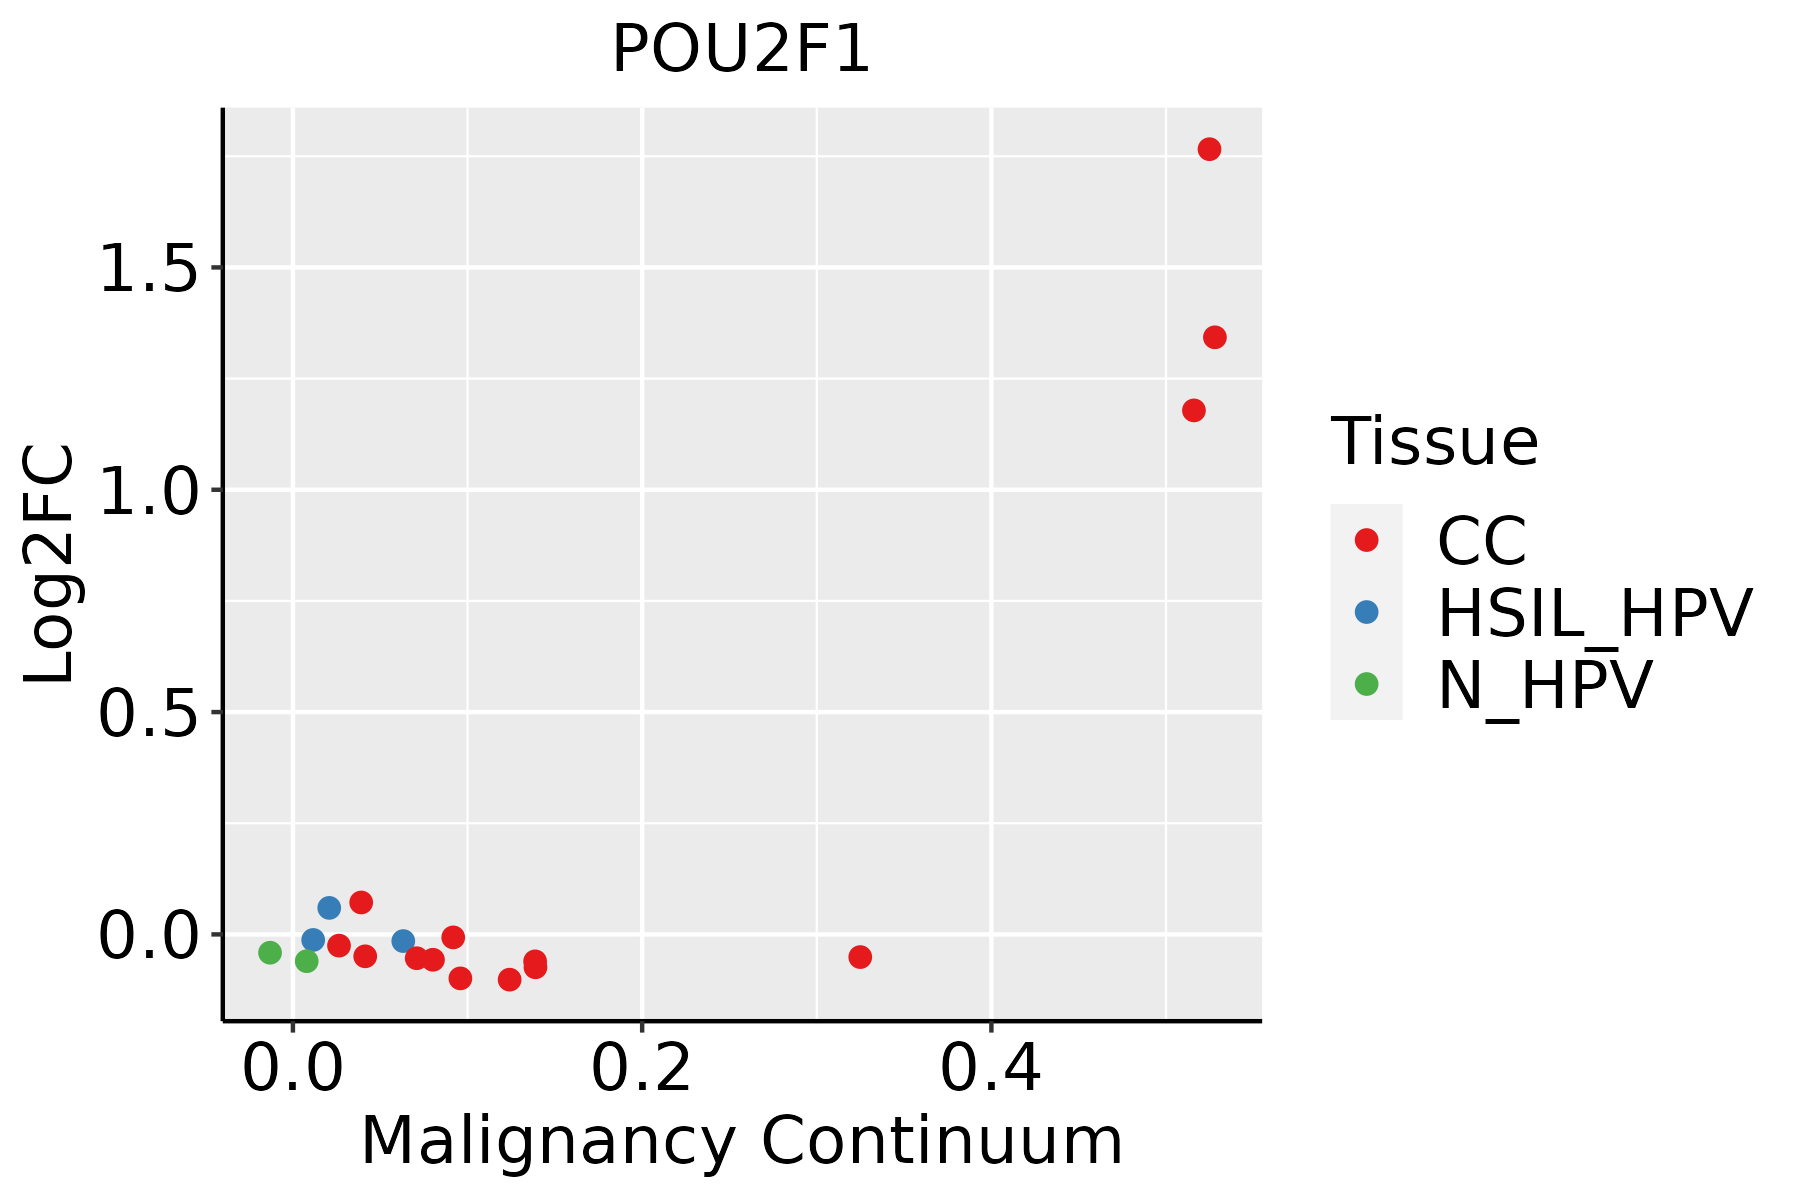 | CC: Cervix cancer |
| HSIL_HPV: HPV-infected high-grade squamous intraepithelial lesions | ||
| N_HPV: HPV-infected normal cervix | ||
| Esophagus | 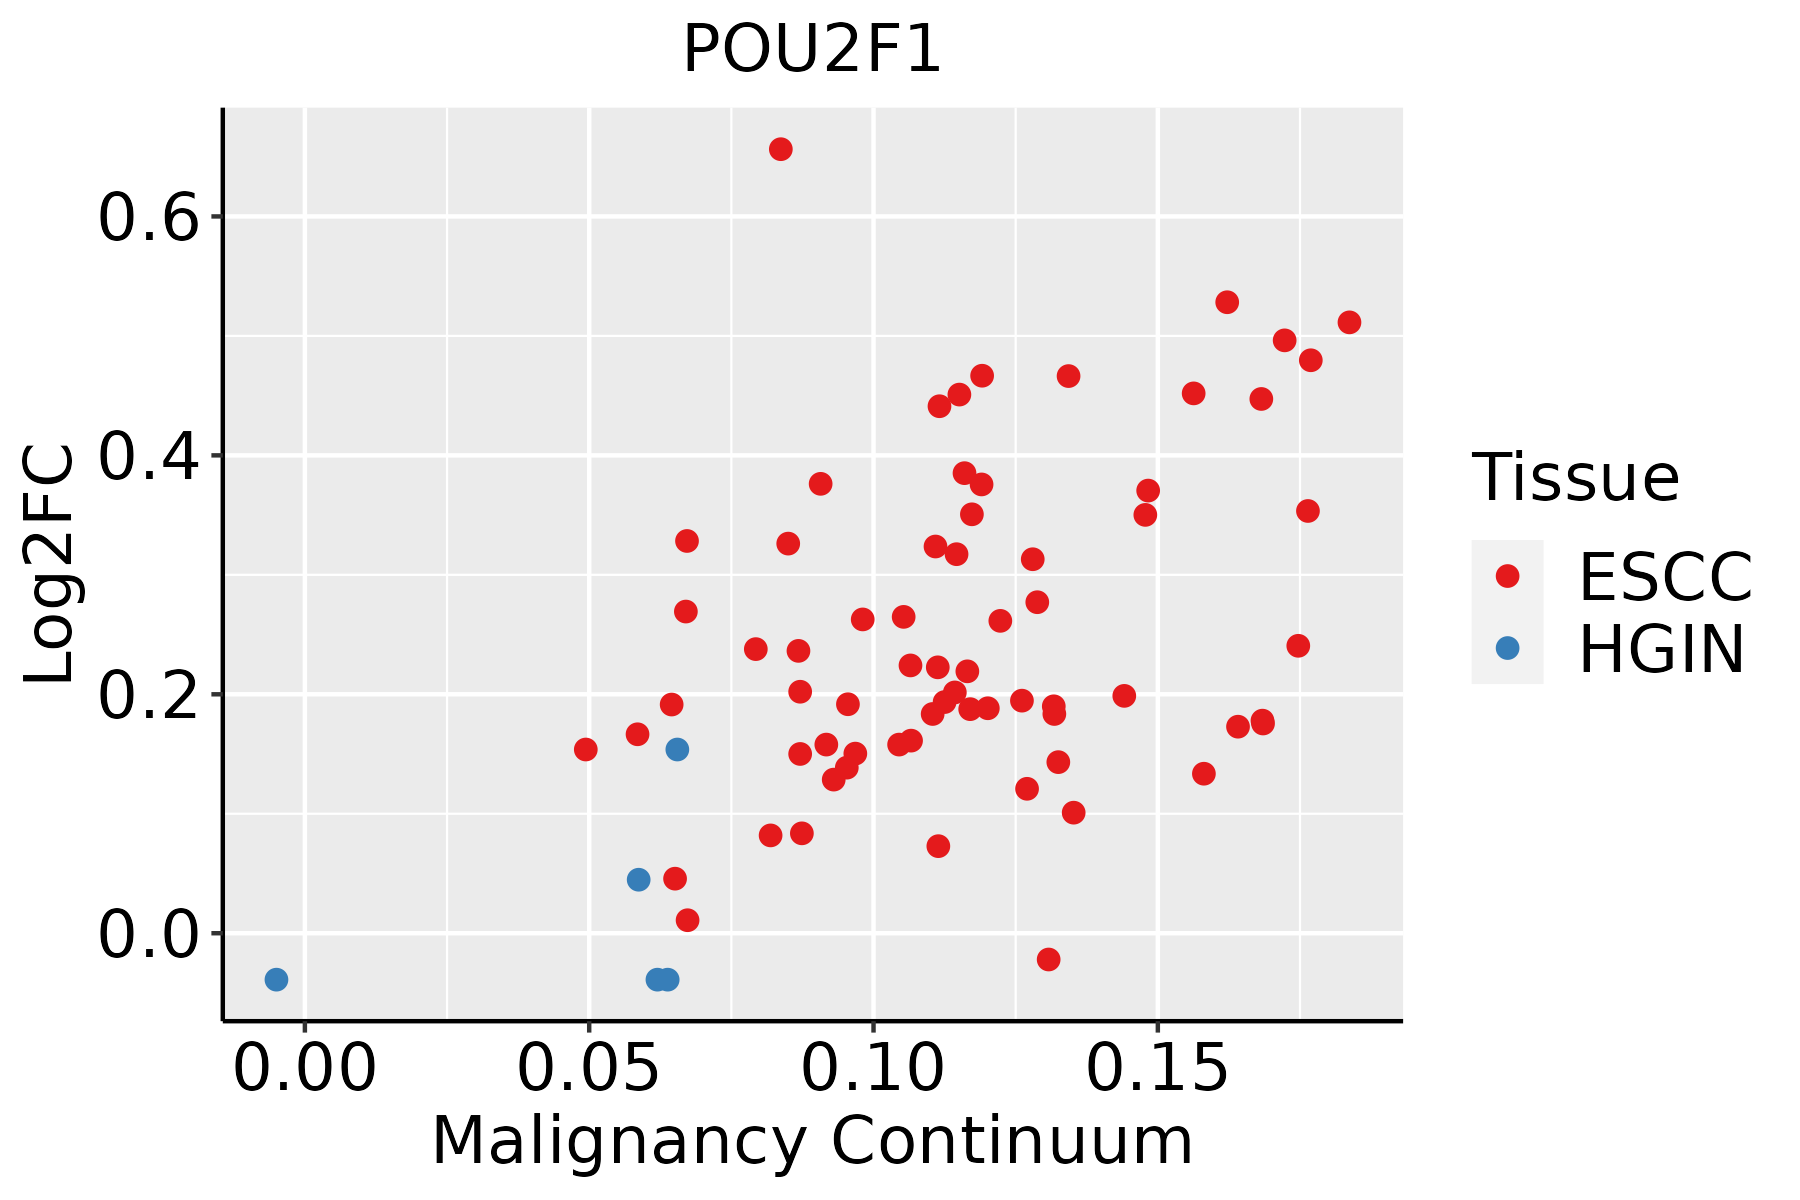 | ESCC: Esophageal squamous cell carcinoma |
| HGIN: High-grade intraepithelial neoplasias | ||
| LGIN: Low-grade intraepithelial neoplasias | ||
| Liver |  | HCC: Hepatocellular carcinoma |
| NAFLD: Non-alcoholic fatty liver disease | ||
| Lung |  | AAH: Atypical adenomatous hyperplasia |
| AIS: Adenocarcinoma in situ | ||
| IAC: Invasive lung adenocarcinoma | ||
| MIA: Minimally invasive adenocarcinoma |
| ∗log2FC in expression of this searched gene in stem-like cells from each diseased tissue sample relative to stem-like cells in normal samples in each tissue plotted against the malignancy continuum. Samples are colored based on if they are from different disease stage. |
Top |
Malignant transformation related pathway analysis |
| Find out the enriched GO biological processes and KEGG pathways involved in transition from healthy to precancer to cancer |
| Tissue | Disease Stage | Enriched GO biological Processes |
| Cervix | N_HPV |  |
| Endometrium | AEH |  |
| Endometrium | EEC |  |
| Prostate | BPH |  |
| Prostate | Tumor |  |
| ∗Top 15 enriched GO BP terms are showed in the bar plot of each disease state in each tissue. Each row represents a significant GO biological process which is colored according to the -log10(p.adjust). |
| Page: 1 2 3 4 5 6 7 8 9 |
| GO ID | Tissue | Disease Stage | Description | Gene Ratio | Bg Ratio | pvalue | p.adjust | Count |
| Page: 1 |
| Pathway ID | Tissue | Disease Stage | Description | Gene Ratio | Bg Ratio | pvalue | p.adjust | qvalue | Count |
| hsa0541720 | Cervix | CC | Lipid and atherosclerosis | 65/1267 | 215/8465 | 6.47e-09 | 1.10e-07 | 6.52e-08 | 65 |
| hsa05417110 | Cervix | CC | Lipid and atherosclerosis | 65/1267 | 215/8465 | 6.47e-09 | 1.10e-07 | 6.52e-08 | 65 |
| hsa05417211 | Esophagus | ESCC | Lipid and atherosclerosis | 143/4205 | 215/8465 | 3.30e-07 | 2.45e-06 | 1.26e-06 | 143 |
| hsa05417310 | Esophagus | ESCC | Lipid and atherosclerosis | 143/4205 | 215/8465 | 3.30e-07 | 2.45e-06 | 1.26e-06 | 143 |
| hsa0541714 | Liver | NAFLD | Lipid and atherosclerosis | 42/1043 | 215/8465 | 1.46e-03 | 1.71e-02 | 1.38e-02 | 42 |
| hsa0541715 | Liver | NAFLD | Lipid and atherosclerosis | 42/1043 | 215/8465 | 1.46e-03 | 1.71e-02 | 1.38e-02 | 42 |
| hsa0541742 | Liver | HCC | Lipid and atherosclerosis | 118/4020 | 215/8465 | 1.66e-02 | 3.92e-02 | 2.18e-02 | 118 |
| hsa0541752 | Liver | HCC | Lipid and atherosclerosis | 118/4020 | 215/8465 | 1.66e-02 | 3.92e-02 | 2.18e-02 | 118 |
| hsa0541716 | Lung | IAC | Lipid and atherosclerosis | 48/1053 | 215/8465 | 3.02e-05 | 6.14e-04 | 4.08e-04 | 48 |
| hsa0541717 | Lung | IAC | Lipid and atherosclerosis | 48/1053 | 215/8465 | 3.02e-05 | 6.14e-04 | 4.08e-04 | 48 |
| hsa0541723 | Lung | AIS | Lipid and atherosclerosis | 46/961 | 215/8465 | 1.33e-05 | 3.32e-04 | 2.12e-04 | 46 |
| hsa0541733 | Lung | AIS | Lipid and atherosclerosis | 46/961 | 215/8465 | 1.33e-05 | 3.32e-04 | 2.12e-04 | 46 |
| Page: 1 |
Top |
Cell-cell communication analysis |
| Identification of potential cell-cell interactions between two cell types and their ligand-receptor pairs for different disease states |
| Ligand | Receptor | LRpair | Pathway | Tissue | Disease Stage |
| Page: 1 |
Top |
Single-cell gene regulatory network inference analysis |
| Find out the significant the regulons (TFs) and the target genes of each regulon across cell types for different disease states |
| TF | Cell Type | Tissue | Disease Stage | Target Gene | RSS | Regulon Activity |
| POU2F1 | CD8TEFF | Breast | DCIS | ZKSCAN1,SUSD1,SLC35A3, etc. | 1.38e-01 |  |
| POU2F1 | CD8TEXP | Cervix | ADJ | DLEU2,MPHOSPH9,NCAPG2, etc. | 2.55e-02 |  |
| POU2F1 | NK | Cervix | Healthy | DLEU2,MPHOSPH9,NCAPG2, etc. | 5.38e-02 |  |
| POU2F1 | NK | Cervix | HSIL_HPV | DLEU2,MPHOSPH9,NCAPG2, etc. | 9.72e-02 |  |
| POU2F1 | STML | Cervix | CC | ASPM,NUF2,KNL1, etc. | 1.33e-01 |  |
| POU2F1 | SSC | Colorectum | Healthy | ZNF441,AC010235.1,PARP12, etc. | 1.36e-01 |  |
| POU2F1 | ABP | Lung | Healthy | PAPD7,LPCAT1,CNOT11, etc. | 2.52e-02 |  |
| POU2F1 | CILIA | Lung | Healthy | PAPD7,LPCAT1,CNOT11, etc. | 1.43e-03 | |
| POU2F1 | ALVMAC | Lung | Healthy | HSPA14,VAMP7,CD40, etc. | 5.25e-03 | |
| POU2F1 | LYMEND | Lung | IAC | ANKAR,MMAA,RRAD, etc. | 3.18e-02 |  |
| ∗The dot plots of a searched regulon are shown for all cell subpopulations in each disease state of each tissue based on the regulon specific score inferred using pySCENIC and by calculating the average expression. |
| Page: 1 2 3 |
Top |
Somatic mutation of malignant transformation related genes |
| Annotation of somatic variants for genes involved in malignant transformation |
| Hugo Symbol | Variant Class | Variant Classification | dbSNP RS | HGVSc | HGVSp | HGVSp Short | SWISSPROT | BIOTYPE | SIFT | PolyPhen | Tumor Sample Barcode | Tissue | Histology | Sex | Age | Stage | Therapy Types | Drugs | Outcome |
| POU2F1 | SNV | Missense_Mutation | c.68N>C | p.Arg23Thr | p.R23T | P14859 | protein_coding | deleterious_low_confidence(0) | benign(0.412) | TCGA-A1-A0SI-01 | Breast | breast invasive carcinoma | Female | <65 | I/II | Unknown | Unknown | SD | |
| POU2F1 | SNV | Missense_Mutation | rs371507009 | c.1939G>A | p.Gly647Ser | p.G647S | P14859 | protein_coding | tolerated(1) | possibly_damaging(0.581) | TCGA-D8-A1JK-01 | Breast | breast invasive carcinoma | Female | >=65 | I/II | Unknown | Unknown | SD |
| POU2F1 | SNV | Missense_Mutation | rs765718905 | c.1264T>G | p.Leu422Val | p.L422V | P14859 | protein_coding | deleterious(0.05) | benign(0) | TCGA-E2-A158-01 | Breast | breast invasive carcinoma | Female | <65 | I/II | Chemotherapy | arimidex | SD |
| POU2F1 | SNV | Missense_Mutation | c.1230N>C | p.Glu410Asp | p.E410D | P14859 | protein_coding | tolerated(0.08) | benign(0.041) | TCGA-EW-A1OX-01 | Breast | breast invasive carcinoma | Female | <65 | I/II | Chemotherapy | taxotere | SD | |
| POU2F1 | insertion | Frame_Shift_Ins | novel | c.67_68insAAAGATTGGG | p.Arg23LysfsTer13 | p.R23Kfs*13 | P14859 | protein_coding | TCGA-AO-A128-01 | Breast | breast invasive carcinoma | Female | <65 | I/II | Chemotherapy | doxorubicin | SD | ||
| POU2F1 | SNV | Missense_Mutation | novel | c.1950C>A | p.Ser650Arg | p.S650R | P14859 | protein_coding | deleterious(0) | probably_damaging(0.994) | TCGA-2W-A8YY-01 | Cervix | cervical & endocervical cancer | Female | <65 | I/II | Chemotherapy | cisplatin | CR |
| POU2F1 | SNV | Missense_Mutation | rs141034916 | c.302C>T | p.Ser101Leu | p.S101L | P14859 | protein_coding | tolerated_low_confidence(0.08) | benign(0.082) | TCGA-EA-A3HU-01 | Cervix | cervical & endocervical cancer | Female | <65 | I/II | Unknown | Unknown | SD |
| POU2F1 | SNV | Missense_Mutation | c.25C>G | p.Gln9Glu | p.Q9E | P14859 | protein_coding | deleterious_low_confidence(0.02) | unknown(0) | TCGA-IR-A3LK-01 | Cervix | cervical & endocervical cancer | Female | >=65 | I/II | Chemotherapy | cisplatin | PD | |
| POU2F1 | SNV | Missense_Mutation | novel | c.1217N>A | p.Arg406His | p.R406H | P14859 | protein_coding | deleterious(0) | probably_damaging(0.979) | TCGA-5M-AAT6-01 | Colorectum | colon adenocarcinoma | Female | <65 | III/IV | Unknown | Unknown | PD |
| POU2F1 | SNV | Missense_Mutation | rs561712054 | c.2158N>A | p.Ala720Thr | p.A720T | P14859 | protein_coding | deleterious(0) | probably_damaging(0.98) | TCGA-A6-A565-01 | Colorectum | colon adenocarcinoma | Female | <65 | III/IV | Unspecific | 5FU | PD |
| Page: 1 2 3 4 5 6 7 8 |
Top |
Related drugs of malignant transformation related genes |
| Identification of chemicals and drugs interact with genes involved in malignant transfromation |
| (DGIdb 4.0) |
| Entrez ID | Symbol | Category | Interaction Types | Drug Claim Name | Drug Name | PMIDs |
| Page: 1 |

Copyright 2023-Present -The University of Texas Health Science Center at Houston |