
|
|||||
|
 | |
| |
| |
| |
| |
| |
|
Gene: PLA2G10 |
Gene summary for PLA2G10 |
| Gene information | Species | Human | Gene symbol | PLA2G10 | Gene ID | 8399 |
| Gene name | phospholipase A2 group X | |
| Gene Alias | GXPLA2 | |
| Cytomap | 16p13.12 | |
| Gene Type | protein-coding | GO ID | GO:0000003 | UniProtAcc | O15496 |
Top |
Malignant transformation analysis |
| Identification of the aberrant gene expression in precancerous and cancerous lesions by comparing the gene expression of stem-like cells in diseased tissues with normal stem cells |
| Entrez ID | Symbol | Replicates | Species | Organ | Tissue | Adj P-value | Log2FC | Malignancy |
| 8399 | PLA2G10 | HTA11_2487_2000001011 | Human | Colorectum | SER | 1.00e-08 | 6.24e-01 | -0.1808 |
| 8399 | PLA2G10 | HTA11_1938_2000001011 | Human | Colorectum | AD | 3.26e-02 | 3.62e-01 | -0.0811 |
| 8399 | PLA2G10 | HTA11_347_2000001011 | Human | Colorectum | AD | 5.68e-24 | 8.13e-01 | -0.1954 |
| 8399 | PLA2G10 | HTA11_411_2000001011 | Human | Colorectum | SER | 2.08e-10 | 1.39e+00 | -0.2602 |
| 8399 | PLA2G10 | HTA11_2112_2000001011 | Human | Colorectum | SER | 1.80e-06 | 1.00e+00 | -0.2196 |
| 8399 | PLA2G10 | HTA11_3361_2000001011 | Human | Colorectum | AD | 1.33e-02 | 5.22e-01 | -0.1207 |
| 8399 | PLA2G10 | HTA11_83_2000001011 | Human | Colorectum | SER | 1.44e-04 | 5.06e-01 | -0.1526 |
| 8399 | PLA2G10 | HTA11_696_2000001011 | Human | Colorectum | AD | 8.46e-18 | 8.52e-01 | -0.1464 |
| 8399 | PLA2G10 | HTA11_866_2000001011 | Human | Colorectum | AD | 2.56e-13 | 5.31e-01 | -0.1001 |
| 8399 | PLA2G10 | HTA11_2992_2000001011 | Human | Colorectum | SER | 8.65e-03 | 5.55e-01 | -0.1706 |
| 8399 | PLA2G10 | HTA11_5212_2000001011 | Human | Colorectum | AD | 1.12e-08 | 9.31e-01 | -0.2061 |
| 8399 | PLA2G10 | A015-C-203 | Human | Colorectum | FAP | 1.16e-05 | -1.49e-01 | -0.1294 |
| 8399 | PLA2G10 | A002-C-201 | Human | Colorectum | FAP | 1.87e-03 | -1.85e-01 | 0.0324 |
| 8399 | PLA2G10 | A002-C-205 | Human | Colorectum | FAP | 1.12e-02 | -1.05e-01 | -0.1236 |
| 8399 | PLA2G10 | A015-C-104 | Human | Colorectum | FAP | 1.60e-02 | -9.48e-02 | -0.1899 |
| 8399 | PLA2G10 | A001-C-014 | Human | Colorectum | FAP | 4.11e-05 | -1.33e-01 | 0.0135 |
| 8399 | PLA2G10 | A002-C-016 | Human | Colorectum | FAP | 1.75e-04 | -1.52e-01 | 0.0521 |
| 8399 | PLA2G10 | A002-C-116 | Human | Colorectum | FAP | 9.66e-04 | -6.74e-02 | -0.0452 |
| 8399 | PLA2G10 | F034 | Human | Colorectum | FAP | 5.54e-03 | -1.57e-01 | -0.0665 |
| 8399 | PLA2G10 | CRC-1-8810 | Human | Colorectum | CRC | 3.24e-05 | -2.02e-01 | 0.6257 |
| Page: 1 2 3 4 |
| Tissue | Expression Dynamics | Abbreviation |
| Colorectum (GSE201348) | 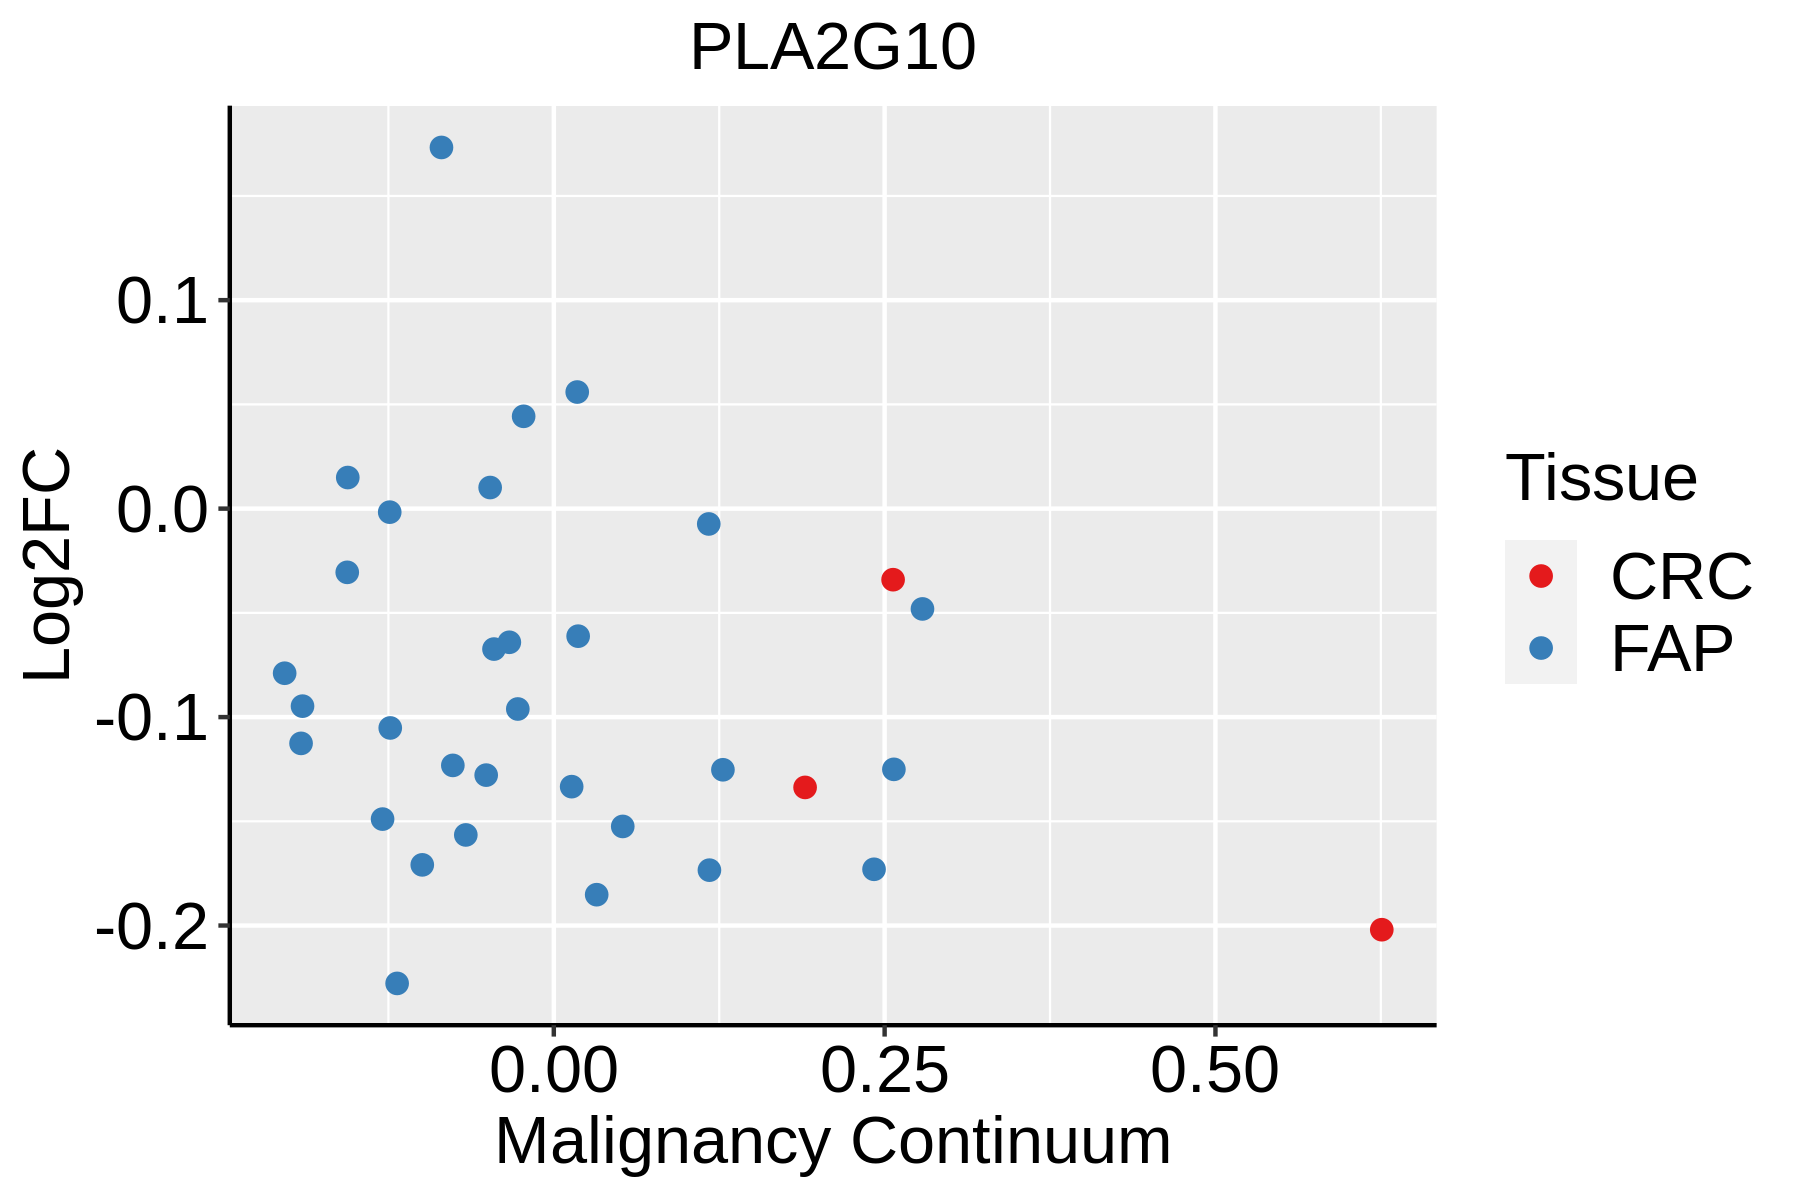 | FAP: Familial adenomatous polyposis |
| CRC: Colorectal cancer | ||
| Colorectum (HTA11) |  | AD: Adenomas |
| SER: Sessile serrated lesions | ||
| MSI-H: Microsatellite-high colorectal cancer | ||
| MSS: Microsatellite stable colorectal cancer | ||
| Esophagus | 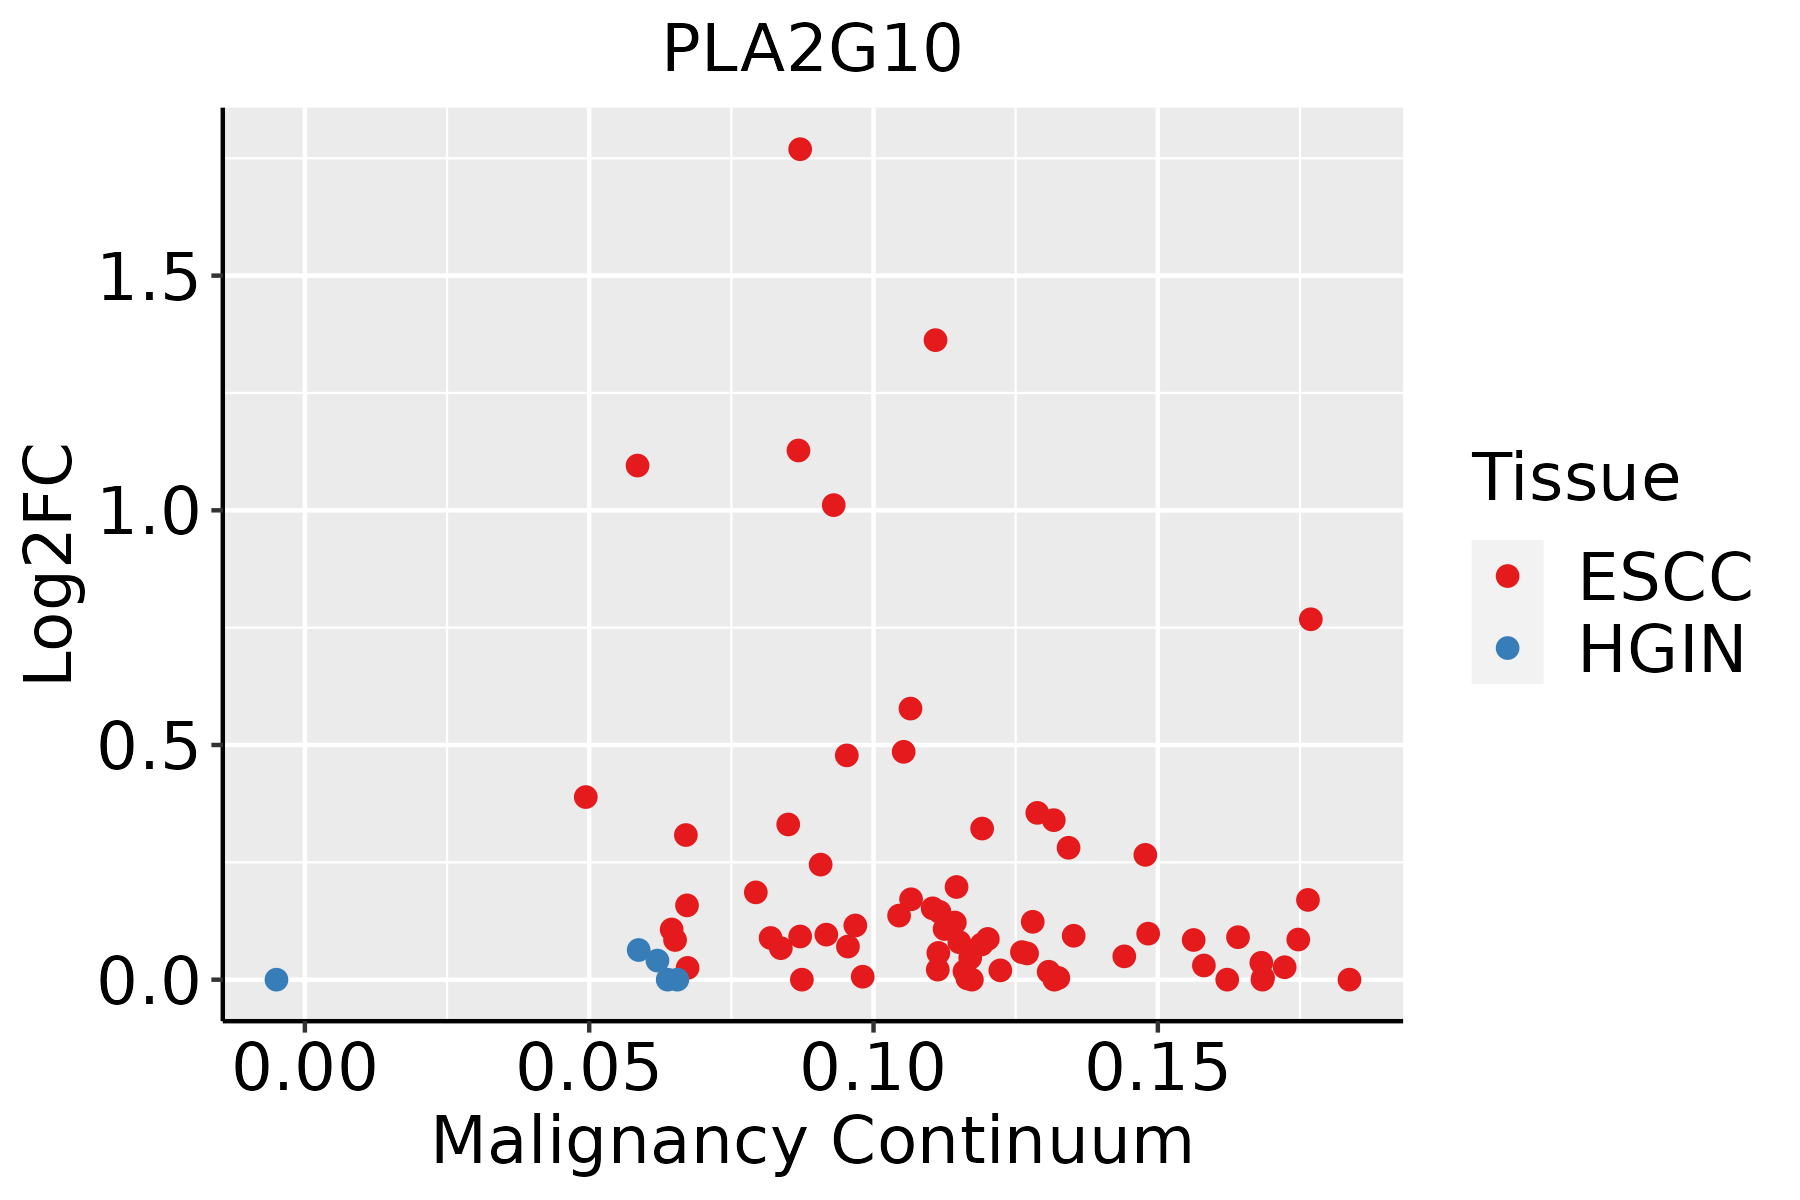 | ESCC: Esophageal squamous cell carcinoma |
| HGIN: High-grade intraepithelial neoplasias | ||
| LGIN: Low-grade intraepithelial neoplasias | ||
| GC | 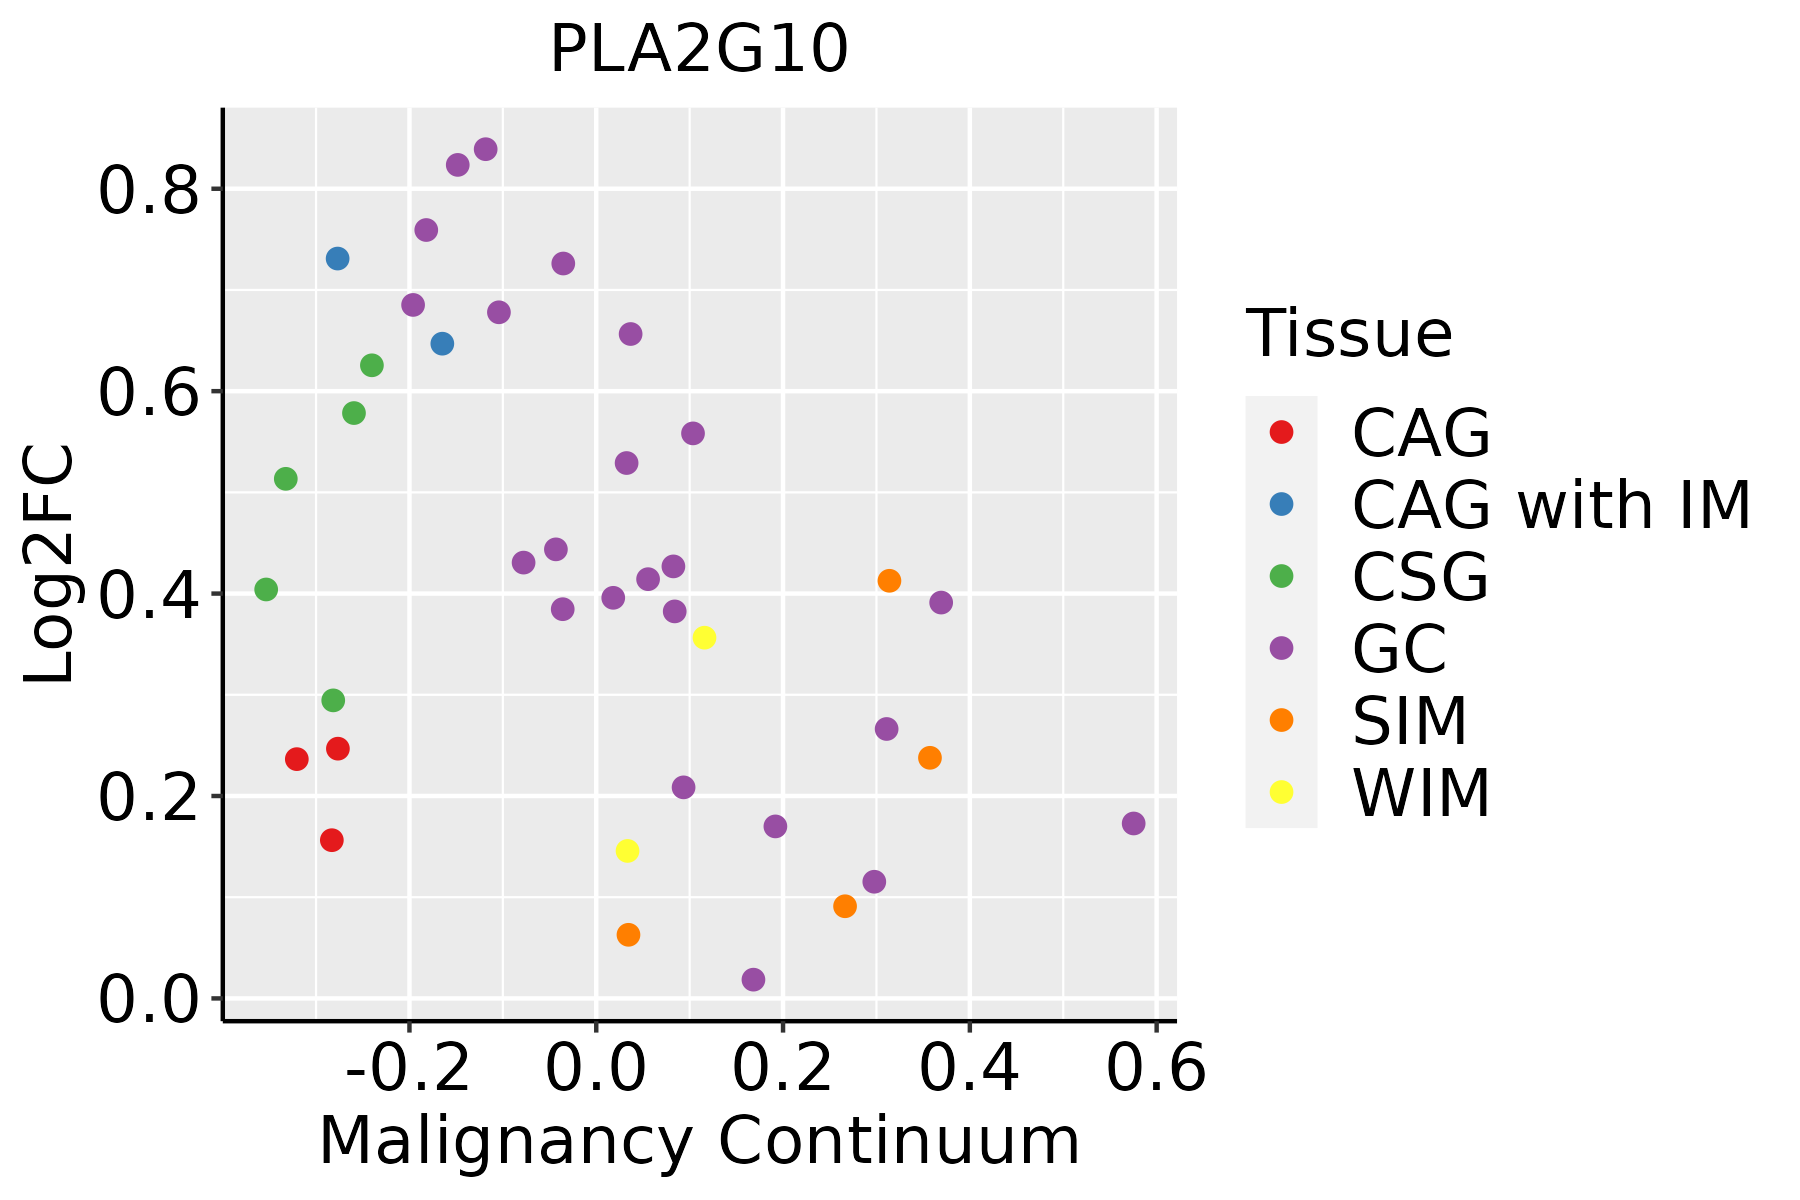 | CAG: Chronic atrophic gastritis |
| CAG with IM: Chronic atrophic gastritis with intestinal metaplasia | ||
| CSG: Chronic superficial gastritis | ||
| GC: Gastric cancer | ||
| SIM: Severe intestinal metaplasia | ||
| WIM: Wild intestinal metaplasia |
| ∗log2FC in expression of this searched gene in stem-like cells from each diseased tissue sample relative to stem-like cells in normal samples in each tissue plotted against the malignancy continuum. Samples are colored based on if they are from different disease stage. |
Top |
Malignant transformation related pathway analysis |
| Find out the enriched GO biological processes and KEGG pathways involved in transition from healthy to precancer to cancer |
| Tissue | Disease Stage | Enriched GO biological Processes |
| Cervix | N_HPV |  |
| Endometrium | AEH |  |
| Endometrium | EEC |  |
| Prostate | BPH |  |
| Prostate | Tumor |  |
| ∗Top 15 enriched GO BP terms are showed in the bar plot of each disease state in each tissue. Each row represents a significant GO biological process which is colored according to the -log10(p.adjust). |
| Page: 1 2 3 4 5 6 7 8 9 |
| GO ID | Tissue | Disease Stage | Description | Gene Ratio | Bg Ratio | pvalue | p.adjust | Count |
| GO:0007409 | Colorectum | AD | axonogenesis | 122/3918 | 418/18723 | 3.36e-05 | 6.15e-04 | 122 |
| GO:0016042 | Colorectum | AD | lipid catabolic process | 97/3918 | 320/18723 | 4.31e-05 | 7.56e-04 | 97 |
| GO:0006631 | Colorectum | AD | fatty acid metabolic process | 114/3918 | 390/18723 | 5.58e-05 | 9.44e-04 | 114 |
| GO:0061564 | Colorectum | AD | axon development | 132/3918 | 467/18723 | 8.40e-05 | 1.31e-03 | 132 |
| GO:0018904 | Colorectum | AD | ether metabolic process | 14/3918 | 27/18723 | 3.72e-04 | 4.29e-03 | 14 |
| GO:0044242 | Colorectum | AD | cellular lipid catabolic process | 66/3918 | 214/18723 | 3.96e-04 | 4.50e-03 | 66 |
| GO:0051047 | Colorectum | AD | positive regulation of secretion | 90/3918 | 310/18723 | 4.11e-04 | 4.66e-03 | 90 |
| GO:0006575 | Colorectum | AD | cellular modified amino acid metabolic process | 59/3918 | 188/18723 | 4.80e-04 | 5.27e-03 | 59 |
| GO:0006662 | Colorectum | AD | glycerol ether metabolic process | 12/3918 | 22/18723 | 5.38e-04 | 5.74e-03 | 12 |
| GO:1903532 | Colorectum | AD | positive regulation of secretion by cell | 82/3918 | 282/18723 | 6.85e-04 | 7.00e-03 | 82 |
| GO:0015732 | Colorectum | AD | prostaglandin transport | 10/3918 | 18/18723 | 1.31e-03 | 1.15e-02 | 10 |
| GO:0010876 | Colorectum | AD | lipid localization | 120/3918 | 448/18723 | 1.59e-03 | 1.33e-02 | 120 |
| GO:0006869 | Colorectum | AD | lipid transport | 108/3918 | 398/18723 | 1.67e-03 | 1.39e-02 | 108 |
| GO:2000191 | Colorectum | AD | regulation of fatty acid transport | 14/3918 | 32/18723 | 3.03e-03 | 2.25e-02 | 14 |
| GO:0046485 | Colorectum | AD | ether lipid metabolic process | 10/3918 | 20/18723 | 3.67e-03 | 2.60e-02 | 10 |
| GO:0006650 | Colorectum | AD | glycerophospholipid metabolic process | 83/3918 | 306/18723 | 5.40e-03 | 3.55e-02 | 83 |
| GO:0007411 | Colorectum | AD | axon guidance | 64/3918 | 227/18723 | 5.41e-03 | 3.55e-02 | 64 |
| GO:0032310 | Colorectum | AD | prostaglandin secretion | 8/3918 | 15/18723 | 5.67e-03 | 3.64e-02 | 8 |
| GO:0006644 | Colorectum | AD | phospholipid metabolic process | 101/3918 | 383/18723 | 5.80e-03 | 3.67e-02 | 101 |
| GO:0097485 | Colorectum | AD | neuron projection guidance | 64/3918 | 228/18723 | 6.02e-03 | 3.78e-02 | 64 |
| Page: 1 2 3 4 5 6 7 8 9 |
| Pathway ID | Tissue | Disease Stage | Description | Gene Ratio | Bg Ratio | pvalue | p.adjust | qvalue | Count |
| hsa04972 | Colorectum | AD | Pancreatic secretion | 36/2092 | 102/8465 | 1.06e-02 | 3.98e-02 | 2.54e-02 | 36 |
| hsa049721 | Colorectum | AD | Pancreatic secretion | 36/2092 | 102/8465 | 1.06e-02 | 3.98e-02 | 2.54e-02 | 36 |
| hsa049722 | Colorectum | SER | Pancreatic secretion | 30/1580 | 102/8465 | 5.41e-03 | 3.28e-02 | 2.38e-02 | 30 |
| hsa049723 | Colorectum | SER | Pancreatic secretion | 30/1580 | 102/8465 | 5.41e-03 | 3.28e-02 | 2.38e-02 | 30 |
| hsa049726 | Colorectum | FAP | Pancreatic secretion | 34/1404 | 102/8465 | 2.43e-05 | 2.78e-04 | 1.69e-04 | 34 |
| hsa04270 | Colorectum | FAP | Vascular smooth muscle contraction | 33/1404 | 134/8465 | 1.05e-02 | 3.74e-02 | 2.28e-02 | 33 |
| hsa049727 | Colorectum | FAP | Pancreatic secretion | 34/1404 | 102/8465 | 2.43e-05 | 2.78e-04 | 1.69e-04 | 34 |
| hsa042701 | Colorectum | FAP | Vascular smooth muscle contraction | 33/1404 | 134/8465 | 1.05e-02 | 3.74e-02 | 2.28e-02 | 33 |
| hsa049728 | Colorectum | CRC | Pancreatic secretion | 32/1091 | 102/8465 | 7.86e-07 | 4.37e-05 | 2.96e-05 | 32 |
| hsa04014 | Colorectum | CRC | Ras signaling pathway | 49/1091 | 236/8465 | 4.04e-04 | 4.50e-03 | 3.05e-03 | 49 |
| hsa042702 | Colorectum | CRC | Vascular smooth muscle contraction | 27/1091 | 134/8465 | 1.13e-02 | 4.90e-02 | 3.32e-02 | 27 |
| hsa049729 | Colorectum | CRC | Pancreatic secretion | 32/1091 | 102/8465 | 7.86e-07 | 4.37e-05 | 2.96e-05 | 32 |
| hsa040141 | Colorectum | CRC | Ras signaling pathway | 49/1091 | 236/8465 | 4.04e-04 | 4.50e-03 | 3.05e-03 | 49 |
| hsa042703 | Colorectum | CRC | Vascular smooth muscle contraction | 27/1091 | 134/8465 | 1.13e-02 | 4.90e-02 | 3.32e-02 | 27 |
| hsa04975 | Stomach | GC | Fat digestion and absorption | 14/708 | 43/8465 | 5.71e-06 | 8.30e-05 | 5.84e-05 | 14 |
| hsa049751 | Stomach | GC | Fat digestion and absorption | 14/708 | 43/8465 | 5.71e-06 | 8.30e-05 | 5.84e-05 | 14 |
| hsa049752 | Stomach | SIM | Fat digestion and absorption | 12/465 | 43/8465 | 2.11e-06 | 3.05e-05 | 2.45e-05 | 12 |
| hsa049753 | Stomach | SIM | Fat digestion and absorption | 12/465 | 43/8465 | 2.11e-06 | 3.05e-05 | 2.45e-05 | 12 |
| Page: 1 |
Top |
Cell-cell communication analysis |
| Identification of potential cell-cell interactions between two cell types and their ligand-receptor pairs for different disease states |
| Ligand | Receptor | LRpair | Pathway | Tissue | Disease Stage |
| Page: 1 |
Top |
Single-cell gene regulatory network inference analysis |
| Find out the significant the regulons (TFs) and the target genes of each regulon across cell types for different disease states |
| TF | Cell Type | Tissue | Disease Stage | Target Gene | RSS | Regulon Activity |
| ∗The dot plots of a searched regulon are shown for all cell subpopulations in each disease state of each tissue based on the regulon specific score inferred using pySCENIC and by calculating the average expression. |
| Page: 1 |
Top |
Somatic mutation of malignant transformation related genes |
| Annotation of somatic variants for genes involved in malignant transformation |
| Hugo Symbol | Variant Class | Variant Classification | dbSNP RS | HGVSc | HGVSp | HGVSp Short | SWISSPROT | BIOTYPE | SIFT | PolyPhen | Tumor Sample Barcode | Tissue | Histology | Sex | Age | Stage | Therapy Types | Drugs | Outcome |
| PLA2G10 | SNV | Missense_Mutation | rs200010548 | c.482N>T | p.Ser161Leu | p.S161L | O15496 | protein_coding | tolerated(0.28) | benign(0.068) | TCGA-C8-A8HQ-01 | Breast | breast invasive carcinoma | Female | <65 | I/II | Unknown | Unknown | SD |
| PLA2G10 | SNV | Missense_Mutation | rs139270637 | c.371N>C | p.Lys124Thr | p.K124T | O15496 | protein_coding | deleterious(0.05) | possibly_damaging(0.471) | TCGA-EO-A3AV-01 | Endometrium | uterine corpus endometrioid carcinoma | Female | <65 | III/IV | Chemotherapy | carboplatin | CR |
| PLA2G10 | SNV | Missense_Mutation | c.402G>T | p.Gln134His | p.Q134H | O15496 | protein_coding | deleterious(0.02) | possibly_damaging(0.833) | TCGA-BR-4256-01 | Stomach | stomach adenocarcinoma | Male | >=65 | I/II | Unknown | Unknown | SD | |
| PLA2G10 | SNV | Missense_Mutation | novel | c.461N>G | p.Gln154Arg | p.Q154R | O15496 | protein_coding | tolerated(0.39) | benign(0.005) | TCGA-VQ-A8P2-01 | Stomach | stomach adenocarcinoma | Male | >=65 | III/IV | Unspecific | Complete Response |
| Page: 1 |
Top |
Related drugs of malignant transformation related genes |
| Identification of chemicals and drugs interact with genes involved in malignant transfromation |
| (DGIdb 4.0) |
| Entrez ID | Symbol | Category | Interaction Types | Drug Claim Name | Drug Name | PMIDs |
| 8399 | PLA2G10 | PHOSPHOLIPASE, DRUGGABLE GENOME, ENZYME | inhibitor | 252827445 | ||
| 8399 | PLA2G10 | PHOSPHOLIPASE, DRUGGABLE GENOME, ENZYME | VARESPLADIB | VARESPLADIB | ||
| 8399 | PLA2G10 | PHOSPHOLIPASE, DRUGGABLE GENOME, ENZYME | inhibitor | CHEMBL2105659 | VARESPLADIB METHYL |
| Page: 1 |

Copyright 2023-Present -The University of Texas Health Science Center at Houston |