
|
|||||
|
 | |
| |
| |
| |
| |
| |
|
Gene: MKS1 |
Gene summary for MKS1 |
| Gene information | Species | Human | Gene symbol | MKS1 | Gene ID | 54903 |
| Gene name | MKS transition zone complex subunit 1 | |
| Gene Alias | BBS13 | |
| Cytomap | 17q22 | |
| Gene Type | protein-coding | GO ID | GO:0001501 | UniProtAcc | Q9NXB0 |
Top |
Malignant transformation analysis |
| Identification of the aberrant gene expression in precancerous and cancerous lesions by comparing the gene expression of stem-like cells in diseased tissues with normal stem cells |
| Entrez ID | Symbol | Replicates | Species | Organ | Tissue | Adj P-value | Log2FC | Malignancy |
| 54903 | MKS1 | LZE7T | Human | Esophagus | ESCC | 1.02e-03 | 1.81e-01 | 0.0667 |
| 54903 | MKS1 | LZE8T | Human | Esophagus | ESCC | 1.10e-02 | 1.30e-01 | 0.067 |
| 54903 | MKS1 | LZE24T | Human | Esophagus | ESCC | 6.28e-11 | 2.71e-01 | 0.0596 |
| 54903 | MKS1 | LZE6T | Human | Esophagus | ESCC | 2.96e-03 | 1.57e-01 | 0.0845 |
| 54903 | MKS1 | P1T-E | Human | Esophagus | ESCC | 1.64e-05 | 2.45e-01 | 0.0875 |
| 54903 | MKS1 | P2T-E | Human | Esophagus | ESCC | 3.58e-23 | 3.68e-01 | 0.1177 |
| 54903 | MKS1 | P4T-E | Human | Esophagus | ESCC | 3.48e-08 | 1.75e-01 | 0.1323 |
| 54903 | MKS1 | P8T-E | Human | Esophagus | ESCC | 2.03e-09 | 2.01e-01 | 0.0889 |
| 54903 | MKS1 | P10T-E | Human | Esophagus | ESCC | 1.73e-14 | 2.32e-01 | 0.116 |
| 54903 | MKS1 | P11T-E | Human | Esophagus | ESCC | 3.75e-08 | 2.66e-01 | 0.1426 |
| 54903 | MKS1 | P12T-E | Human | Esophagus | ESCC | 1.85e-18 | 2.94e-01 | 0.1122 |
| 54903 | MKS1 | P15T-E | Human | Esophagus | ESCC | 2.22e-12 | 2.54e-01 | 0.1149 |
| 54903 | MKS1 | P16T-E | Human | Esophagus | ESCC | 2.13e-27 | 4.60e-01 | 0.1153 |
| 54903 | MKS1 | P17T-E | Human | Esophagus | ESCC | 1.49e-02 | 1.26e-01 | 0.1278 |
| 54903 | MKS1 | P20T-E | Human | Esophagus | ESCC | 5.91e-09 | 2.30e-01 | 0.1124 |
| 54903 | MKS1 | P21T-E | Human | Esophagus | ESCC | 4.12e-11 | 2.23e-01 | 0.1617 |
| 54903 | MKS1 | P22T-E | Human | Esophagus | ESCC | 3.28e-14 | 2.73e-01 | 0.1236 |
| 54903 | MKS1 | P23T-E | Human | Esophagus | ESCC | 2.24e-15 | 3.29e-01 | 0.108 |
| 54903 | MKS1 | P24T-E | Human | Esophagus | ESCC | 2.03e-09 | 2.06e-01 | 0.1287 |
| 54903 | MKS1 | P26T-E | Human | Esophagus | ESCC | 3.60e-13 | 2.38e-01 | 0.1276 |
| Page: 1 2 3 |
| Tissue | Expression Dynamics | Abbreviation |
| Esophagus | 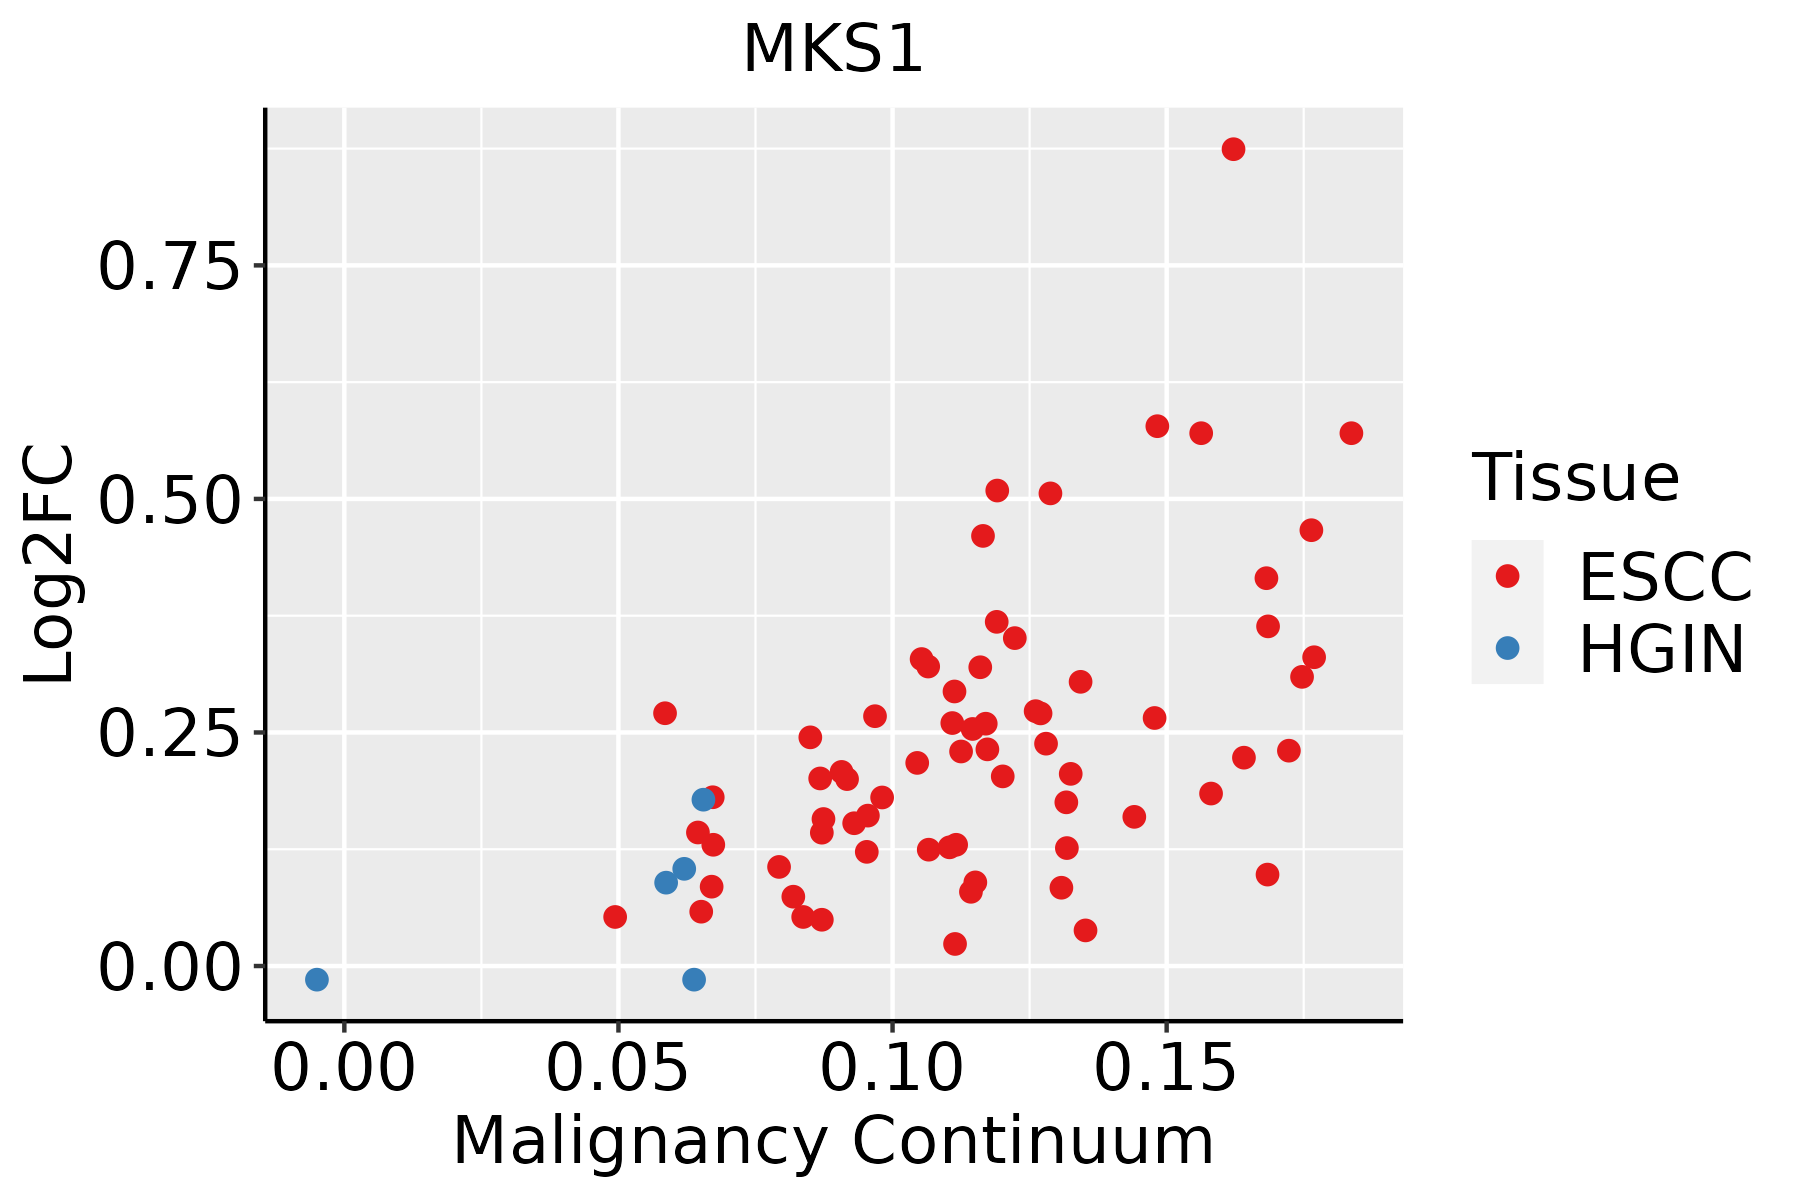 | ESCC: Esophageal squamous cell carcinoma |
| HGIN: High-grade intraepithelial neoplasias | ||
| LGIN: Low-grade intraepithelial neoplasias |
| ∗log2FC in expression of this searched gene in stem-like cells from each diseased tissue sample relative to stem-like cells in normal samples in each tissue plotted against the malignancy continuum. Samples are colored based on if they are from different disease stage. |
Top |
Malignant transformation related pathway analysis |
| Find out the enriched GO biological processes and KEGG pathways involved in transition from healthy to precancer to cancer |
| Tissue | Disease Stage | Enriched GO biological Processes |
| Cervix | N_HPV |  |
| Endometrium | AEH |  |
| Endometrium | EEC |  |
| Prostate | BPH |  |
| Prostate | Tumor |  |
| ∗Top 15 enriched GO BP terms are showed in the bar plot of each disease state in each tissue. Each row represents a significant GO biological process which is colored according to the -log10(p.adjust). |
| Page: 1 2 3 4 5 6 7 8 9 |
| GO ID | Tissue | Disease Stage | Description | Gene Ratio | Bg Ratio | pvalue | p.adjust | Count |
| GO:001605517 | Esophagus | ESCC | Wnt signaling pathway | 268/8552 | 444/18723 | 2.32e-10 | 6.58e-09 | 268 |
| GO:019873817 | Esophagus | ESCC | cell-cell signaling by wnt | 269/8552 | 446/18723 | 2.41e-10 | 6.79e-09 | 269 |
| GO:000184115 | Esophagus | ESCC | neural tube formation | 75/8552 | 102/18723 | 9.68e-09 | 1.95e-07 | 75 |
| GO:000184314 | Esophagus | ESCC | neural tube closure | 66/8552 | 88/18723 | 1.98e-08 | 3.82e-07 | 66 |
| GO:001402014 | Esophagus | ESCC | primary neural tube formation | 69/8552 | 94/18723 | 4.22e-08 | 7.76e-07 | 69 |
| GO:006060614 | Esophagus | ESCC | tube closure | 66/8552 | 89/18723 | 4.24e-08 | 7.76e-07 | 66 |
| GO:00219159 | Esophagus | ESCC | neural tube development | 101/8552 | 152/18723 | 1.78e-07 | 2.79e-06 | 101 |
| GO:00163316 | Esophagus | ESCC | morphogenesis of embryonic epithelium | 98/8552 | 147/18723 | 2.12e-07 | 3.27e-06 | 98 |
| GO:000183814 | Esophagus | ESCC | embryonic epithelial tube formation | 83/8552 | 121/18723 | 2.78e-07 | 4.08e-06 | 83 |
| GO:003011117 | Esophagus | ESCC | regulation of Wnt signaling pathway | 194/8552 | 328/18723 | 5.39e-07 | 7.14e-06 | 194 |
| GO:0061008110 | Esophagus | ESCC | hepaticobiliary system development | 98/8552 | 150/18723 | 8.91e-07 | 1.15e-05 | 98 |
| GO:006007016 | Esophagus | ESCC | canonical Wnt signaling pathway | 180/8552 | 303/18723 | 9.15e-07 | 1.17e-05 | 180 |
| GO:006082817 | Esophagus | ESCC | regulation of canonical Wnt signaling pathway | 153/8552 | 253/18723 | 1.38e-06 | 1.67e-05 | 153 |
| GO:003514815 | Esophagus | ESCC | tube formation | 96/8552 | 148/18723 | 1.86e-06 | 2.16e-05 | 96 |
| GO:00721759 | Esophagus | ESCC | epithelial tube formation | 86/8552 | 132/18723 | 4.81e-06 | 5.10e-05 | 86 |
| GO:006056210 | Esophagus | ESCC | epithelial tube morphogenesis | 187/8552 | 325/18723 | 9.95e-06 | 9.44e-05 | 187 |
| GO:00017387 | Esophagus | ESCC | morphogenesis of a polarized epithelium | 63/8552 | 94/18723 | 2.34e-05 | 2.00e-04 | 63 |
| GO:00600714 | Esophagus | ESCC | Wnt signaling pathway, planar cell polarity pathway | 36/8552 | 52/18723 | 5.05e-04 | 2.79e-03 | 36 |
| GO:00485687 | Esophagus | ESCC | embryonic organ development | 228/8552 | 427/18723 | 7.28e-04 | 3.79e-03 | 228 |
| GO:00901753 | Esophagus | ESCC | regulation of establishment of planar polarity | 37/8552 | 56/18723 | 1.65e-03 | 7.65e-03 | 37 |
| Page: 1 2 |
| Pathway ID | Tissue | Disease Stage | Description | Gene Ratio | Bg Ratio | pvalue | p.adjust | qvalue | Count |
| Page: 1 |
Top |
Cell-cell communication analysis |
| Identification of potential cell-cell interactions between two cell types and their ligand-receptor pairs for different disease states |
| Ligand | Receptor | LRpair | Pathway | Tissue | Disease Stage |
| Page: 1 |
Top |
Single-cell gene regulatory network inference analysis |
| Find out the significant the regulons (TFs) and the target genes of each regulon across cell types for different disease states |
| TF | Cell Type | Tissue | Disease Stage | Target Gene | RSS | Regulon Activity |
| ∗The dot plots of a searched regulon are shown for all cell subpopulations in each disease state of each tissue based on the regulon specific score inferred using pySCENIC and by calculating the average expression. |
| Page: 1 |
Top |
Somatic mutation of malignant transformation related genes |
| Annotation of somatic variants for genes involved in malignant transformation |
| Hugo Symbol | Variant Class | Variant Classification | dbSNP RS | HGVSc | HGVSp | HGVSp Short | SWISSPROT | BIOTYPE | SIFT | PolyPhen | Tumor Sample Barcode | Tissue | Histology | Sex | Age | Stage | Therapy Types | Drugs | Outcome |
| MKS1 | SNV | Missense_Mutation | c.997N>A | p.His333Asn | p.H333N | Q9NXB0 | protein_coding | tolerated(0.08) | benign(0.033) | TCGA-A2-A0CX-01 | Breast | breast invasive carcinoma | Female | <65 | I/II | Chemotherapy | adriamycin | SD | |
| MKS1 | SNV | Missense_Mutation | c.576N>C | p.Arg192Ser | p.R192S | Q9NXB0 | protein_coding | deleterious(0.01) | benign(0.093) | TCGA-AC-A23H-01 | Breast | breast invasive carcinoma | Female | >=65 | I/II | Unknown | Unknown | PD | |
| MKS1 | SNV | Missense_Mutation | novel | c.1525A>T | p.Met509Leu | p.M509L | Q9NXB0 | protein_coding | tolerated(1) | benign(0.003) | TCGA-AN-A0FX-01 | Breast | breast invasive carcinoma | Female | <65 | I/II | Unknown | Unknown | SD |
| MKS1 | SNV | Missense_Mutation | rs750926734 | c.1093A>G | p.Met365Val | p.M365V | Q9NXB0 | protein_coding | tolerated(0.21) | benign(0.003) | TCGA-B6-A0RG-01 | Breast | breast invasive carcinoma | Female | <65 | I/II | Unknown | Unknown | SD |
| MKS1 | SNV | Missense_Mutation | rs766392300 | c.1387N>T | p.Arg463Trp | p.R463W | Q9NXB0 | protein_coding | deleterious(0.02) | benign(0.003) | TCGA-BH-A18G-01 | Breast | breast invasive carcinoma | Female | >=65 | I/II | Unknown | Unknown | SD |
| MKS1 | SNV | Missense_Mutation | novel | c.1501N>A | p.Glu501Lys | p.E501K | Q9NXB0 | protein_coding | deleterious(0.03) | benign(0.021) | TCGA-EW-A2FS-01 | Breast | breast invasive carcinoma | Female | <65 | I/II | Hormone Therapy | goserelin | SD |
| MKS1 | SNV | Missense_Mutation | novel | c.7N>A | p.Glu3Lys | p.E3K | Q9NXB0 | protein_coding | deleterious(0.03) | benign(0.045) | TCGA-LL-A6FP-01 | Breast | breast invasive carcinoma | Female | >=65 | I/II | Hormone Therapy | arimidex | SD |
| MKS1 | insertion | In_Frame_Ins | novel | c.101_102insCGTGGCTGGGAGTGCCCC | p.Thr34_Ser35insValAlaGlySerAlaPro | p.T34_S35insVAGSAP | Q9NXB0 | protein_coding | TCGA-A7-A26H-01 | Breast | breast invasive carcinoma | Female | >=65 | I/II | Hormone Therapy | anastrozole | PD | ||
| MKS1 | insertion | Frame_Shift_Ins | novel | c.1523_1524insTGCTCTCCTGCCTCTTC | p.Arg508SerfsTer28 | p.R508Sfs*28 | Q9NXB0 | protein_coding | TCGA-AN-A0FX-01 | Breast | breast invasive carcinoma | Female | <65 | I/II | Unknown | Unknown | SD | ||
| MKS1 | insertion | In_Frame_Ins | novel | c.931_932insCCCGTGTCAGAACAGAGG | p.Leu311delinsProArgValArgThrGluVal | p.L311delinsPRVRTEV | Q9NXB0 | protein_coding | TCGA-C8-A275-01 | Breast | breast invasive carcinoma | Female | <65 | I/II | Unknown | Unknown | SD |
| Page: 1 2 3 4 5 6 7 |
Top |
Related drugs of malignant transformation related genes |
| Identification of chemicals and drugs interact with genes involved in malignant transfromation |
| (DGIdb 4.0) |
| Entrez ID | Symbol | Category | Interaction Types | Drug Claim Name | Drug Name | PMIDs |
| Page: 1 |

Copyright 2023-Present -The University of Texas Health Science Center at Houston |