
|
|||||
|
 | |
| |
| |
| |
| |
| |
|
Gene: MIOS |
Gene summary for MIOS |
| Gene information | Species | Human | Gene symbol | MIOS | Gene ID | 54468 |
| Gene name | meiosis regulator for oocyte development | |
| Gene Alias | MIO | |
| Cytomap | 7p21.3 | |
| Gene Type | protein-coding | GO ID | GO:0006950 | UniProtAcc | A0A024RA24 |
Top |
Malignant transformation analysis |
| Identification of the aberrant gene expression in precancerous and cancerous lesions by comparing the gene expression of stem-like cells in diseased tissues with normal stem cells |
| Entrez ID | Symbol | Replicates | Species | Organ | Tissue | Adj P-value | Log2FC | Malignancy |
| 54468 | MIOS | LZE4T | Human | Esophagus | ESCC | 3.52e-06 | 1.75e-01 | 0.0811 |
| 54468 | MIOS | LZE24T | Human | Esophagus | ESCC | 1.92e-09 | 2.09e-01 | 0.0596 |
| 54468 | MIOS | LZE21T | Human | Esophagus | ESCC | 2.13e-02 | 1.30e-01 | 0.0655 |
| 54468 | MIOS | P2T-E | Human | Esophagus | ESCC | 8.88e-23 | 3.08e-01 | 0.1177 |
| 54468 | MIOS | P4T-E | Human | Esophagus | ESCC | 2.93e-11 | 1.97e-01 | 0.1323 |
| 54468 | MIOS | P5T-E | Human | Esophagus | ESCC | 8.31e-04 | 1.21e-01 | 0.1327 |
| 54468 | MIOS | P8T-E | Human | Esophagus | ESCC | 2.50e-09 | 1.48e-01 | 0.0889 |
| 54468 | MIOS | P9T-E | Human | Esophagus | ESCC | 1.39e-05 | 7.29e-02 | 0.1131 |
| 54468 | MIOS | P10T-E | Human | Esophagus | ESCC | 4.93e-07 | 1.66e-01 | 0.116 |
| 54468 | MIOS | P11T-E | Human | Esophagus | ESCC | 2.91e-13 | 3.90e-01 | 0.1426 |
| 54468 | MIOS | P12T-E | Human | Esophagus | ESCC | 1.56e-22 | 2.44e-01 | 0.1122 |
| 54468 | MIOS | P15T-E | Human | Esophagus | ESCC | 7.57e-11 | 1.98e-01 | 0.1149 |
| 54468 | MIOS | P16T-E | Human | Esophagus | ESCC | 3.06e-18 | 1.79e-01 | 0.1153 |
| 54468 | MIOS | P17T-E | Human | Esophagus | ESCC | 4.35e-02 | 1.14e-01 | 0.1278 |
| 54468 | MIOS | P20T-E | Human | Esophagus | ESCC | 1.50e-05 | 1.50e-01 | 0.1124 |
| 54468 | MIOS | P21T-E | Human | Esophagus | ESCC | 6.64e-13 | 1.45e-01 | 0.1617 |
| 54468 | MIOS | P22T-E | Human | Esophagus | ESCC | 7.00e-18 | 1.46e-01 | 0.1236 |
| 54468 | MIOS | P23T-E | Human | Esophagus | ESCC | 4.81e-16 | 1.45e-01 | 0.108 |
| 54468 | MIOS | P24T-E | Human | Esophagus | ESCC | 3.14e-08 | 9.95e-02 | 0.1287 |
| 54468 | MIOS | P26T-E | Human | Esophagus | ESCC | 5.68e-12 | 2.73e-01 | 0.1276 |
| Page: 1 2 3 4 |
| Tissue | Expression Dynamics | Abbreviation |
| Esophagus | 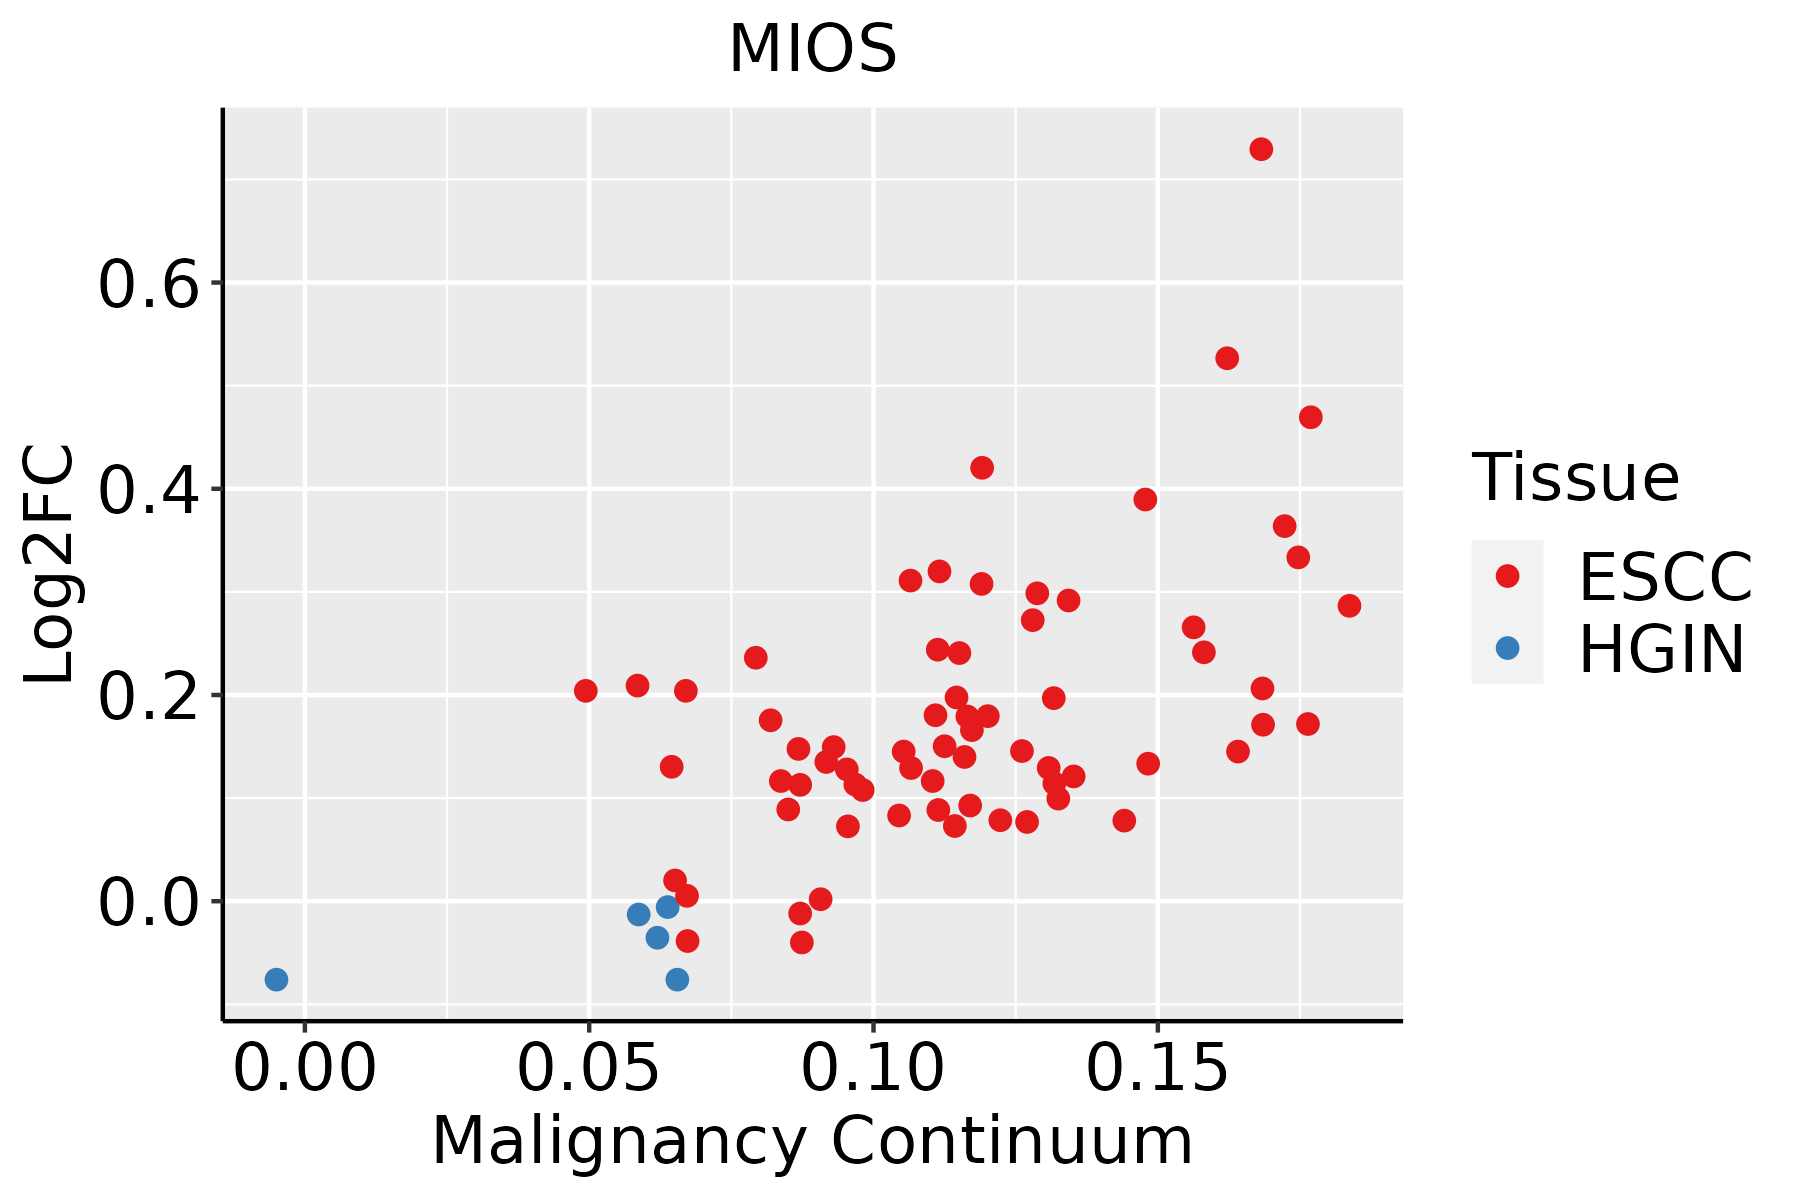 | ESCC: Esophageal squamous cell carcinoma |
| HGIN: High-grade intraepithelial neoplasias | ||
| LGIN: Low-grade intraepithelial neoplasias | ||
| Liver | 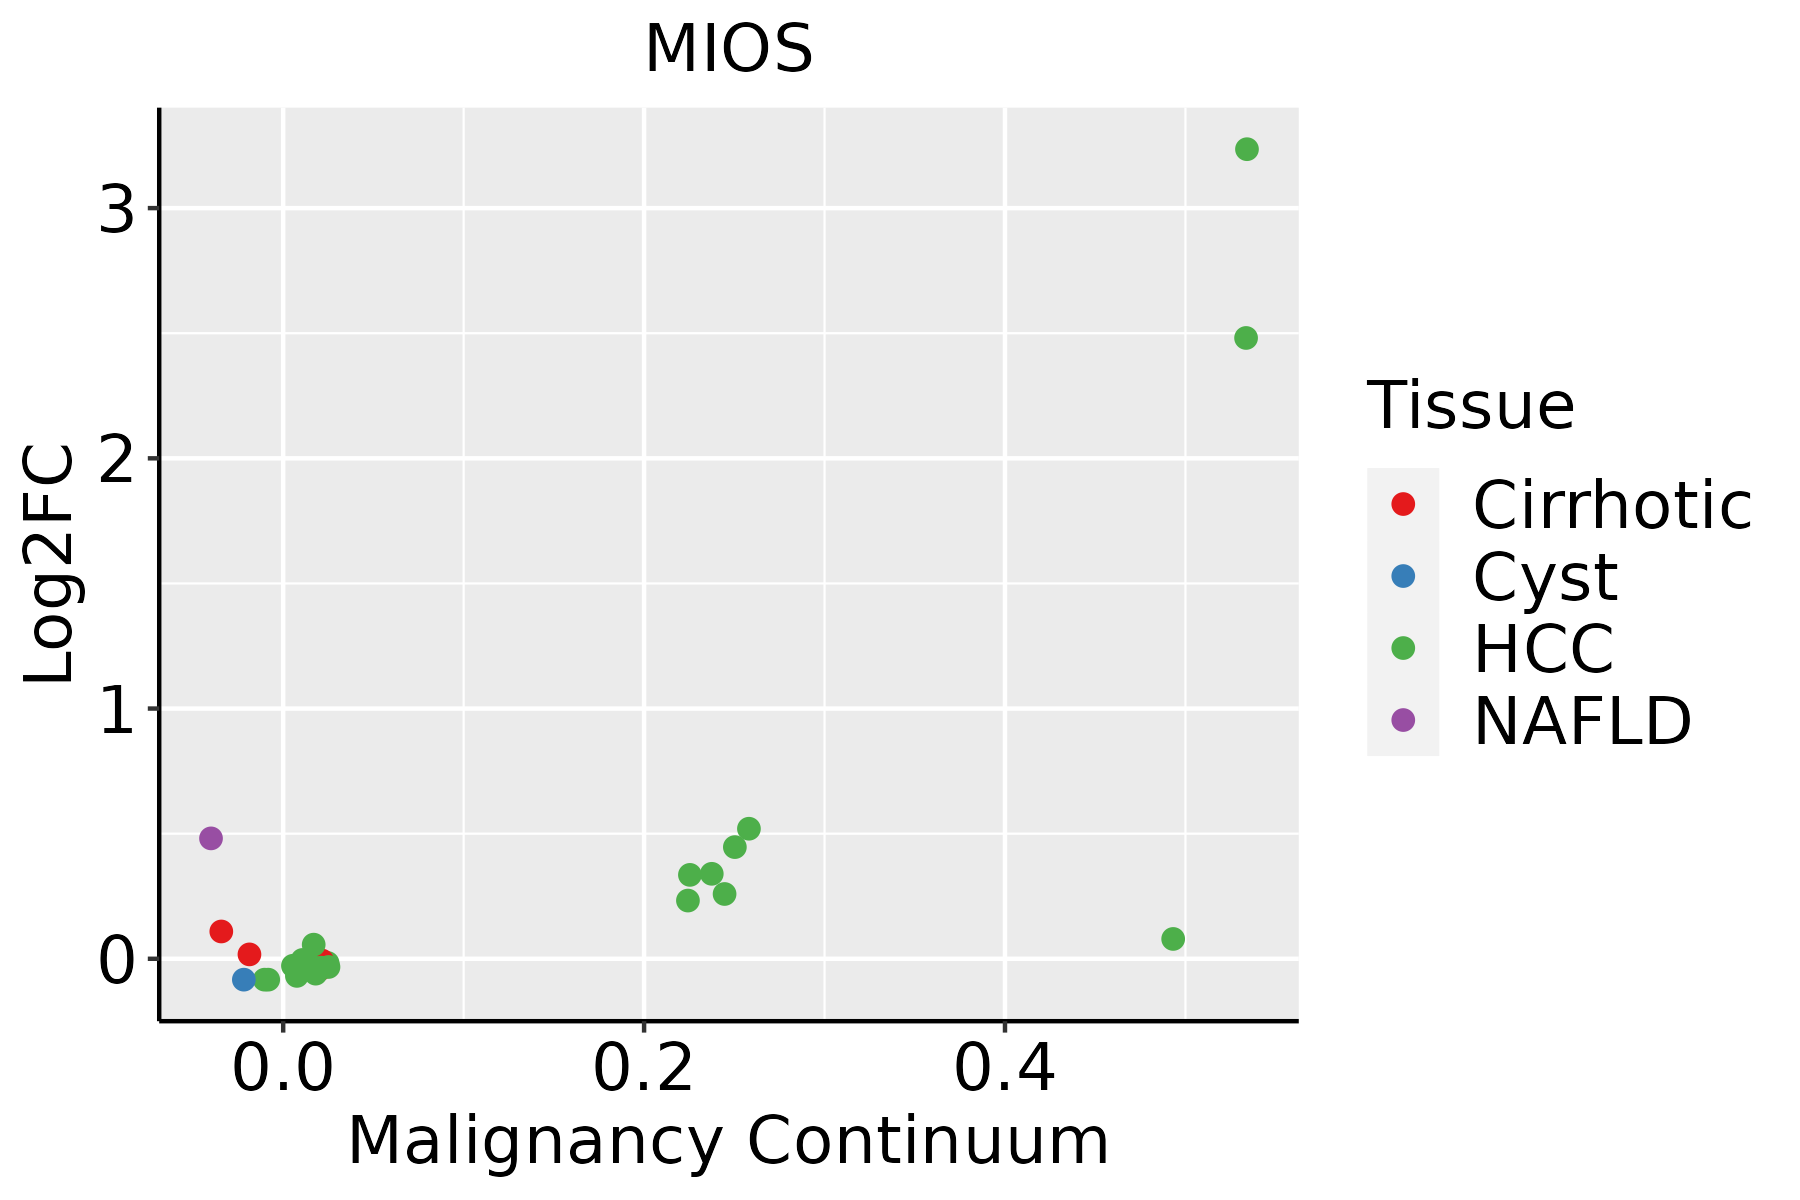 | HCC: Hepatocellular carcinoma |
| NAFLD: Non-alcoholic fatty liver disease |
| ∗log2FC in expression of this searched gene in stem-like cells from each diseased tissue sample relative to stem-like cells in normal samples in each tissue plotted against the malignancy continuum. Samples are colored based on if they are from different disease stage. |
Top |
Malignant transformation related pathway analysis |
| Find out the enriched GO biological processes and KEGG pathways involved in transition from healthy to precancer to cancer |
| Tissue | Disease Stage | Enriched GO biological Processes |
| Cervix | N_HPV |  |
| Endometrium | AEH |  |
| Endometrium | EEC |  |
| Prostate | BPH |  |
| Prostate | Tumor |  |
| ∗Top 15 enriched GO BP terms are showed in the bar plot of each disease state in each tissue. Each row represents a significant GO biological process which is colored according to the -log10(p.adjust). |
| Page: 1 2 3 4 5 6 7 8 9 |
| GO ID | Tissue | Disease Stage | Description | Gene Ratio | Bg Ratio | pvalue | p.adjust | Count |
| GO:0071496111 | Esophagus | ESCC | cellular response to external stimulus | 215/8552 | 320/18723 | 4.29e-15 | 2.43e-13 | 215 |
| GO:0031668111 | Esophagus | ESCC | cellular response to extracellular stimulus | 168/8552 | 246/18723 | 4.93e-13 | 2.23e-11 | 168 |
| GO:0031669110 | Esophagus | ESCC | cellular response to nutrient levels | 148/8552 | 215/18723 | 4.58e-12 | 1.76e-10 | 148 |
| GO:0031667111 | Esophagus | ESCC | response to nutrient levels | 289/8552 | 474/18723 | 9.25e-12 | 3.47e-10 | 289 |
| GO:0009267110 | Esophagus | ESCC | cellular response to starvation | 110/8552 | 156/18723 | 2.63e-10 | 7.37e-09 | 110 |
| GO:004259419 | Esophagus | ESCC | response to starvation | 133/8552 | 197/18723 | 4.31e-10 | 1.14e-08 | 133 |
| GO:003150314 | Esophagus | ESCC | protein-containing complex localization | 139/8552 | 220/18723 | 1.14e-07 | 1.85e-06 | 139 |
| GO:19909284 | Esophagus | ESCC | response to amino acid starvation | 37/8552 | 49/18723 | 2.05e-05 | 1.78e-04 | 37 |
| GO:00319294 | Esophagus | ESCC | TOR signaling | 79/8552 | 126/18723 | 8.57e-05 | 6.21e-04 | 79 |
| GO:00341984 | Esophagus | ESCC | cellular response to amino acid starvation | 34/8552 | 46/18723 | 9.39e-05 | 6.70e-04 | 34 |
| GO:00320061 | Esophagus | ESCC | regulation of TOR signaling | 63/8552 | 104/18723 | 1.55e-03 | 7.29e-03 | 63 |
| GO:00320082 | Esophagus | ESCC | positive regulation of TOR signaling | 31/8552 | 47/18723 | 4.01e-03 | 1.62e-02 | 31 |
| GO:00316677 | Liver | NAFLD | response to nutrient levels | 85/1882 | 474/18723 | 8.23e-08 | 7.09e-06 | 85 |
| GO:00714967 | Liver | NAFLD | cellular response to external stimulus | 51/1882 | 320/18723 | 6.21e-04 | 8.18e-03 | 51 |
| GO:00425945 | Liver | NAFLD | response to starvation | 33/1882 | 197/18723 | 2.35e-03 | 2.21e-02 | 33 |
| GO:003166722 | Liver | HCC | response to nutrient levels | 276/7958 | 474/18723 | 2.30e-12 | 1.08e-10 | 276 |
| GO:007149622 | Liver | HCC | cellular response to external stimulus | 191/7958 | 320/18723 | 3.40e-10 | 1.13e-08 | 191 |
| GO:003166812 | Liver | HCC | cellular response to extracellular stimulus | 149/7958 | 246/18723 | 7.35e-09 | 1.86e-07 | 149 |
| GO:004259421 | Liver | HCC | response to starvation | 121/7958 | 197/18723 | 6.08e-08 | 1.28e-06 | 121 |
| GO:003166912 | Liver | HCC | cellular response to nutrient levels | 130/7958 | 215/18723 | 7.52e-08 | 1.51e-06 | 130 |
| Page: 1 2 |
| Pathway ID | Tissue | Disease Stage | Description | Gene Ratio | Bg Ratio | pvalue | p.adjust | qvalue | Count |
| hsa041505 | Esophagus | ESCC | mTOR signaling pathway | 98/4205 | 156/8465 | 5.81e-04 | 1.95e-03 | 9.97e-04 | 98 |
| hsa0415013 | Esophagus | ESCC | mTOR signaling pathway | 98/4205 | 156/8465 | 5.81e-04 | 1.95e-03 | 9.97e-04 | 98 |
| hsa041502 | Liver | HCC | mTOR signaling pathway | 95/4020 | 156/8465 | 4.70e-04 | 1.99e-03 | 1.11e-03 | 95 |
| hsa0415011 | Liver | HCC | mTOR signaling pathway | 95/4020 | 156/8465 | 4.70e-04 | 1.99e-03 | 1.11e-03 | 95 |
| Page: 1 |
Top |
Cell-cell communication analysis |
| Identification of potential cell-cell interactions between two cell types and their ligand-receptor pairs for different disease states |
| Ligand | Receptor | LRpair | Pathway | Tissue | Disease Stage |
| Page: 1 |
Top |
Single-cell gene regulatory network inference analysis |
| Find out the significant the regulons (TFs) and the target genes of each regulon across cell types for different disease states |
| TF | Cell Type | Tissue | Disease Stage | Target Gene | RSS | Regulon Activity |
| MIOS | CD8TEREX | Breast | ADJ | FADS3,STAT6,CEP295, etc. | 1.98e-02 |  |
| MIOS | MAST | Breast | ADJ | FADS3,STAT6,CEP295, etc. | 3.03e-02 | |
| MIOS | pDC | Breast | IDC | FADS3,STAT6,CEP295, etc. | 1.52e-02 |  |
| MIOS | DC | Breast | Precancer | FADS3,STAT6,CEP295, etc. | 3.82e-02 |  |
| MIOS | MON | Breast | Precancer | FADS3,STAT6,CEP295, etc. | 2.86e-02 | |
| MIOS | GC | Breast | Precancer | FADS3,STAT6,CEP295, etc. | 4.84e-02 | |
| MIOS | MYOFIB | Colorectum | AD | TMCO1,DUOX2,NIPA1, etc. | 1.49e-01 |  |
| MIOS | CFIB | Colorectum | AD | TMCO1,DUOX2,NIPA1, etc. | 2.01e-01 | |
| MIOS | MVA | Colorectum | ADJ | TMCO1,DUOX2,NIPA1, etc. | -2.22e-16 |  |
| MIOS | GLIA | Colorectum | CRC | TMCO1,DUOX2,NIPA1, etc. | 6.06e-02 |  |
| ∗The dot plots of a searched regulon are shown for all cell subpopulations in each disease state of each tissue based on the regulon specific score inferred using pySCENIC and by calculating the average expression. |
| Page: 1 2 3 |
Top |
Somatic mutation of malignant transformation related genes |
| Annotation of somatic variants for genes involved in malignant transformation |
| Hugo Symbol | Variant Class | Variant Classification | dbSNP RS | HGVSc | HGVSp | HGVSp Short | SWISSPROT | BIOTYPE | SIFT | PolyPhen | Tumor Sample Barcode | Tissue | Histology | Sex | Age | Stage | Therapy Types | Drugs | Outcome |
| MIOS | SNV | Missense_Mutation | c.617N>A | p.Arg206His | p.R206H | Q9NXC5 | protein_coding | deleterious(0.01) | benign(0.132) | TCGA-AO-A128-01 | Breast | breast invasive carcinoma | Female | <65 | I/II | Chemotherapy | doxorubicin | SD | |
| MIOS | SNV | Missense_Mutation | c.566N>G | p.Ser189Cys | p.S189C | Q9NXC5 | protein_coding | deleterious(0) | probably_damaging(0.998) | TCGA-D8-A1JA-01 | Breast | breast invasive carcinoma | Female | <65 | III/IV | Chemotherapy | adriamycin | PD | |
| MIOS | insertion | Nonsense_Mutation | novel | c.571_572insCAATAAATATTTTCTTGAATTCATAGCAGATAGAGAGAA | p.Cys191delinsSerIleAsnIlePheLeuAsnSerTerGlnIleGluArgSer | p.C191delinsSINIFLNS*QIERS | Q9NXC5 | protein_coding | TCGA-A8-A07J-01 | Breast | breast invasive carcinoma | Female | <65 | I/II | Chemotherapy | 5-fluorouracil | CR | ||
| MIOS | SNV | Missense_Mutation | novel | c.2452G>A | p.Ala818Thr | p.A818T | Q9NXC5 | protein_coding | tolerated(1) | benign(0.031) | TCGA-2W-A8YY-01 | Cervix | cervical & endocervical cancer | Female | <65 | I/II | Chemotherapy | cisplatin | CR |
| MIOS | SNV | Missense_Mutation | c.1596N>C | p.Leu532Phe | p.L532F | Q9NXC5 | protein_coding | deleterious(0.01) | benign(0.059) | TCGA-EK-A3GJ-01 | Cervix | cervical & endocervical cancer | Female | <65 | I/II | Unknown | Unknown | SD | |
| MIOS | SNV | Missense_Mutation | c.2056N>A | p.Asp686Asn | p.D686N | Q9NXC5 | protein_coding | tolerated(0.19) | benign(0.019) | TCGA-FU-A3TQ-01 | Cervix | cervical & endocervical cancer | Female | <65 | III/IV | Unknown | Unknown | SD | |
| MIOS | SNV | Missense_Mutation | rs529813614 | c.1614N>G | p.Ile538Met | p.I538M | Q9NXC5 | protein_coding | deleterious(0) | possibly_damaging(0.465) | TCGA-VS-A953-01 | Cervix | cervical & endocervical cancer | Female | <65 | I/II | Unknown | Unknown | PD |
| MIOS | SNV | Missense_Mutation | c.2336N>A | p.Arg779Gln | p.R779Q | Q9NXC5 | protein_coding | deleterious(0) | possibly_damaging(0.892) | TCGA-AA-3510-01 | Colorectum | colon adenocarcinoma | Male | >=65 | I/II | Unknown | Unknown | SD | |
| MIOS | SNV | Missense_Mutation | c.2217N>A | p.Phe739Leu | p.F739L | Q9NXC5 | protein_coding | deleterious(0.01) | probably_damaging(0.948) | TCGA-AA-A010-01 | Colorectum | colon adenocarcinoma | Female | <65 | I/II | Chemotherapy | folinic | CR | |
| MIOS | SNV | Missense_Mutation | c.2132A>G | p.His711Arg | p.H711R | Q9NXC5 | protein_coding | tolerated(0.1) | benign(0.113) | TCGA-AA-A01R-01 | Colorectum | colon adenocarcinoma | Male | <65 | III/IV | Chemotherapy | 5-fluorouracil | PD |
| Page: 1 2 3 4 5 6 7 8 9 10 |
Top |
Related drugs of malignant transformation related genes |
| Identification of chemicals and drugs interact with genes involved in malignant transfromation |
| (DGIdb 4.0) |
| Entrez ID | Symbol | Category | Interaction Types | Drug Claim Name | Drug Name | PMIDs |
| Page: 1 |

Copyright 2023-Present -The University of Texas Health Science Center at Houston |