
|
|||||
|
 | |
| |
| |
| |
| |
| |
|
Gene: MCUB |
Gene summary for MCUB |
| Gene information | Species | Human | Gene symbol | MCUB | Gene ID | 55013 |
| Gene name | mitochondrial calcium uniporter dominant negative subunit beta | |
| Gene Alias | CCDC109B | |
| Cytomap | 4q25 | |
| Gene Type | protein-coding | GO ID | GO:0006810 | UniProtAcc | Q9NWR8 |
Top |
Malignant transformation analysis |
| Identification of the aberrant gene expression in precancerous and cancerous lesions by comparing the gene expression of stem-like cells in diseased tissues with normal stem cells |
| Entrez ID | Symbol | Replicates | Species | Organ | Tissue | Adj P-value | Log2FC | Malignancy |
| 55013 | MCUB | S027 | Human | Liver | HCC | 2.39e-12 | 6.75e-01 | 0.2446 |
| 55013 | MCUB | S028 | Human | Liver | HCC | 6.14e-17 | 4.73e-01 | 0.2503 |
| 55013 | MCUB | S029 | Human | Liver | HCC | 1.35e-19 | 7.32e-01 | 0.2581 |
| 55013 | MCUB | male-WTA | Human | Thyroid | PTC | 2.81e-06 | 8.99e-02 | 0.1037 |
| 55013 | MCUB | PTC01 | Human | Thyroid | PTC | 3.12e-03 | 1.15e-01 | 0.1899 |
| 55013 | MCUB | PTC04 | Human | Thyroid | PTC | 6.96e-04 | 1.48e-01 | 0.1927 |
| 55013 | MCUB | PTC05 | Human | Thyroid | PTC | 6.20e-13 | 4.11e-01 | 0.2065 |
| 55013 | MCUB | PTC06 | Human | Thyroid | PTC | 2.77e-11 | 3.14e-01 | 0.2057 |
| 55013 | MCUB | PTC07 | Human | Thyroid | PTC | 3.62e-15 | 3.36e-01 | 0.2044 |
| 55013 | MCUB | ATC09 | Human | Thyroid | ATC | 1.52e-02 | 1.73e-01 | 0.2871 |
| 55013 | MCUB | ATC13 | Human | Thyroid | ATC | 1.54e-16 | 2.57e-01 | 0.34 |
| 55013 | MCUB | ATC1 | Human | Thyroid | ATC | 2.10e-02 | 1.88e-01 | 0.2878 |
| 55013 | MCUB | ATC2 | Human | Thyroid | ATC | 5.50e-09 | 9.61e-01 | 0.34 |
| 55013 | MCUB | ATC5 | Human | Thyroid | ATC | 2.91e-12 | 2.93e-01 | 0.34 |
| Page: 1 |
| Tissue | Expression Dynamics | Abbreviation |
| Liver | 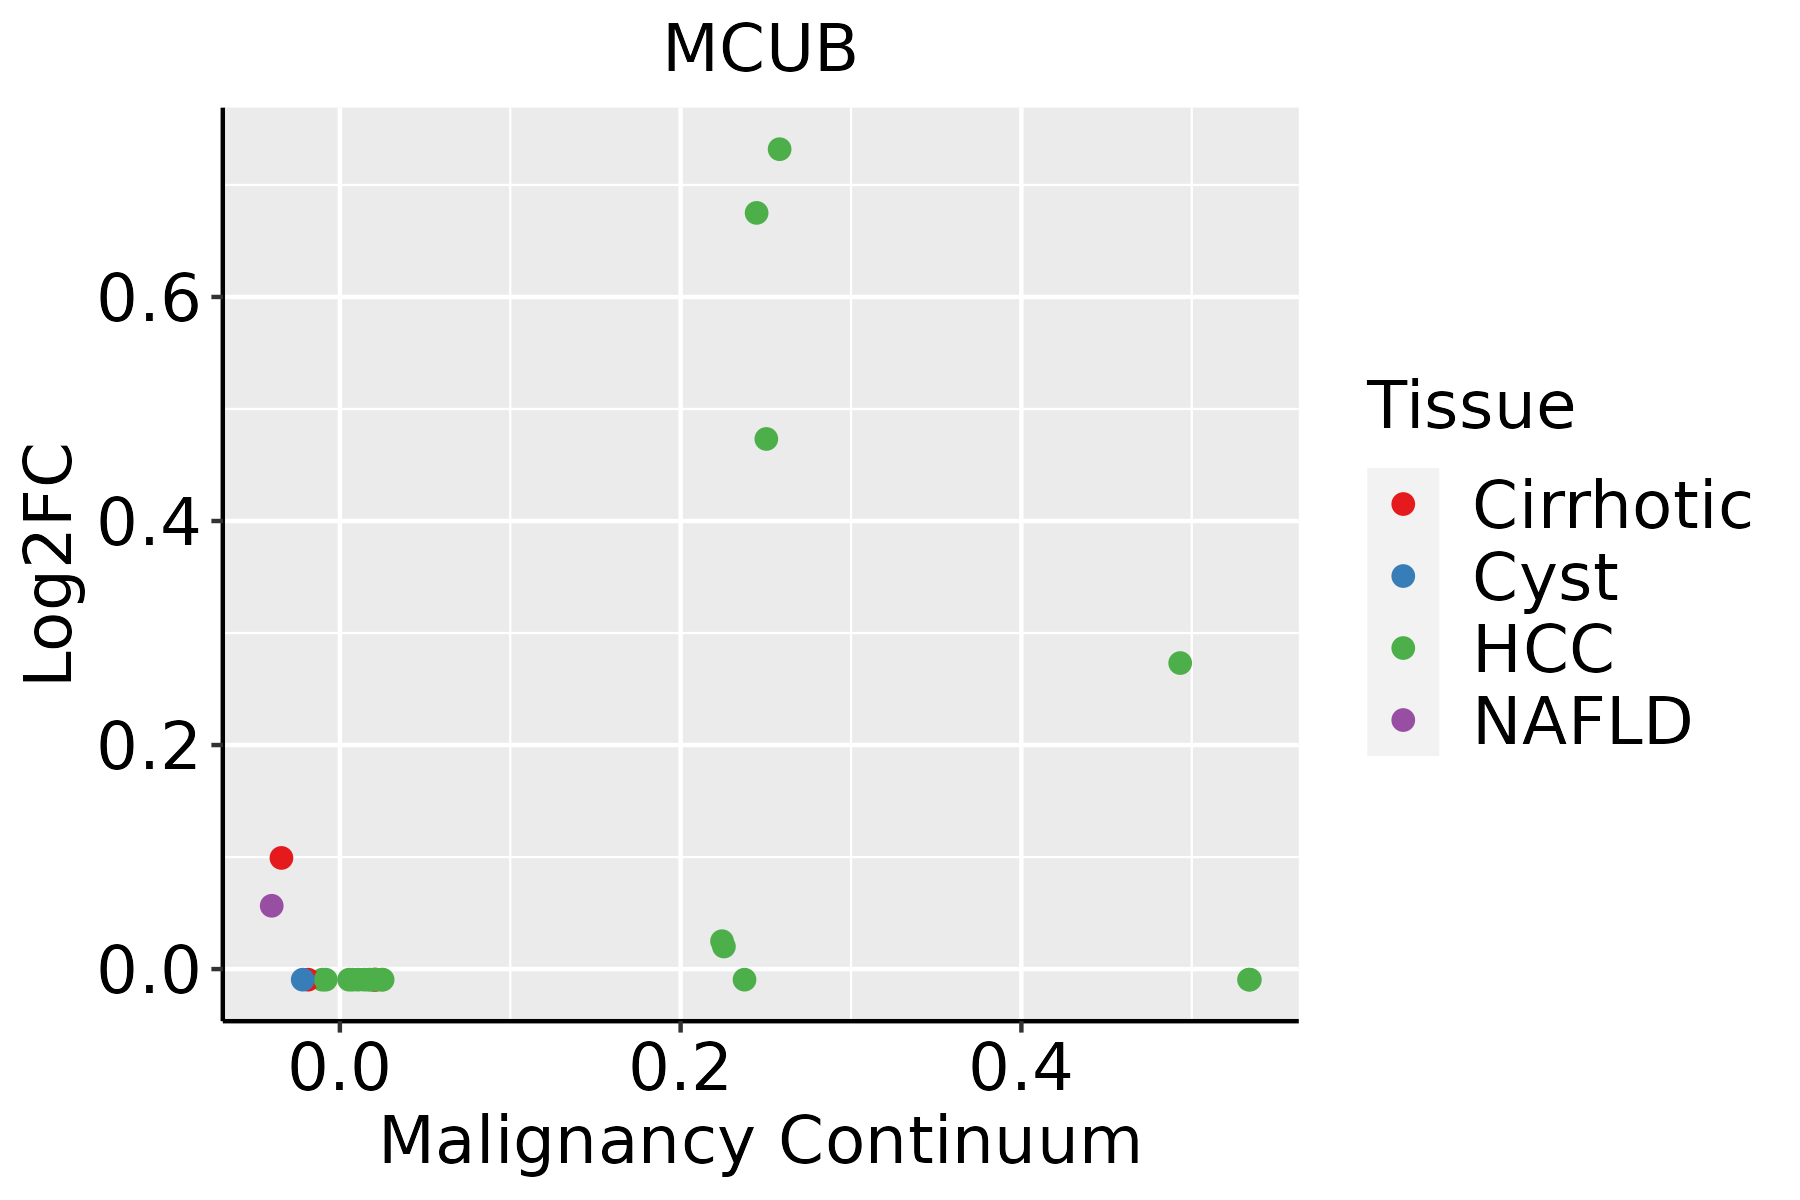 | HCC: Hepatocellular carcinoma |
| NAFLD: Non-alcoholic fatty liver disease | ||
| Thyroid | 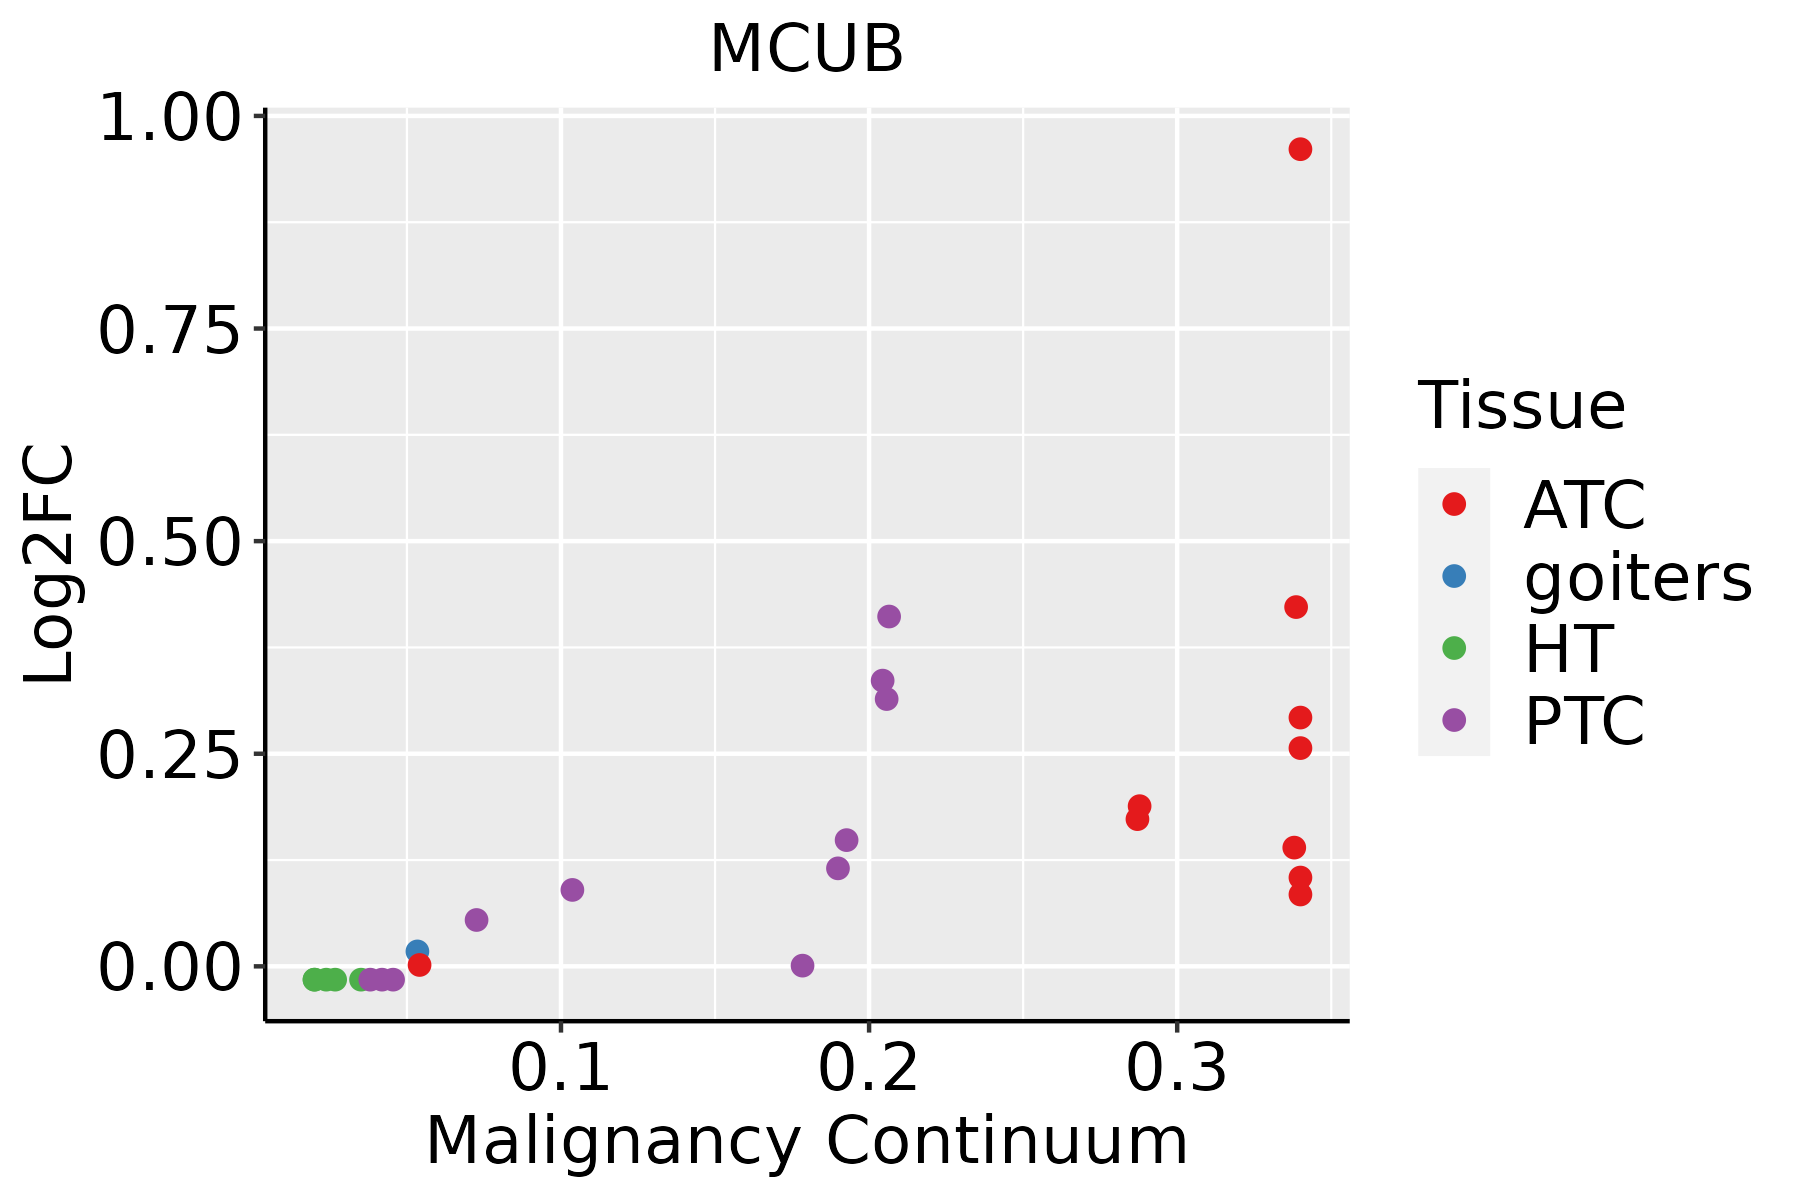 | ATC: Anaplastic thyroid cancer |
| HT: Hashimoto's thyroiditis | ||
| PTC: Papillary thyroid cancer |
| ∗log2FC in expression of this searched gene in stem-like cells from each diseased tissue sample relative to stem-like cells in normal samples in each tissue plotted against the malignancy continuum. Samples are colored based on if they are from different disease stage. |
Top |
Malignant transformation related pathway analysis |
| Find out the enriched GO biological processes and KEGG pathways involved in transition from healthy to precancer to cancer |
| Tissue | Disease Stage | Enriched GO biological Processes |
| Cervix | N_HPV |  |
| Endometrium | AEH |  |
| Endometrium | EEC |  |
| Prostate | BPH |  |
| Prostate | Tumor |  |
| ∗Top 15 enriched GO BP terms are showed in the bar plot of each disease state in each tissue. Each row represents a significant GO biological process which is colored according to the -log10(p.adjust). |
| Page: 1 2 3 4 5 6 7 8 9 |
| GO ID | Tissue | Disease Stage | Description | Gene Ratio | Bg Ratio | pvalue | p.adjust | Count |
| GO:000683912 | Liver | HCC | mitochondrial transport | 184/7958 | 254/18723 | 2.30e-22 | 3.83e-20 | 184 |
| GO:199054212 | Liver | HCC | mitochondrial transmembrane transport | 78/7958 | 102/18723 | 2.73e-12 | 1.26e-10 | 78 |
| GO:003644411 | Liver | HCC | calcium import into the mitochondrion | 13/7958 | 14/18723 | 1.25e-04 | 1.03e-03 | 13 |
| GO:005156021 | Liver | HCC | mitochondrial calcium ion homeostasis | 20/7958 | 26/18723 | 3.82e-04 | 2.61e-03 | 20 |
| GO:00068513 | Liver | HCC | mitochondrial calcium ion transmembrane transport | 16/7958 | 20/18723 | 7.15e-04 | 4.37e-03 | 16 |
| GO:000683928 | Thyroid | PTC | mitochondrial transport | 150/5968 | 254/18723 | 2.76e-19 | 3.34e-17 | 150 |
| GO:199054225 | Thyroid | PTC | mitochondrial transmembrane transport | 57/5968 | 102/18723 | 4.49e-07 | 7.38e-06 | 57 |
| GO:00068515 | Thyroid | PTC | mitochondrial calcium ion transmembrane transport | 16/5968 | 20/18723 | 1.31e-05 | 1.42e-04 | 16 |
| GO:00515608 | Thyroid | PTC | mitochondrial calcium ion homeostasis | 19/5968 | 26/18723 | 1.93e-05 | 1.98e-04 | 19 |
| GO:00364446 | Thyroid | PTC | calcium import into the mitochondrion | 12/5968 | 14/18723 | 4.96e-05 | 4.42e-04 | 12 |
| GO:000683929 | Thyroid | ATC | mitochondrial transport | 151/6293 | 254/18723 | 2.07e-17 | 2.14e-15 | 151 |
| GO:199054226 | Thyroid | ATC | mitochondrial transmembrane transport | 57/6293 | 102/18723 | 3.05e-06 | 3.49e-05 | 57 |
| GO:000685111 | Thyroid | ATC | mitochondrial calcium ion transmembrane transport | 16/6293 | 20/18723 | 2.79e-05 | 2.36e-04 | 16 |
| GO:005156014 | Thyroid | ATC | mitochondrial calcium ion homeostasis | 19/6293 | 26/18723 | 4.49e-05 | 3.61e-04 | 19 |
| GO:003644412 | Thyroid | ATC | calcium import into the mitochondrion | 12/6293 | 14/18723 | 8.96e-05 | 6.59e-04 | 12 |
| Page: 1 |
| Pathway ID | Tissue | Disease Stage | Description | Gene Ratio | Bg Ratio | pvalue | p.adjust | qvalue | Count |
| Page: 1 |
Top |
Cell-cell communication analysis |
| Identification of potential cell-cell interactions between two cell types and their ligand-receptor pairs for different disease states |
| Ligand | Receptor | LRpair | Pathway | Tissue | Disease Stage |
| Page: 1 |
Top |
Single-cell gene regulatory network inference analysis |
| Find out the significant the regulons (TFs) and the target genes of each regulon across cell types for different disease states |
| TF | Cell Type | Tissue | Disease Stage | Target Gene | RSS | Regulon Activity |
| ∗The dot plots of a searched regulon are shown for all cell subpopulations in each disease state of each tissue based on the regulon specific score inferred using pySCENIC and by calculating the average expression. |
| Page: 1 |
Top |
Somatic mutation of malignant transformation related genes |
| Annotation of somatic variants for genes involved in malignant transformation |
| Hugo Symbol | Variant Class | Variant Classification | dbSNP RS | HGVSc | HGVSp | HGVSp Short | SWISSPROT | BIOTYPE | SIFT | PolyPhen | Tumor Sample Barcode | Tissue | Histology | Sex | Age | Stage | Therapy Types | Drugs | Outcome |
| MCUB | SNV | Missense_Mutation | c.509G>A | p.Arg170Lys | p.R170K | Q9NWR8 | protein_coding | tolerated(0.12) | benign(0.043) | TCGA-D8-A27G-01 | Breast | breast invasive carcinoma | Female | >=65 | I/II | Unknown | Unknown | SD | |
| MCUB | SNV | Missense_Mutation | rs765764154 | c.895G>A | p.Val299Met | p.V299M | Q9NWR8 | protein_coding | deleterious(0.03) | probably_damaging(0.994) | TCGA-C5-A7X8-01 | Cervix | cervical & endocervical cancer | Female | <65 | I/II | Chemotherapy | cisplatin | SD |
| MCUB | SNV | Missense_Mutation | rs771513878 | c.298C>G | p.Leu100Val | p.L100V | Q9NWR8 | protein_coding | tolerated(0.16) | possibly_damaging(0.609) | TCGA-A6-A566-01 | Colorectum | colon adenocarcinoma | Female | <65 | III/IV | Chemotherapy | oxaliplatin | PD |
| MCUB | SNV | Missense_Mutation | c.575N>G | p.Ile192Ser | p.I192S | Q9NWR8 | protein_coding | deleterious(0) | possibly_damaging(0.871) | TCGA-AA-A010-01 | Colorectum | colon adenocarcinoma | Female | <65 | I/II | Chemotherapy | folinic | CR | |
| MCUB | SNV | Missense_Mutation | c.170N>T | p.Pro57Leu | p.P57L | Q9NWR8 | protein_coding | tolerated(0.09) | benign(0.011) | TCGA-AD-6964-01 | Colorectum | colon adenocarcinoma | Male | <65 | III/IV | Chemotherapy | folfox | PD | |
| MCUB | SNV | Missense_Mutation | c.394N>G | p.Asn132Asp | p.N132D | Q9NWR8 | protein_coding | tolerated(0.54) | benign(0.01) | TCGA-AZ-6601-01 | Colorectum | colon adenocarcinoma | Male | >=65 | I/II | Unknown | Unknown | PD | |
| MCUB | deletion | Frame_Shift_Del | c.693delN | p.Gly232ValfsTer37 | p.G232Vfs*37 | Q9NWR8 | protein_coding | TCGA-G4-6320-01 | Colorectum | colon adenocarcinoma | Male | >=65 | III/IV | Chemotherapy | oxaliplatin | SD | |||
| MCUB | SNV | Missense_Mutation | rs139702688 | c.958C>T | p.Arg320Cys | p.R320C | Q9NWR8 | protein_coding | deleterious(0) | probably_damaging(0.994) | TCGA-A5-A0G1-01 | Endometrium | uterine corpus endometrioid carcinoma | Female | >=65 | I/II | Unknown | Unknown | SD |
| MCUB | SNV | Missense_Mutation | rs139702688 | c.958C>T | p.Arg320Cys | p.R320C | Q9NWR8 | protein_coding | deleterious(0) | probably_damaging(0.994) | TCGA-A5-A0GG-01 | Endometrium | uterine corpus endometrioid carcinoma | Female | >=65 | I/II | Unknown | Unknown | SD |
| MCUB | SNV | Missense_Mutation | c.379N>A | p.Asp127Asn | p.D127N | Q9NWR8 | protein_coding | deleterious(0.01) | possibly_damaging(0.678) | TCGA-AP-A059-01 | Endometrium | uterine corpus endometrioid carcinoma | Female | >=65 | I/II | Unknown | Unknown | SD |
| Page: 1 2 3 4 |
Top |
Related drugs of malignant transformation related genes |
| Identification of chemicals and drugs interact with genes involved in malignant transfromation |
| (DGIdb 4.0) |
| Entrez ID | Symbol | Category | Interaction Types | Drug Claim Name | Drug Name | PMIDs |
| Page: 1 |

Copyright 2023-Present -The University of Texas Health Science Center at Houston |