
|
|||||
|
 | |
| |
| |
| |
| |
| |
|
Gene: LARS1 |
Gene summary for LARS1 |
| Gene information | Species | Human | Gene symbol | LARS1 | Gene ID | 51520 |
| Gene name | leucyl-tRNA synthetase 1 | |
| Gene Alias | HSPC192 | |
| Cytomap | 5q32 | |
| Gene Type | protein-coding | GO ID | GO:0001101 | UniProtAcc | B4E266 |
Top |
Malignant transformation analysis |
| Identification of the aberrant gene expression in precancerous and cancerous lesions by comparing the gene expression of stem-like cells in diseased tissues with normal stem cells |
| Entrez ID | Symbol | Replicates | Species | Organ | Tissue | Adj P-value | Log2FC | Malignancy |
| 51520 | LARS1 | HTA11_3410_2000001011 | Human | Colorectum | AD | 1.08e-08 | 1.79e-01 | 0.0155 |
| 51520 | LARS1 | HTA11_2487_2000001011 | Human | Colorectum | SER | 2.44e-05 | 1.89e-01 | -0.1808 |
| 51520 | LARS1 | HTA11_2951_2000001011 | Human | Colorectum | AD | 3.40e-03 | 2.22e-01 | 0.0216 |
| 51520 | LARS1 | HTA11_1938_2000001011 | Human | Colorectum | AD | 2.53e-23 | 5.45e-01 | -0.0811 |
| 51520 | LARS1 | HTA11_78_2000001011 | Human | Colorectum | AD | 1.40e-18 | 4.73e-01 | -0.1088 |
| 51520 | LARS1 | HTA11_347_2000001011 | Human | Colorectum | AD | 3.20e-40 | 7.31e-01 | -0.1954 |
| 51520 | LARS1 | HTA11_411_2000001011 | Human | Colorectum | SER | 4.01e-04 | 2.94e-01 | -0.2602 |
| 51520 | LARS1 | HTA11_2112_2000001011 | Human | Colorectum | SER | 1.90e-02 | 2.12e-01 | -0.2196 |
| 51520 | LARS1 | HTA11_3361_2000001011 | Human | Colorectum | AD | 4.57e-06 | 2.35e-01 | -0.1207 |
| 51520 | LARS1 | HTA11_83_2000001011 | Human | Colorectum | SER | 1.60e-14 | 4.19e-01 | -0.1526 |
| 51520 | LARS1 | HTA11_696_2000001011 | Human | Colorectum | AD | 2.46e-16 | 3.12e-01 | -0.1464 |
| 51520 | LARS1 | HTA11_866_2000001011 | Human | Colorectum | AD | 2.46e-16 | 3.41e-01 | -0.1001 |
| 51520 | LARS1 | HTA11_1391_2000001011 | Human | Colorectum | AD | 2.01e-20 | 5.29e-01 | -0.059 |
| 51520 | LARS1 | HTA11_2992_2000001011 | Human | Colorectum | SER | 2.14e-07 | 3.56e-01 | -0.1706 |
| 51520 | LARS1 | HTA11_546_2000001011 | Human | Colorectum | AD | 6.64e-16 | 4.42e-01 | -0.0842 |
| 51520 | LARS1 | HTA11_7862_2000001011 | Human | Colorectum | AD | 5.15e-10 | 3.39e-01 | -0.0179 |
| 51520 | LARS1 | HTA11_866_3004761011 | Human | Colorectum | AD | 4.76e-13 | 2.88e-01 | 0.096 |
| 51520 | LARS1 | HTA11_4255_2000001011 | Human | Colorectum | SER | 2.17e-09 | 4.41e-01 | 0.0446 |
| 51520 | LARS1 | HTA11_9408_2000001011 | Human | Colorectum | AD | 9.81e-03 | 2.34e-01 | 0.0451 |
| 51520 | LARS1 | HTA11_8622_2000001021 | Human | Colorectum | SER | 6.14e-04 | 2.26e-01 | 0.0528 |
| Page: 1 2 |
| Tissue | Expression Dynamics | Abbreviation |
| Colorectum (GSE201348) | 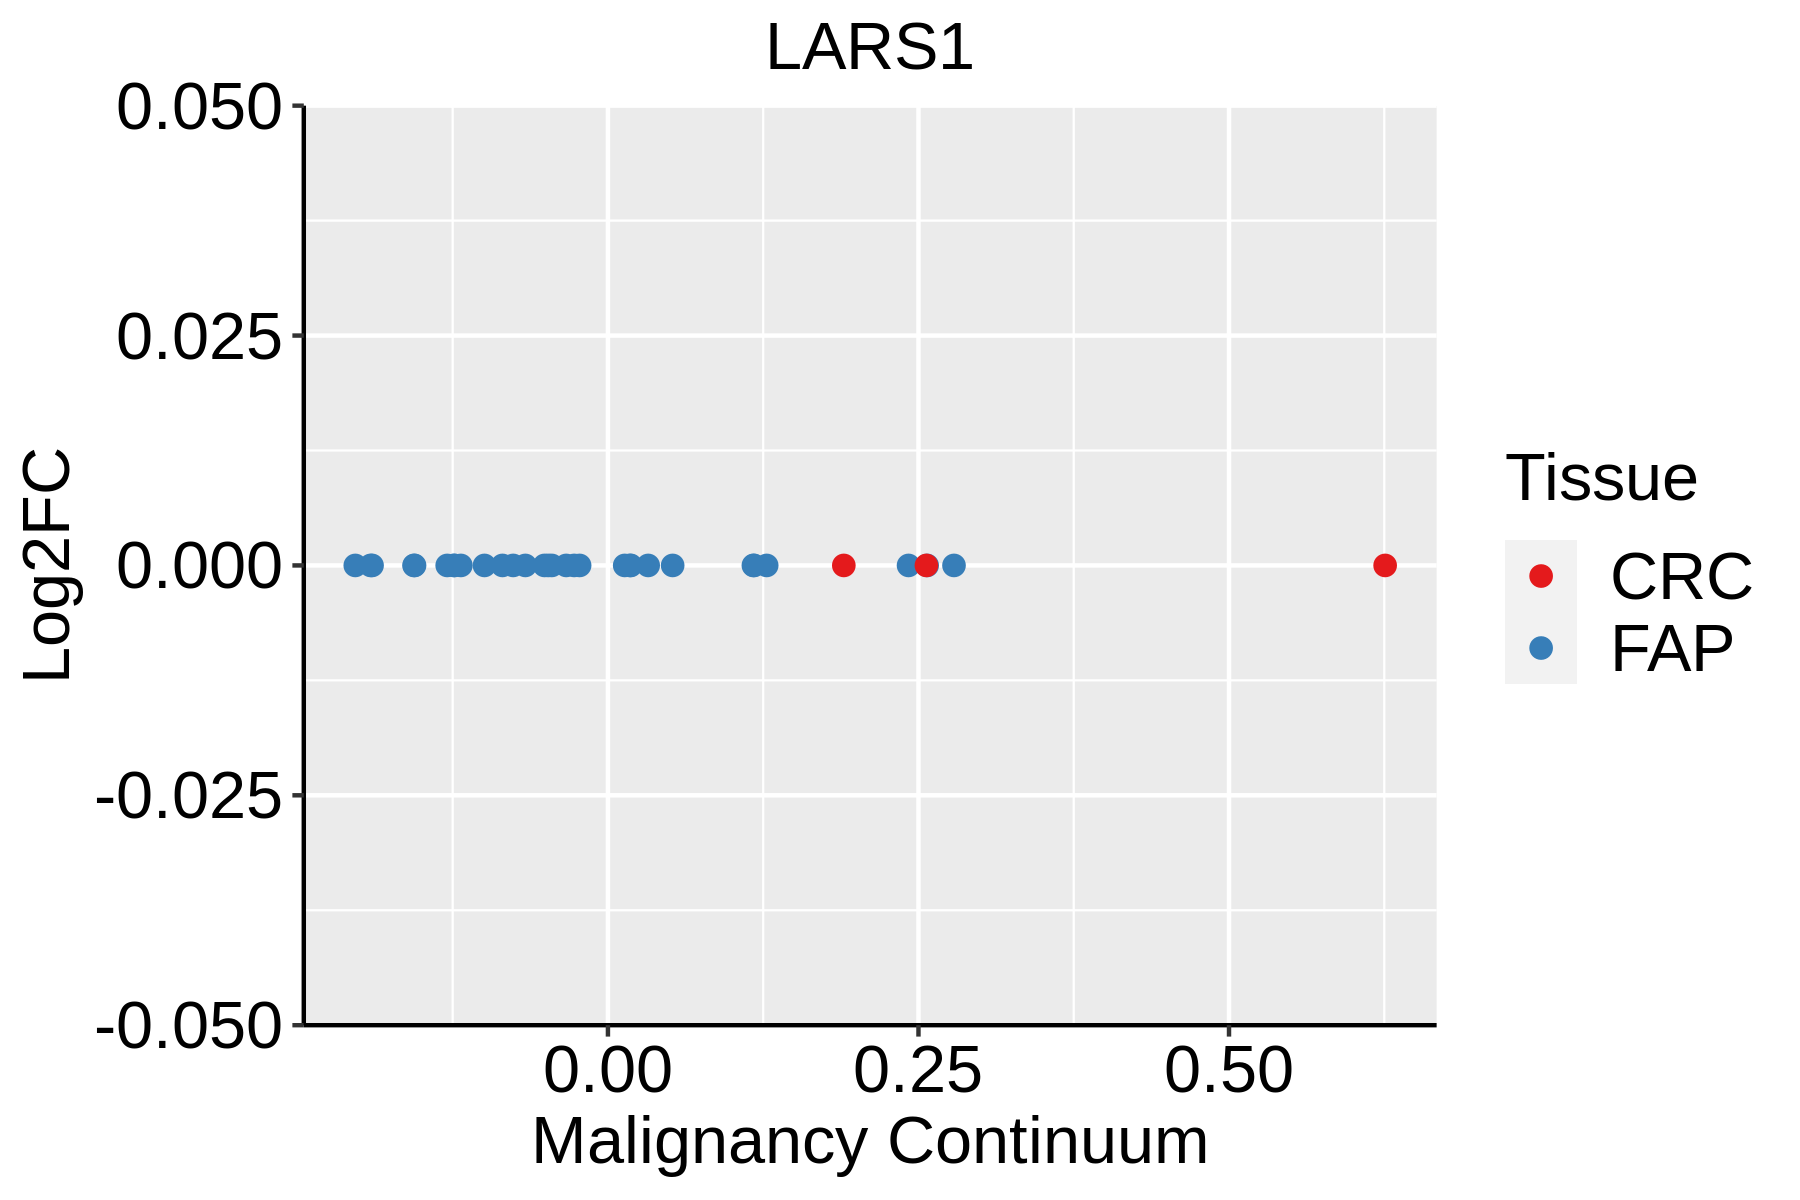 | FAP: Familial adenomatous polyposis |
| CRC: Colorectal cancer | ||
| Colorectum (HTA11) |  | AD: Adenomas |
| SER: Sessile serrated lesions | ||
| MSI-H: Microsatellite-high colorectal cancer | ||
| MSS: Microsatellite stable colorectal cancer |
| ∗log2FC in expression of this searched gene in stem-like cells from each diseased tissue sample relative to stem-like cells in normal samples in each tissue plotted against the malignancy continuum. Samples are colored based on if they are from different disease stage. |
Top |
Malignant transformation related pathway analysis |
| Find out the enriched GO biological processes and KEGG pathways involved in transition from healthy to precancer to cancer |
| Tissue | Disease Stage | Enriched GO biological Processes |
| Cervix | N_HPV |  |
| Endometrium | AEH |  |
| Endometrium | EEC |  |
| Prostate | BPH |  |
| Prostate | Tumor |  |
| ∗Top 15 enriched GO BP terms are showed in the bar plot of each disease state in each tissue. Each row represents a significant GO biological process which is colored according to the -log10(p.adjust). |
| Page: 1 2 3 4 5 6 7 8 9 |
| GO ID | Tissue | Disease Stage | Description | Gene Ratio | Bg Ratio | pvalue | p.adjust | Count |
| GO:0032535 | Colorectum | AD | regulation of cellular component size | 142/3918 | 383/18723 | 1.74e-13 | 3.41e-11 | 142 |
| GO:0043087 | Colorectum | AD | regulation of GTPase activity | 110/3918 | 348/18723 | 1.64e-06 | 5.03e-05 | 110 |
| GO:0031667 | Colorectum | AD | response to nutrient levels | 138/3918 | 474/18723 | 1.22e-05 | 2.68e-04 | 138 |
| GO:0042594 | Colorectum | AD | response to starvation | 63/3918 | 197/18723 | 1.77e-04 | 2.38e-03 | 63 |
| GO:0071496 | Colorectum | AD | cellular response to external stimulus | 94/3918 | 320/18723 | 1.98e-04 | 2.64e-03 | 94 |
| GO:0006418 | Colorectum | AD | tRNA aminoacylation for protein translation | 19/3918 | 41/18723 | 2.37e-04 | 3.03e-03 | 19 |
| GO:0009267 | Colorectum | AD | cellular response to starvation | 51/3918 | 156/18723 | 3.90e-04 | 4.44e-03 | 51 |
| GO:0043039 | Colorectum | AD | tRNA aminoacylation | 19/3918 | 44/18723 | 7.13e-04 | 7.21e-03 | 19 |
| GO:0043547 | Colorectum | AD | positive regulation of GTPase activity | 75/3918 | 255/18723 | 7.95e-04 | 7.91e-03 | 75 |
| GO:0008361 | Colorectum | AD | regulation of cell size | 56/3918 | 181/18723 | 9.61e-04 | 9.07e-03 | 56 |
| GO:0043038 | Colorectum | AD | amino acid activation | 19/3918 | 45/18723 | 9.94e-04 | 9.28e-03 | 19 |
| GO:0006520 | Colorectum | AD | cellular amino acid metabolic process | 81/3918 | 284/18723 | 1.37e-03 | 1.19e-02 | 81 |
| GO:0031668 | Colorectum | AD | cellular response to extracellular stimulus | 71/3918 | 246/18723 | 1.86e-03 | 1.52e-02 | 71 |
| GO:0031669 | Colorectum | AD | cellular response to nutrient levels | 63/3918 | 215/18723 | 2.19e-03 | 1.73e-02 | 63 |
| GO:00325351 | Colorectum | SER | regulation of cellular component size | 115/2897 | 383/18723 | 3.04e-13 | 1.10e-10 | 115 |
| GO:00316671 | Colorectum | SER | response to nutrient levels | 106/2897 | 474/18723 | 3.94e-05 | 1.00e-03 | 106 |
| GO:00064181 | Colorectum | SER | tRNA aminoacylation for protein translation | 17/2897 | 41/18723 | 5.75e-05 | 1.35e-03 | 17 |
| GO:00430391 | Colorectum | SER | tRNA aminoacylation | 17/2897 | 44/18723 | 1.64e-04 | 3.12e-03 | 17 |
| GO:00430381 | Colorectum | SER | amino acid activation | 17/2897 | 45/18723 | 2.25e-04 | 3.91e-03 | 17 |
| GO:00430871 | Colorectum | SER | regulation of GTPase activity | 77/2897 | 348/18723 | 5.90e-04 | 8.07e-03 | 77 |
| Page: 1 2 |
| Pathway ID | Tissue | Disease Stage | Description | Gene Ratio | Bg Ratio | pvalue | p.adjust | qvalue | Count |
| Page: 1 |
Top |
Cell-cell communication analysis |
| Identification of potential cell-cell interactions between two cell types and their ligand-receptor pairs for different disease states |
| Ligand | Receptor | LRpair | Pathway | Tissue | Disease Stage |
| Page: 1 |
Top |
Single-cell gene regulatory network inference analysis |
| Find out the significant the regulons (TFs) and the target genes of each regulon across cell types for different disease states |
| TF | Cell Type | Tissue | Disease Stage | Target Gene | RSS | Regulon Activity |
| ∗The dot plots of a searched regulon are shown for all cell subpopulations in each disease state of each tissue based on the regulon specific score inferred using pySCENIC and by calculating the average expression. |
| Page: 1 |
Top |
Somatic mutation of malignant transformation related genes |
| Annotation of somatic variants for genes involved in malignant transformation |
| Hugo Symbol | Variant Class | Variant Classification | dbSNP RS | HGVSc | HGVSp | HGVSp Short | SWISSPROT | BIOTYPE | SIFT | PolyPhen | Tumor Sample Barcode | Tissue | Histology | Sex | Age | Stage | Therapy Types | Drugs | Outcome |
| Page: 1 |
Top |
Related drugs of malignant transformation related genes |
| Identification of chemicals and drugs interact with genes involved in malignant transfromation |
| (DGIdb 4.0) |
| Entrez ID | Symbol | Category | Interaction Types | Drug Claim Name | Drug Name | PMIDs |
| Page: 1 |

Copyright 2023-Present -The University of Texas Health Science Center at Houston |