
|
|||||
|
 | |
| |
| |
| |
| |
| |
|
Gene: HOXA11-AS |
Gene summary for HOXA11-AS |
| Gene information | Species | Human | Gene symbol | HOXA11-AS | Gene ID | 221883 |
| Gene name | HOXA11 antisense RNA | |
| Gene Alias | HOXA-AS5 | |
| Cytomap | 7p15.2 | |
| Gene Type | ncRNA | GO ID | GO:0008150 | UniProtAcc | NA |
Top |
Malignant transformation analysis |
| Identification of the aberrant gene expression in precancerous and cancerous lesions by comparing the gene expression of stem-like cells in diseased tissues with normal stem cells |
| Entrez ID | Symbol | Replicates | Species | Organ | Tissue | Adj P-value | Log2FC | Malignancy |
| 221883 | HOXA11-AS | HTA11_3410_2000001011 | Human | Colorectum | AD | 1.04e-08 | -2.80e-01 | 0.0155 |
| 221883 | HOXA11-AS | HTA11_2487_2000001011 | Human | Colorectum | SER | 3.02e-04 | -2.80e-01 | -0.1808 |
| 221883 | HOXA11-AS | HTA11_1938_2000001011 | Human | Colorectum | AD | 1.11e-02 | -2.80e-01 | -0.0811 |
| 221883 | HOXA11-AS | HTA11_78_2000001011 | Human | Colorectum | AD | 2.90e-02 | -2.63e-01 | -0.1088 |
| 221883 | HOXA11-AS | HTA11_347_2000001011 | Human | Colorectum | AD | 6.08e-03 | -2.45e-01 | -0.1954 |
| 221883 | HOXA11-AS | HTA11_1391_2000001011 | Human | Colorectum | AD | 2.12e-03 | -2.66e-01 | -0.059 |
| 221883 | HOXA11-AS | HTA11_866_3004761011 | Human | Colorectum | AD | 2.43e-03 | -2.61e-01 | 0.096 |
| 221883 | HOXA11-AS | HTA11_7696_3000711011 | Human | Colorectum | AD | 6.68e-06 | -2.72e-01 | 0.0674 |
| 221883 | HOXA11-AS | HTA11_6818_2000001021 | Human | Colorectum | AD | 1.94e-02 | -2.80e-01 | 0.0588 |
| 221883 | HOXA11-AS | HTA11_99999970781_79442 | Human | Colorectum | MSS | 1.05e-05 | -2.77e-01 | 0.294 |
| 221883 | HOXA11-AS | A015-C-203 | Human | Colorectum | FAP | 7.84e-04 | -4.15e-02 | -0.1294 |
| 221883 | HOXA11-AS | A015-C-204 | Human | Colorectum | FAP | 7.94e-07 | -2.80e-01 | -0.0228 |
| 221883 | HOXA11-AS | A002-C-201 | Human | Colorectum | FAP | 7.69e-04 | -2.10e-01 | 0.0324 |
| 221883 | HOXA11-AS | A002-C-205 | Human | Colorectum | FAP | 1.94e-02 | 3.26e-02 | -0.1236 |
| 221883 | HOXA11-AS | A014-C-108 | Human | Colorectum | FAP | 3.24e-17 | 8.05e-01 | -0.124 |
| 221883 | HOXA11-AS | A015-C-106 | Human | Colorectum | FAP | 1.00e-04 | 2.67e-01 | -0.0511 |
| 221883 | HOXA11-AS | A002-C-114 | Human | Colorectum | FAP | 2.03e-02 | 1.44e-01 | -0.1561 |
| 221883 | HOXA11-AS | A015-C-104 | Human | Colorectum | FAP | 1.15e-05 | 1.23e-01 | -0.1899 |
| 221883 | HOXA11-AS | A015-C-202 | Human | Colorectum | FAP | 4.90e-22 | 7.23e-01 | -0.0849 |
| 221883 | HOXA11-AS | A002-C-116 | Human | Colorectum | FAP | 4.02e-03 | -1.99e-01 | -0.0452 |
| Page: 1 2 |
| Tissue | Expression Dynamics | Abbreviation |
| Colorectum (GSE201348) |  | FAP: Familial adenomatous polyposis |
| CRC: Colorectal cancer | ||
| Colorectum (HTA11) |  | AD: Adenomas |
| SER: Sessile serrated lesions | ||
| MSI-H: Microsatellite-high colorectal cancer | ||
| MSS: Microsatellite stable colorectal cancer | ||
| Prostate | 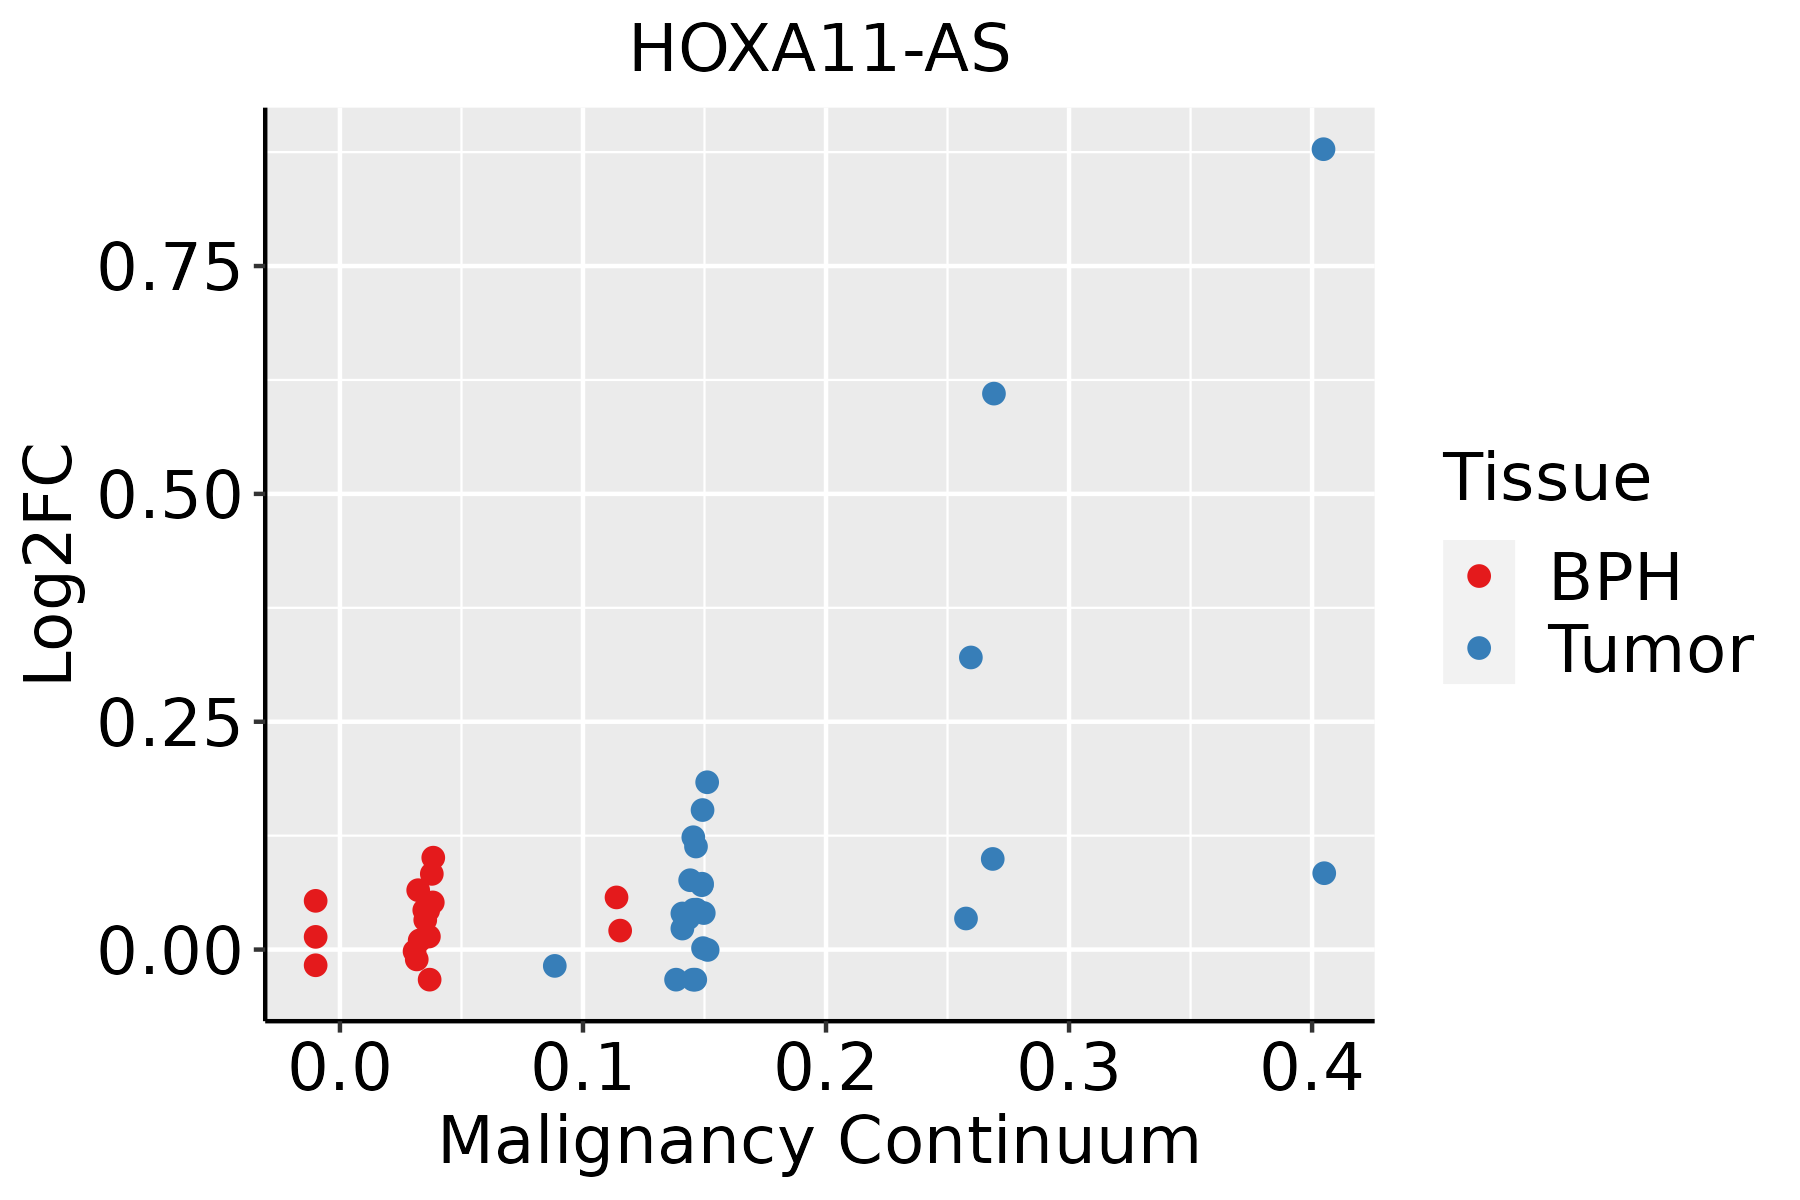 | BPH: Benign Prostatic Hyperplasia |
| ∗log2FC in expression of this searched gene in stem-like cells from each diseased tissue sample relative to stem-like cells in normal samples in each tissue plotted against the malignancy continuum. Samples are colored based on if they are from different disease stage. |
Top |
Malignant transformation related pathway analysis |
| Find out the enriched GO biological processes and KEGG pathways involved in transition from healthy to precancer to cancer |
| Tissue | Disease Stage | Enriched GO biological Processes |
| Cervix | N_HPV |  |
| Endometrium | AEH |  |
| Endometrium | EEC |  |
| Prostate | BPH |  |
| Prostate | Tumor |  |
| ∗Top 15 enriched GO BP terms are showed in the bar plot of each disease state in each tissue. Each row represents a significant GO biological process which is colored according to the -log10(p.adjust). |
| Page: 1 2 3 4 5 6 7 8 9 |
| GO ID | Tissue | Disease Stage | Description | Gene Ratio | Bg Ratio | pvalue | p.adjust | Count |
| Page: 1 |
| Pathway ID | Tissue | Disease Stage | Description | Gene Ratio | Bg Ratio | pvalue | p.adjust | qvalue | Count |
| Page: 1 |
Top |
Cell-cell communication analysis |
| Identification of potential cell-cell interactions between two cell types and their ligand-receptor pairs for different disease states |
| Ligand | Receptor | LRpair | Pathway | Tissue | Disease Stage |
| Page: 1 |
Top |
Single-cell gene regulatory network inference analysis |
| Find out the significant the regulons (TFs) and the target genes of each regulon across cell types for different disease states |
| TF | Cell Type | Tissue | Disease Stage | Target Gene | RSS | Regulon Activity |
| ∗The dot plots of a searched regulon are shown for all cell subpopulations in each disease state of each tissue based on the regulon specific score inferred using pySCENIC and by calculating the average expression. |
| Page: 1 |
Top |
Somatic mutation of malignant transformation related genes |
| Annotation of somatic variants for genes involved in malignant transformation |
| Hugo Symbol | Variant Class | Variant Classification | dbSNP RS | HGVSc | HGVSp | HGVSp Short | SWISSPROT | BIOTYPE | SIFT | PolyPhen | Tumor Sample Barcode | Tissue | Histology | Sex | Age | Stage | Therapy Types | Drugs | Outcome |
| Page: 1 |
Top |
Related drugs of malignant transformation related genes |
| Identification of chemicals and drugs interact with genes involved in malignant transfromation |
| (DGIdb 4.0) |
| Entrez ID | Symbol | Category | Interaction Types | Drug Claim Name | Drug Name | PMIDs |
| Page: 1 |

Copyright 2023-Present -The University of Texas Health Science Center at Houston |