
|
|||||
|
 | |
| |
| |
| |
| |
| |
|
Gene: H2AZ1 |
Gene summary for H2AZ1 |
| Gene information | Species | Human | Gene symbol | H2AZ1 | Gene ID | 3015 |
| Gene name | H2A.Z variant histone 1 | |
| Gene Alias | H2A.Z-1 | |
| Cytomap | 4q23 | |
| Gene Type | protein-coding | GO ID | GO:0006139 | UniProtAcc | P0C0S5 |
Top |
Malignant transformation analysis |
| Identification of the aberrant gene expression in precancerous and cancerous lesions by comparing the gene expression of stem-like cells in diseased tissues with normal stem cells |
| Entrez ID | Symbol | Replicates | Species | Organ | Tissue | Adj P-value | Log2FC | Malignancy |
| 3015 | H2AZ1 | CA_HPV_1 | Human | Cervix | CC | 1.94e-06 | -1.80e-01 | 0.0264 |
| 3015 | H2AZ1 | CA_HPV_3 | Human | Cervix | CC | 1.83e-05 | 2.93e-01 | 0.0414 |
| 3015 | H2AZ1 | CCI_1 | Human | Cervix | CC | 1.83e-17 | -9.03e-01 | 0.528 |
| 3015 | H2AZ1 | CCI_2 | Human | Cervix | CC | 3.60e-16 | -9.03e-01 | 0.5249 |
| 3015 | H2AZ1 | CCI_3 | Human | Cervix | CC | 1.22e-22 | -9.03e-01 | 0.516 |
| 3015 | H2AZ1 | CCII_1 | Human | Cervix | CC | 1.73e-30 | -9.03e-01 | 0.3249 |
| 3015 | H2AZ1 | Tumor | Human | Cervix | CC | 1.34e-58 | -9.03e-01 | 0.1241 |
| 3015 | H2AZ1 | sample1 | Human | Cervix | CC | 6.90e-26 | -9.03e-01 | 0.0959 |
| 3015 | H2AZ1 | sample3 | Human | Cervix | CC | 4.14e-57 | -9.03e-01 | 0.1387 |
| 3015 | H2AZ1 | H2 | Human | Cervix | HSIL_HPV | 4.21e-59 | -9.03e-01 | 0.0632 |
| 3015 | H2AZ1 | L1 | Human | Cervix | CC | 3.43e-33 | -9.03e-01 | 0.0802 |
| 3015 | H2AZ1 | T1 | Human | Cervix | CC | 1.21e-52 | -9.03e-01 | 0.0918 |
| 3015 | H2AZ1 | T2 | Human | Cervix | CC | 2.21e-15 | -9.03e-01 | 0.0709 |
| 3015 | H2AZ1 | T3 | Human | Cervix | CC | 4.21e-59 | -9.03e-01 | 0.1389 |
| 3015 | H2AZ1 | HTA11_3410_2000001011 | Human | Colorectum | AD | 1.81e-06 | 1.74e-01 | 0.0155 |
| 3015 | H2AZ1 | HTA11_2487_2000001011 | Human | Colorectum | SER | 1.32e-08 | 3.87e-01 | -0.1808 |
| 3015 | H2AZ1 | HTA11_2951_2000001011 | Human | Colorectum | AD | 2.79e-07 | 3.89e-01 | 0.0216 |
| 3015 | H2AZ1 | HTA11_1938_2000001011 | Human | Colorectum | AD | 3.85e-14 | 5.36e-01 | -0.0811 |
| 3015 | H2AZ1 | HTA11_78_2000001011 | Human | Colorectum | AD | 8.26e-09 | 2.98e-01 | -0.1088 |
| 3015 | H2AZ1 | HTA11_347_2000001011 | Human | Colorectum | AD | 1.01e-20 | 4.42e-01 | -0.1954 |
| Page: 1 2 3 |
| Tissue | Expression Dynamics | Abbreviation |
| Cervix | 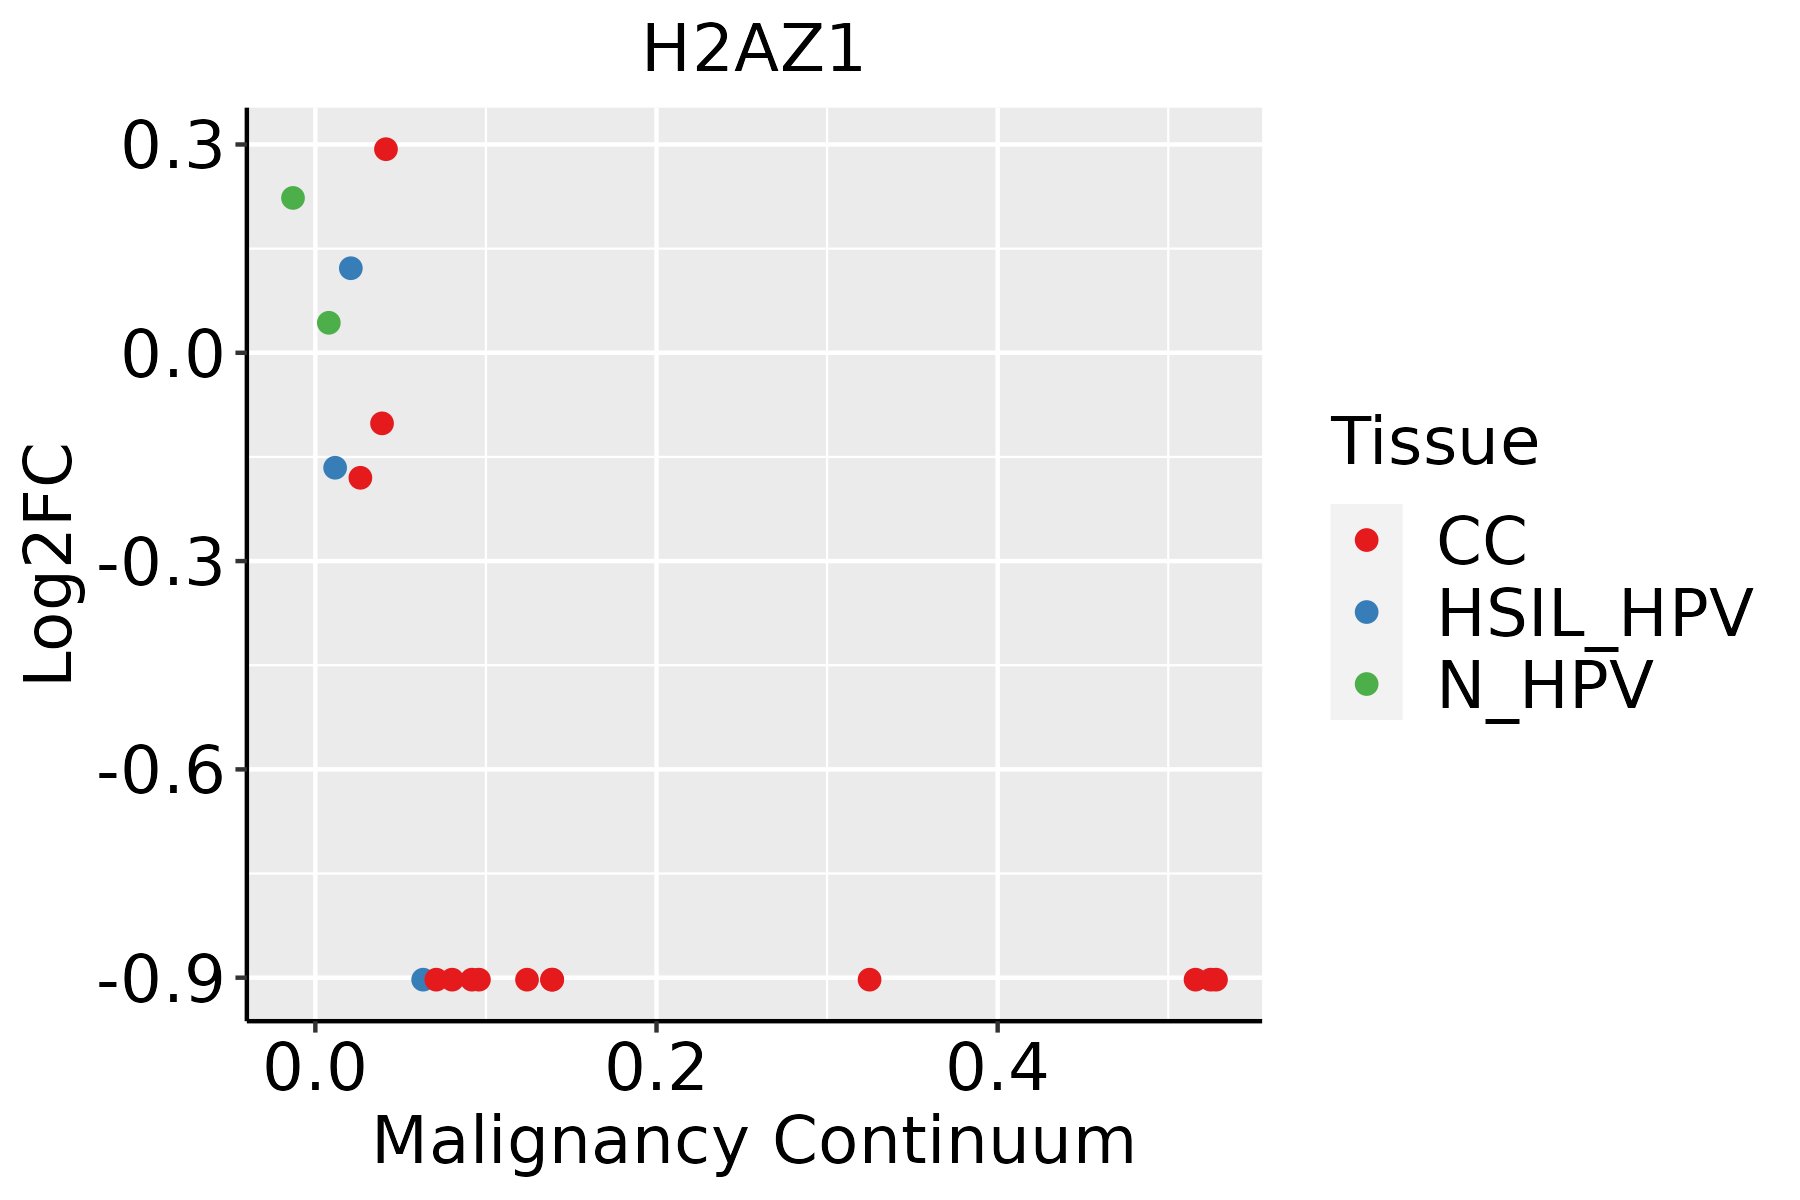 | CC: Cervix cancer |
| HSIL_HPV: HPV-infected high-grade squamous intraepithelial lesions | ||
| N_HPV: HPV-infected normal cervix | ||
| Colorectum (GSE201348) |  | FAP: Familial adenomatous polyposis |
| CRC: Colorectal cancer | ||
| Colorectum (HTA11) | 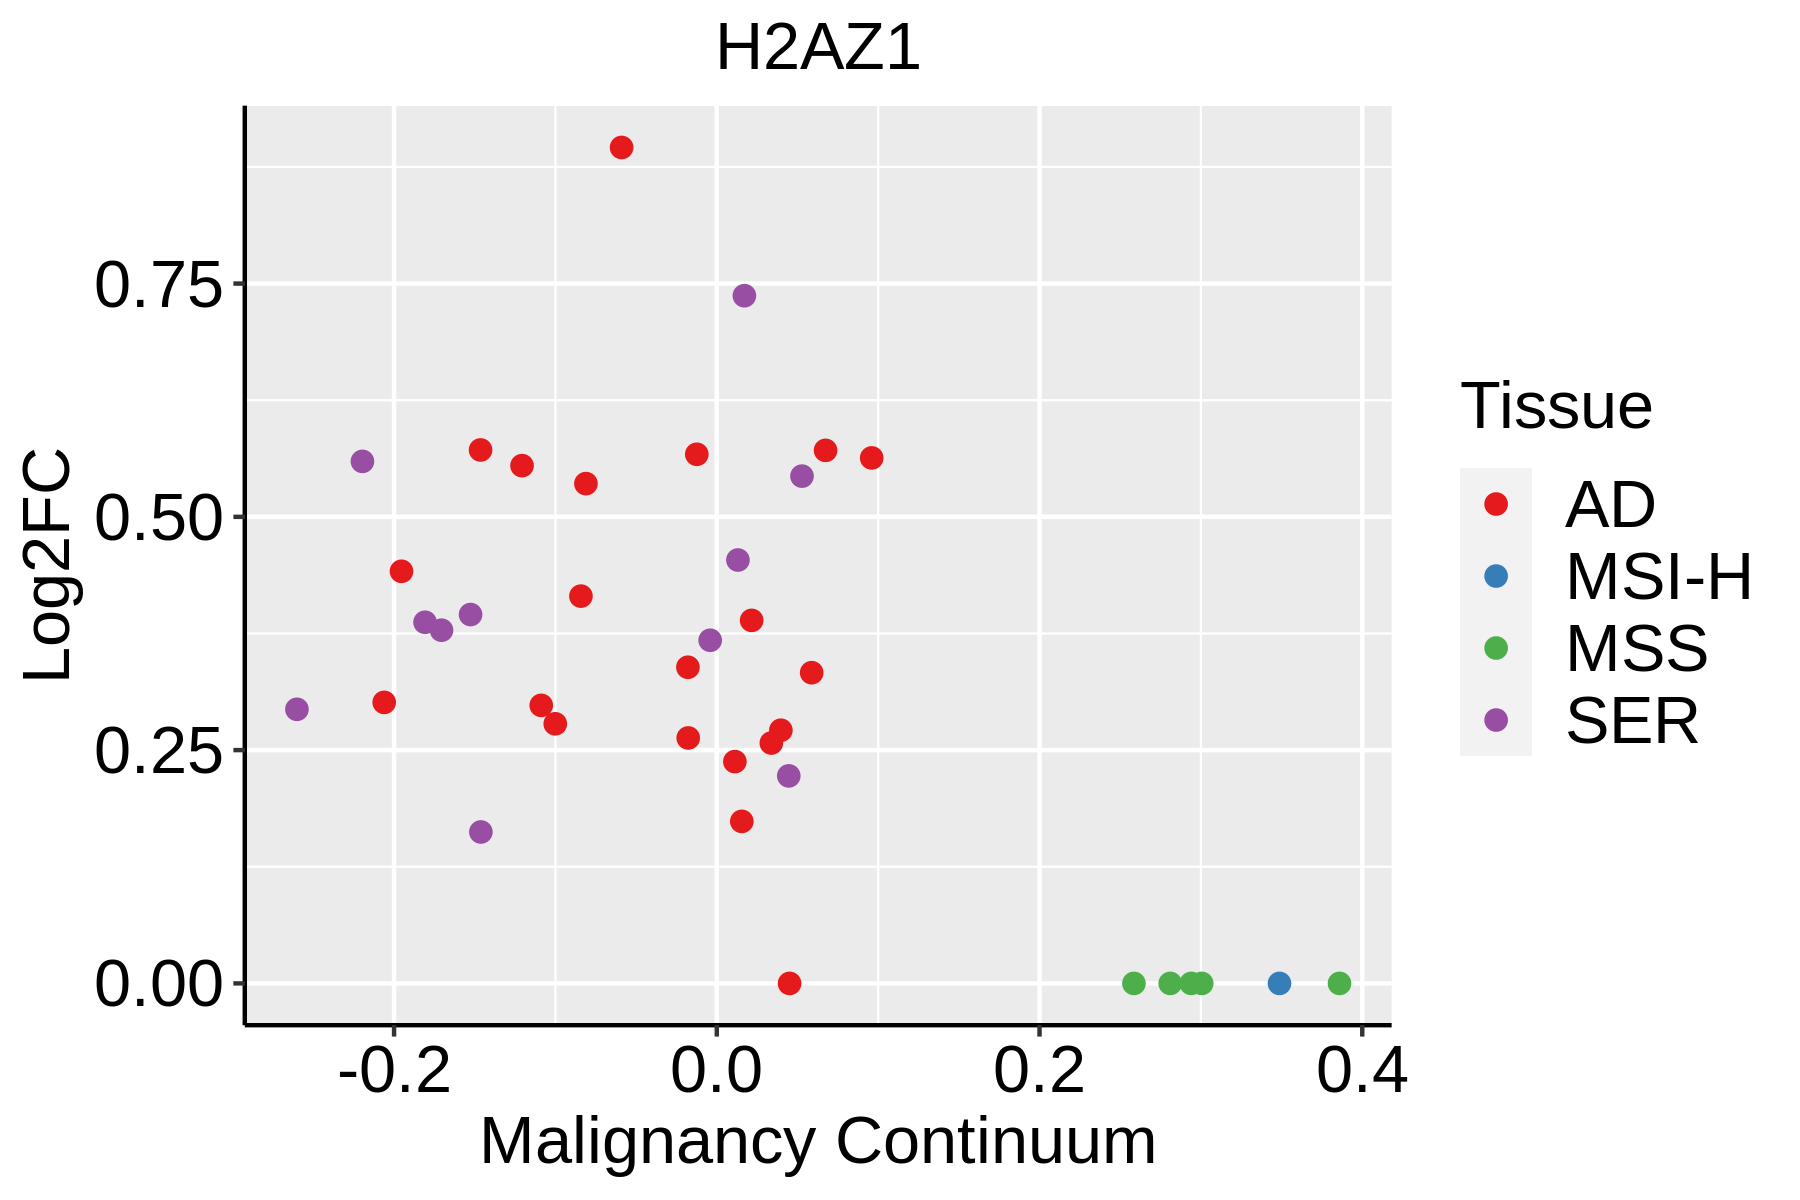 | AD: Adenomas |
| SER: Sessile serrated lesions | ||
| MSI-H: Microsatellite-high colorectal cancer | ||
| MSS: Microsatellite stable colorectal cancer |
| ∗log2FC in expression of this searched gene in stem-like cells from each diseased tissue sample relative to stem-like cells in normal samples in each tissue plotted against the malignancy continuum. Samples are colored based on if they are from different disease stage. |
Top |
Malignant transformation related pathway analysis |
| Find out the enriched GO biological processes and KEGG pathways involved in transition from healthy to precancer to cancer |
| Tissue | Disease Stage | Enriched GO biological Processes |
| Cervix | N_HPV |  |
| Endometrium | AEH |  |
| Endometrium | EEC |  |
| Prostate | BPH |  |
| Prostate | Tumor |  |
| ∗Top 15 enriched GO BP terms are showed in the bar plot of each disease state in each tissue. Each row represents a significant GO biological process which is colored according to the -log10(p.adjust). |
| Page: 1 2 3 4 5 6 7 8 9 |
| GO ID | Tissue | Disease Stage | Description | Gene Ratio | Bg Ratio | pvalue | p.adjust | Count |
| GO:00323556 | Cervix | CC | response to estradiol | 34/2311 | 141/18723 | 8.19e-05 | 1.11e-03 | 34 |
| GO:003235513 | Cervix | HSIL_HPV | response to estradiol | 18/737 | 141/18723 | 1.09e-05 | 3.69e-04 | 18 |
| Page: 1 |
| Pathway ID | Tissue | Disease Stage | Description | Gene Ratio | Bg Ratio | pvalue | p.adjust | qvalue | Count |
| hsa05322 | Cervix | HSIL_HPV | Systemic lupus erythematosus | 19/459 | 137/8465 | 1.40e-04 | 1.74e-03 | 1.40e-03 | 19 |
| hsa053221 | Cervix | HSIL_HPV | Systemic lupus erythematosus | 19/459 | 137/8465 | 1.40e-04 | 1.74e-03 | 1.40e-03 | 19 |
| hsa04217 | Colorectum | SER | Necroptosis | 47/1580 | 159/8465 | 5.21e-04 | 4.44e-03 | 3.22e-03 | 47 |
| hsa042171 | Colorectum | SER | Necroptosis | 47/1580 | 159/8465 | 5.21e-04 | 4.44e-03 | 3.22e-03 | 47 |
| Page: 1 |
Top |
Cell-cell communication analysis |
| Identification of potential cell-cell interactions between two cell types and their ligand-receptor pairs for different disease states |
| Ligand | Receptor | LRpair | Pathway | Tissue | Disease Stage |
| Page: 1 |
Top |
Single-cell gene regulatory network inference analysis |
| Find out the significant the regulons (TFs) and the target genes of each regulon across cell types for different disease states |
| TF | Cell Type | Tissue | Disease Stage | Target Gene | RSS | Regulon Activity |
| ∗The dot plots of a searched regulon are shown for all cell subpopulations in each disease state of each tissue based on the regulon specific score inferred using pySCENIC and by calculating the average expression. |
| Page: 1 |
Top |
Somatic mutation of malignant transformation related genes |
| Annotation of somatic variants for genes involved in malignant transformation |
| Hugo Symbol | Variant Class | Variant Classification | dbSNP RS | HGVSc | HGVSp | HGVSp Short | SWISSPROT | BIOTYPE | SIFT | PolyPhen | Tumor Sample Barcode | Tissue | Histology | Sex | Age | Stage | Therapy Types | Drugs | Outcome |
| Page: 1 |
Top |
Related drugs of malignant transformation related genes |
| Identification of chemicals and drugs interact with genes involved in malignant transfromation |
| (DGIdb 4.0) |
| Entrez ID | Symbol | Category | Interaction Types | Drug Claim Name | Drug Name | PMIDs |
| Page: 1 |

Copyright 2023-Present -The University of Texas Health Science Center at Houston |