
|
|||||
|
 | |
| |
| |
| |
| |
| |
|
Gene: GLB1 |
Gene summary for GLB1 |
| Gene information | Species | Human | Gene symbol | GLB1 | Gene ID | 2720 |
| Gene name | galactosidase beta 1 | |
| Gene Alias | EBP | |
| Cytomap | 3p22.3 | |
| Gene Type | protein-coding | GO ID | GO:0005975 | UniProtAcc | P16278 |
Top |
Malignant transformation analysis |
| Identification of the aberrant gene expression in precancerous and cancerous lesions by comparing the gene expression of stem-like cells in diseased tissues with normal stem cells |
| Entrez ID | Symbol | Replicates | Species | Organ | Tissue | Adj P-value | Log2FC | Malignancy |
| 2720 | GLB1 | HTA11_347_2000001011 | Human | Colorectum | AD | 1.49e-09 | 4.47e-01 | -0.1954 |
| 2720 | GLB1 | HTA11_696_2000001011 | Human | Colorectum | AD | 2.70e-02 | 3.09e-01 | -0.1464 |
| 2720 | GLB1 | HTA11_866_3004761011 | Human | Colorectum | AD | 3.41e-07 | 5.12e-01 | 0.096 |
| 2720 | GLB1 | HTA11_99999970781_79442 | Human | Colorectum | MSS | 1.32e-03 | 3.74e-01 | 0.294 |
| 2720 | GLB1 | HTA11_99999971662_82457 | Human | Colorectum | MSS | 3.33e-19 | 7.58e-01 | 0.3859 |
| 2720 | GLB1 | HTA11_99999974143_84620 | Human | Colorectum | MSS | 3.70e-05 | 3.48e-01 | 0.3005 |
| 2720 | GLB1 | A015-C-203 | Human | Colorectum | FAP | 2.81e-04 | -1.23e-01 | -0.1294 |
| 2720 | GLB1 | A002-C-201 | Human | Colorectum | FAP | 2.43e-02 | -1.42e-01 | 0.0324 |
| 2720 | GLB1 | A002-C-205 | Human | Colorectum | FAP | 1.03e-03 | -7.54e-02 | -0.1236 |
| 2720 | GLB1 | A015-C-006 | Human | Colorectum | FAP | 1.16e-02 | -1.01e-01 | -0.0994 |
| 2720 | GLB1 | A015-C-106 | Human | Colorectum | FAP | 1.03e-02 | -9.05e-02 | -0.0511 |
| 2720 | GLB1 | A002-C-114 | Human | Colorectum | FAP | 3.59e-03 | -1.13e-01 | -0.1561 |
| 2720 | GLB1 | A015-C-104 | Human | Colorectum | FAP | 1.34e-04 | -1.70e-01 | -0.1899 |
| 2720 | GLB1 | A002-C-016 | Human | Colorectum | FAP | 5.74e-05 | -1.45e-01 | 0.0521 |
| 2720 | GLB1 | A015-C-002 | Human | Colorectum | FAP | 1.82e-02 | -2.20e-01 | -0.0763 |
| 2720 | GLB1 | A002-C-116 | Human | Colorectum | FAP | 1.21e-05 | -1.27e-01 | -0.0452 |
| 2720 | GLB1 | A014-C-008 | Human | Colorectum | FAP | 1.26e-02 | -1.80e-01 | -0.191 |
| 2720 | GLB1 | A018-E-020 | Human | Colorectum | FAP | 3.65e-03 | -8.61e-02 | -0.2034 |
| 2720 | GLB1 | CRC-3-11773 | Human | Colorectum | CRC | 1.52e-02 | -6.37e-02 | 0.2564 |
| 2720 | GLB1 | LZE4T | Human | Esophagus | ESCC | 4.67e-04 | 2.13e-01 | 0.0811 |
| Page: 1 2 3 4 5 6 7 |
| Tissue | Expression Dynamics | Abbreviation |
| Colorectum (GSE201348) | 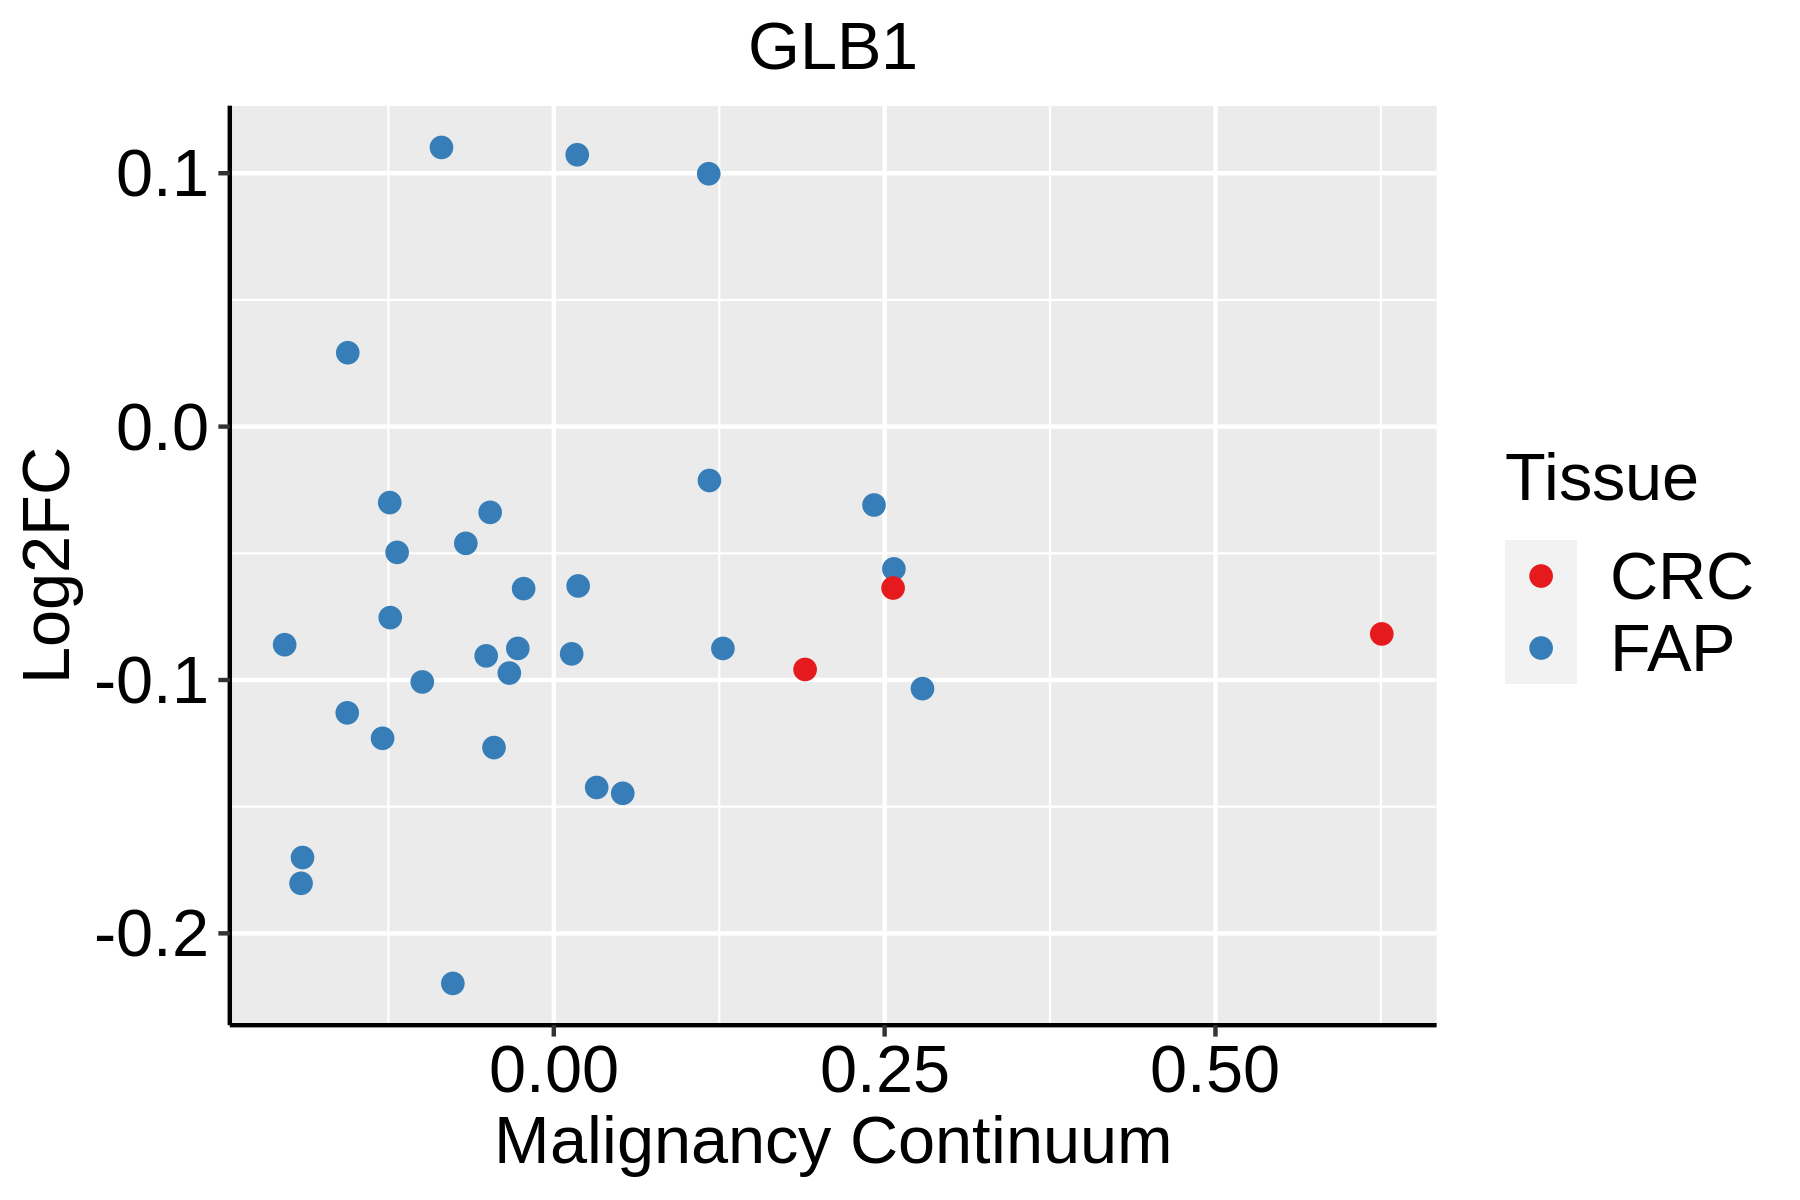 | FAP: Familial adenomatous polyposis |
| CRC: Colorectal cancer | ||
| Colorectum (HTA11) |  | AD: Adenomas |
| SER: Sessile serrated lesions | ||
| MSI-H: Microsatellite-high colorectal cancer | ||
| MSS: Microsatellite stable colorectal cancer | ||
| Esophagus | 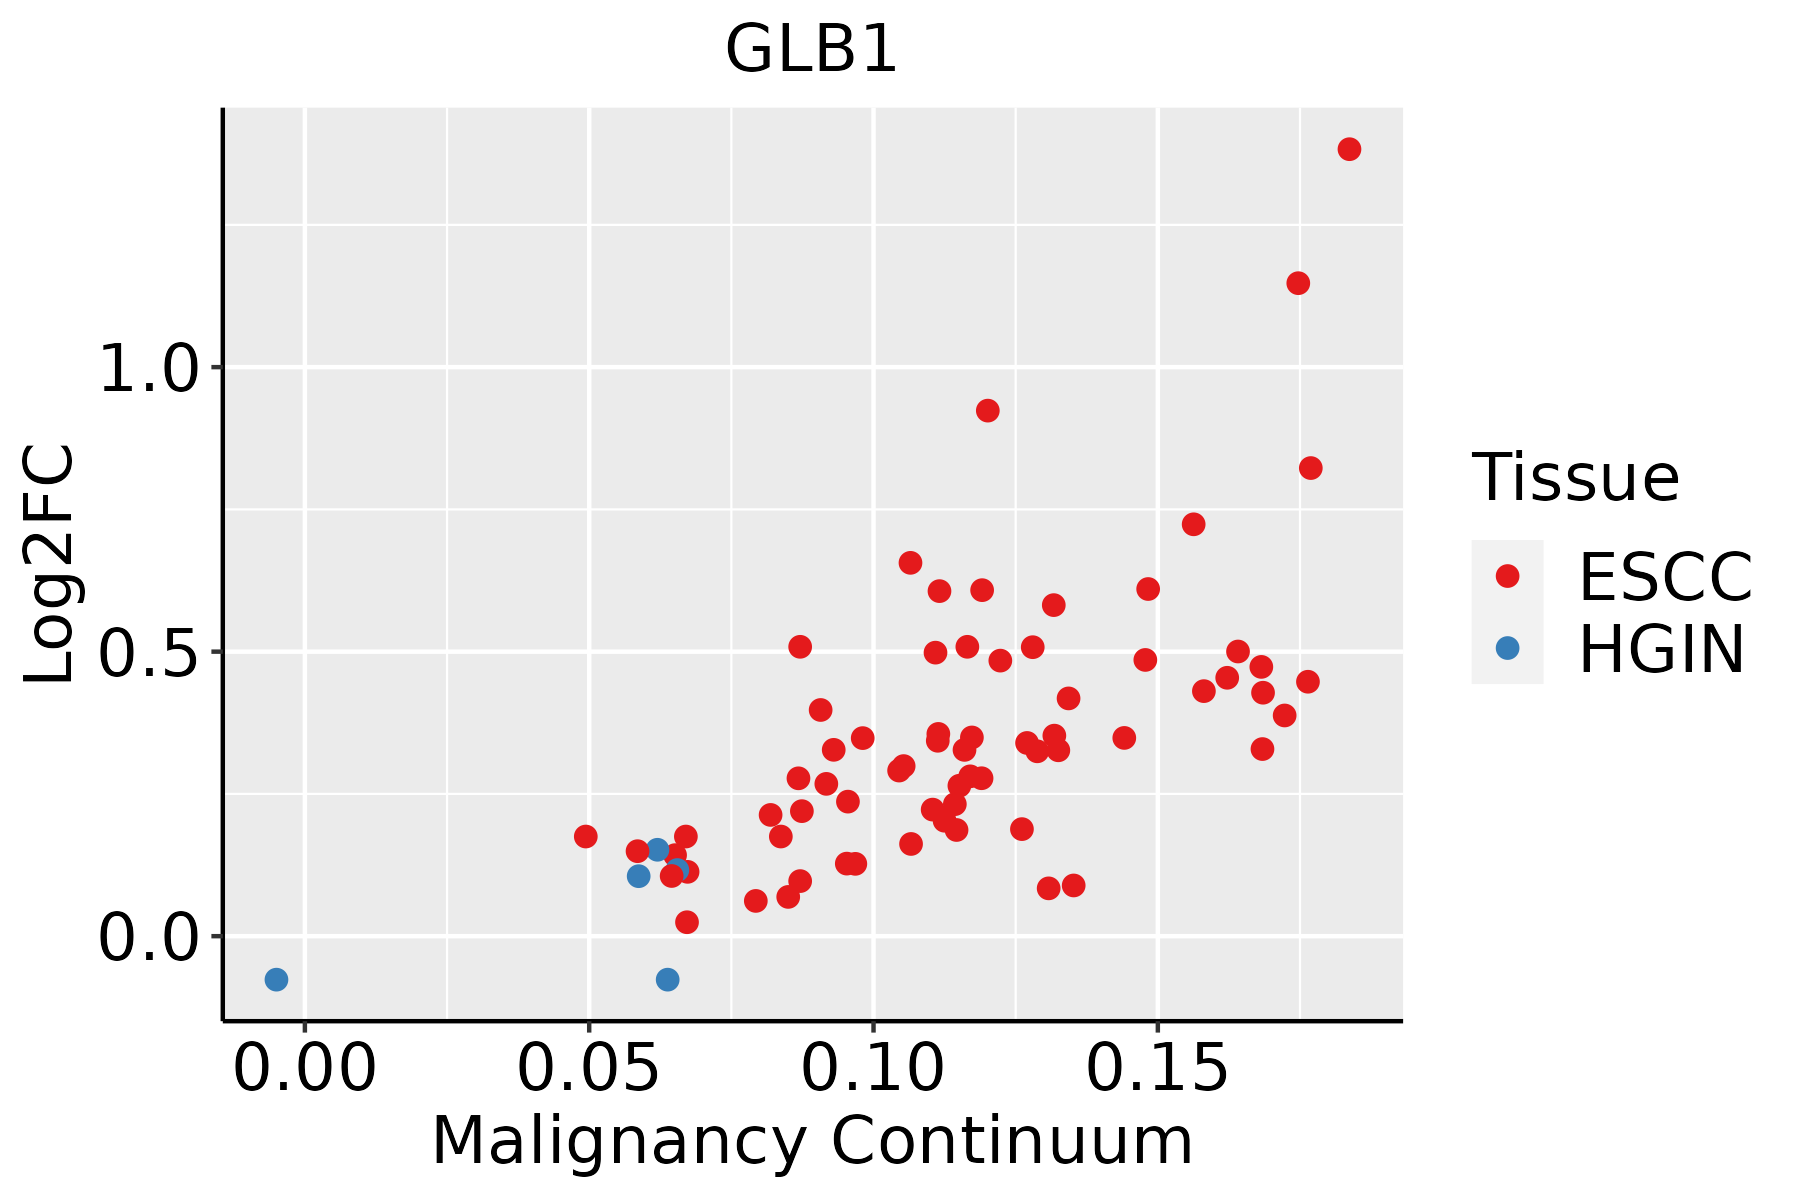 | ESCC: Esophageal squamous cell carcinoma |
| HGIN: High-grade intraepithelial neoplasias | ||
| LGIN: Low-grade intraepithelial neoplasias | ||
| Liver | 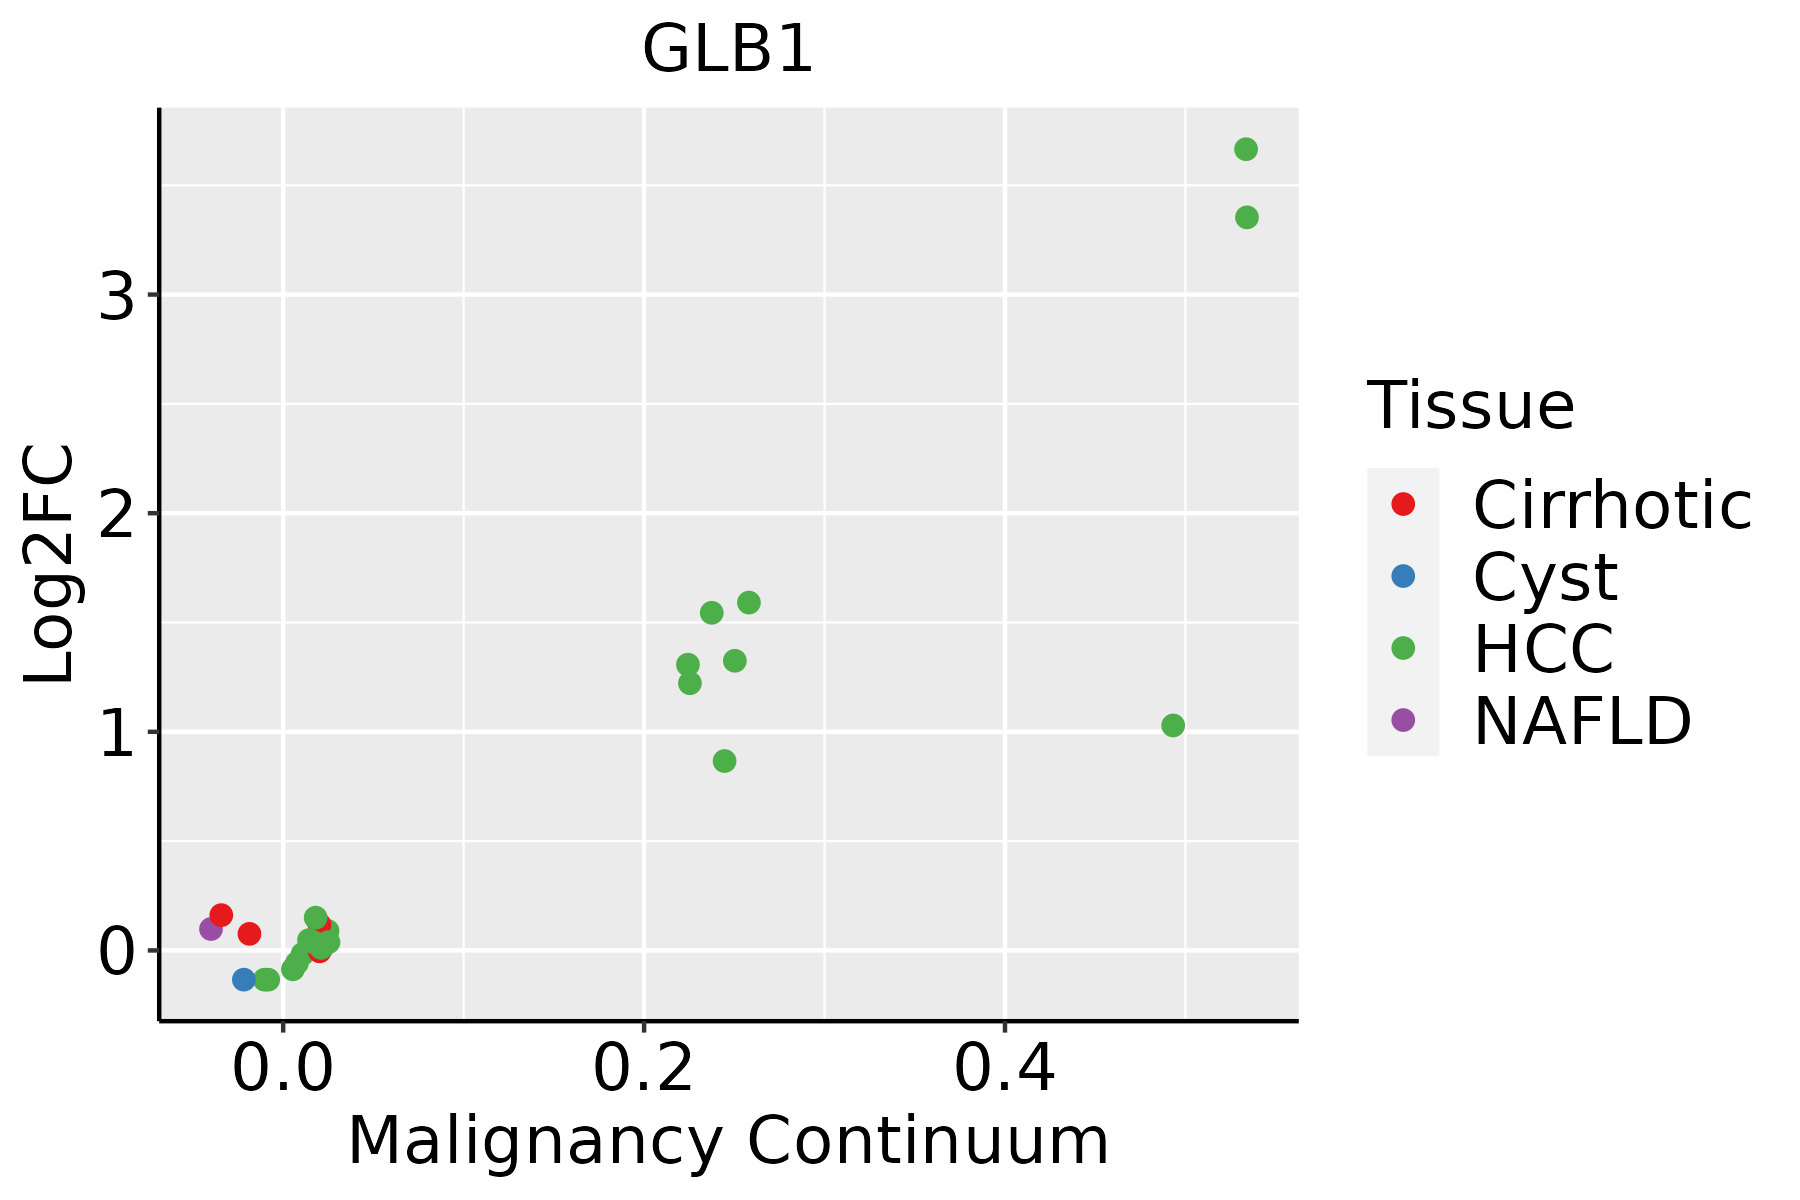 | HCC: Hepatocellular carcinoma |
| NAFLD: Non-alcoholic fatty liver disease | ||
| Oral Cavity |  | EOLP: Erosive Oral lichen planus |
| LP: leukoplakia | ||
| NEOLP: Non-erosive oral lichen planus | ||
| OSCC: Oral squamous cell carcinoma | ||
| Skin | 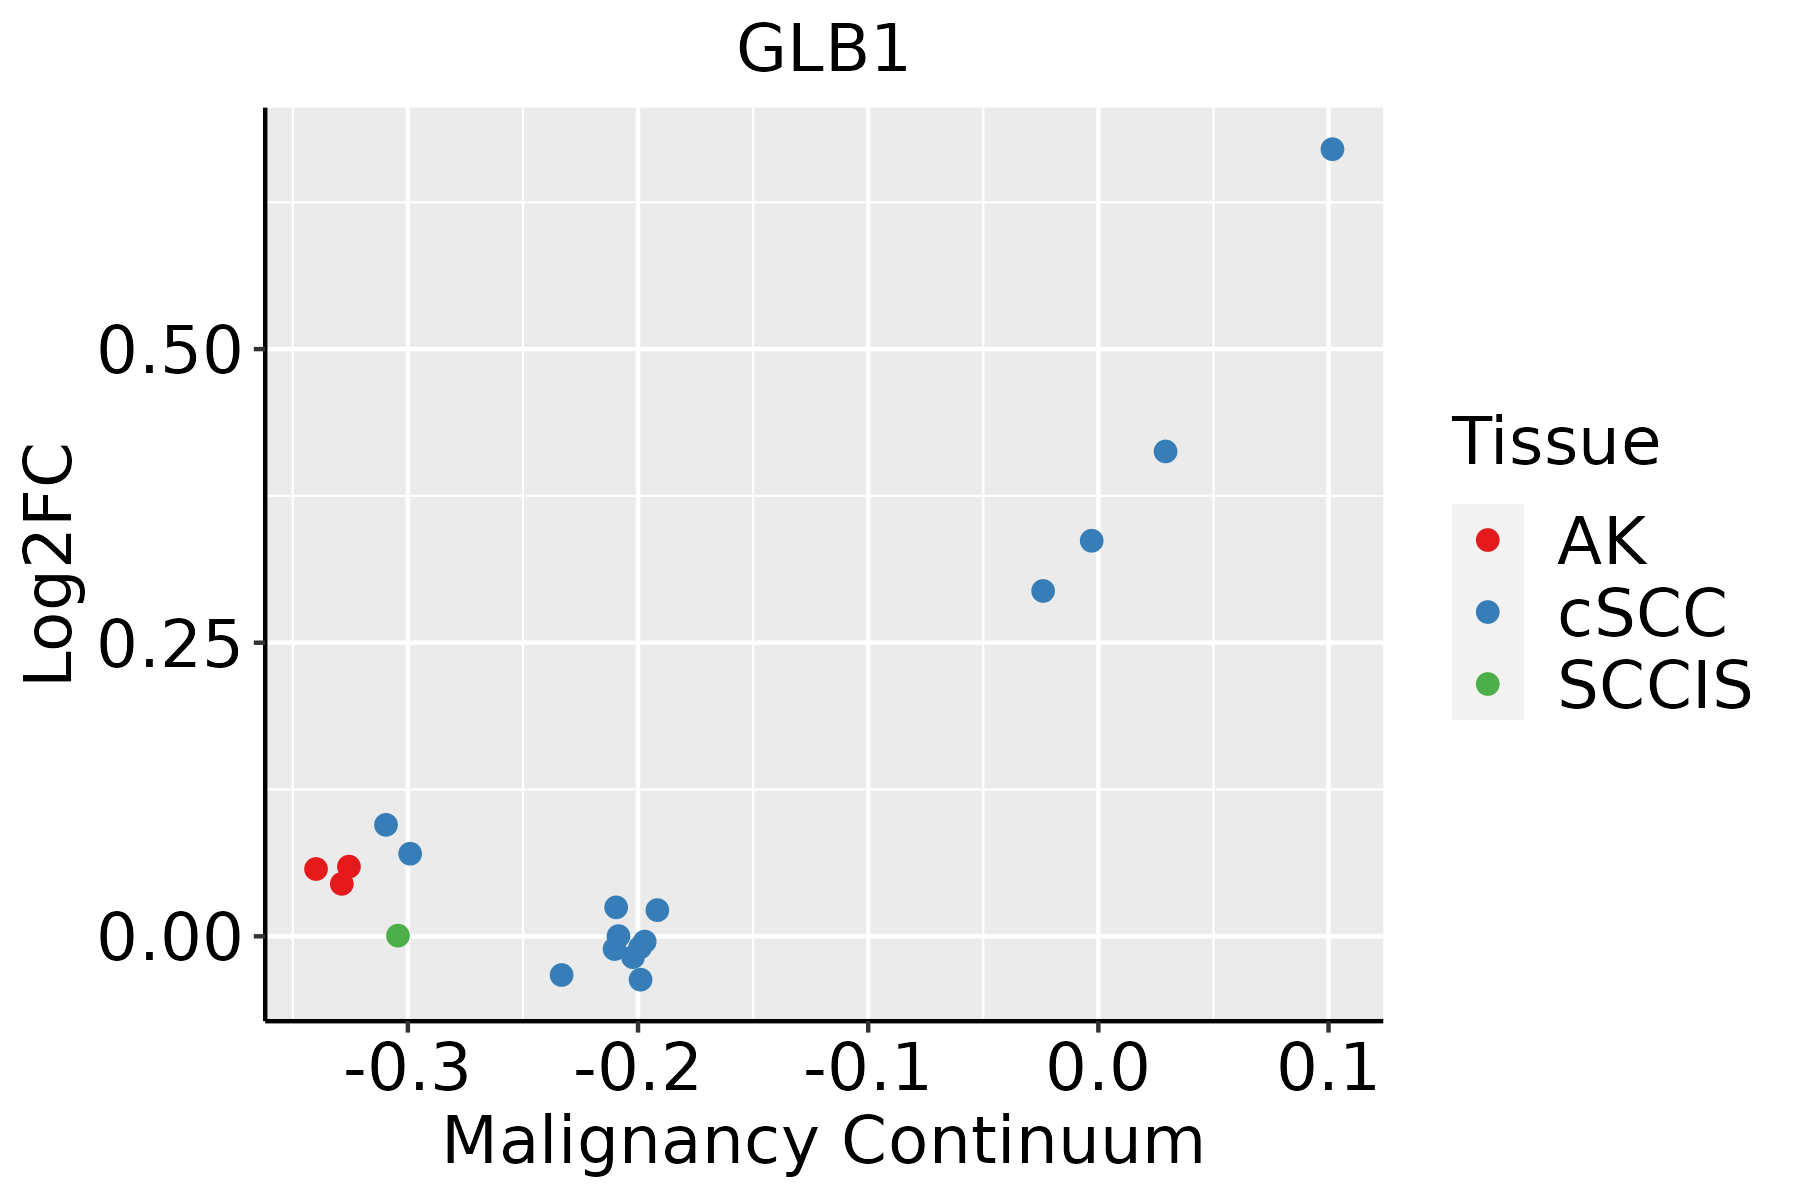 | AK: Actinic keratosis |
| cSCC: Cutaneous squamous cell carcinoma | ||
| SCCIS:squamous cell carcinoma in situ | ||
| Thyroid | 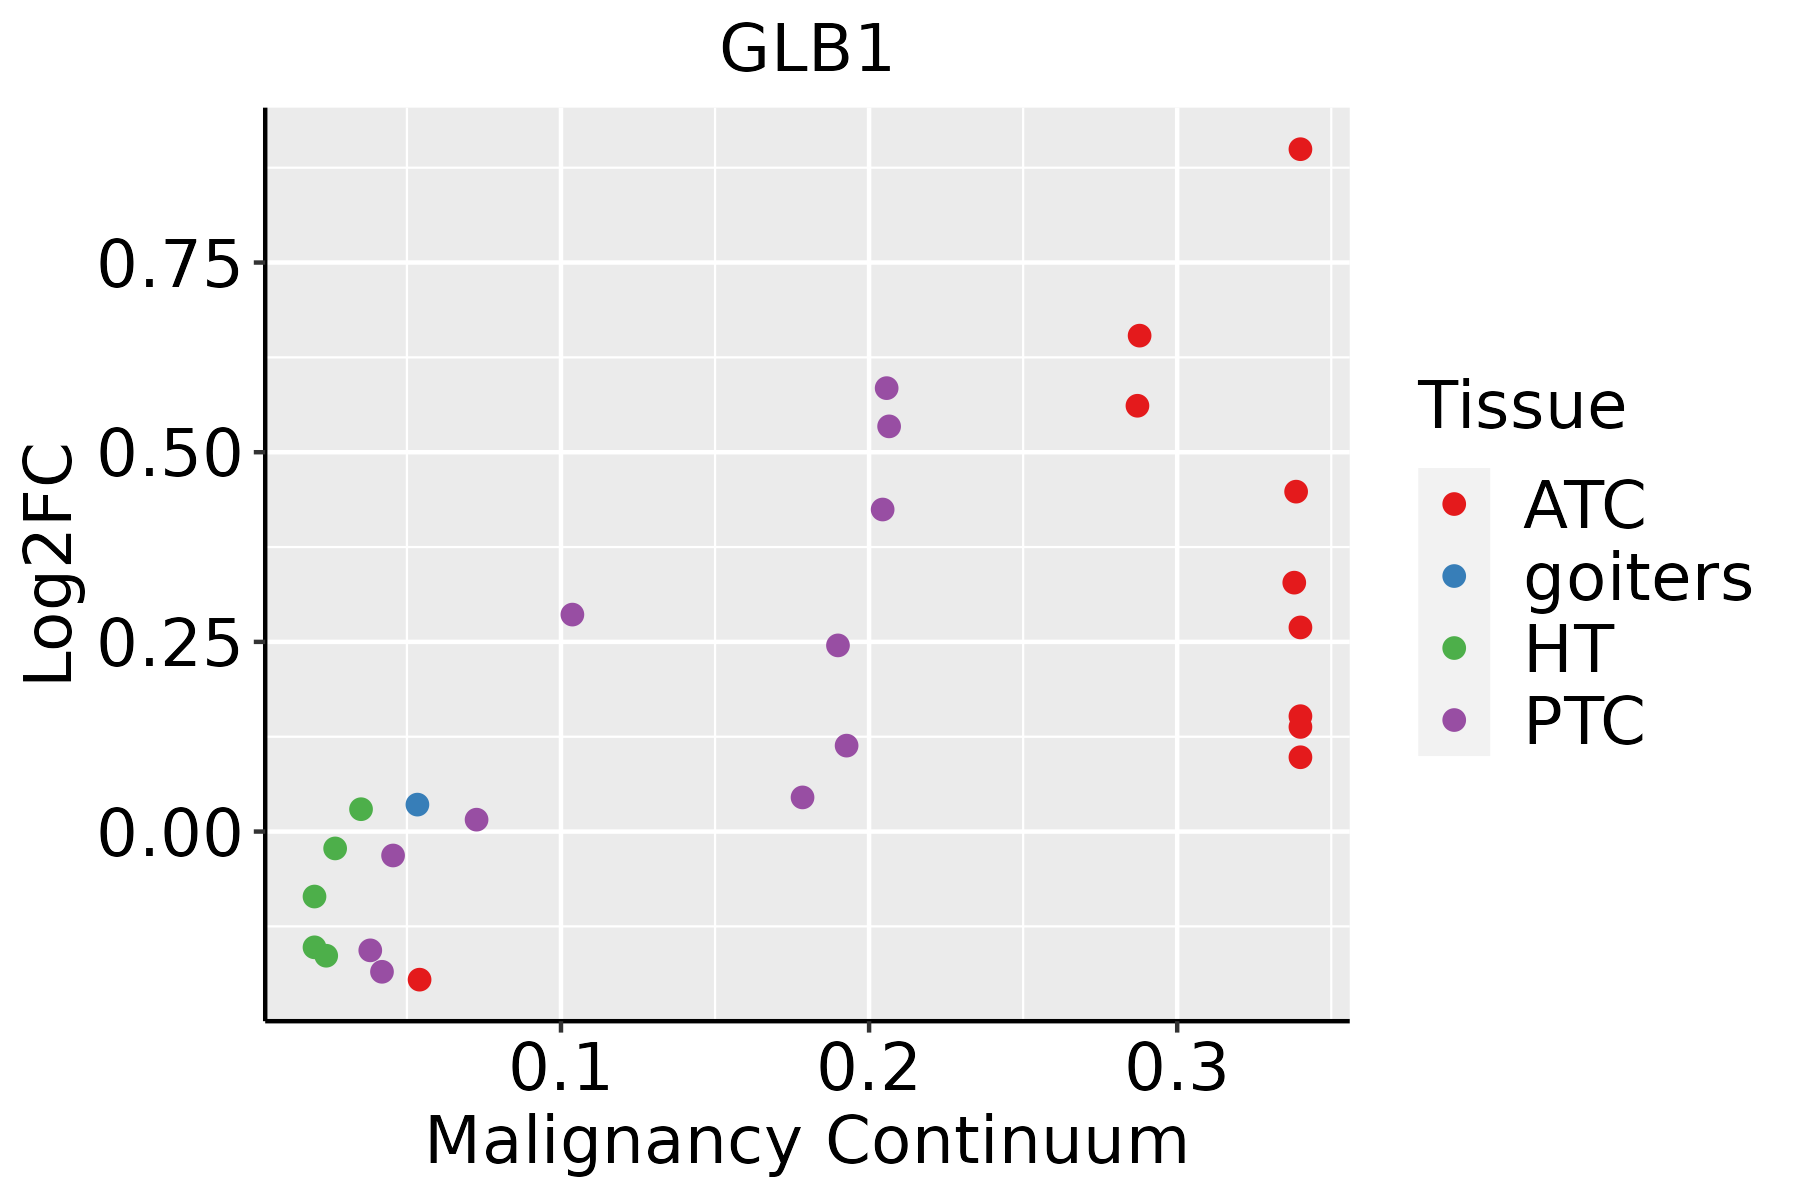 | ATC: Anaplastic thyroid cancer |
| HT: Hashimoto's thyroiditis | ||
| PTC: Papillary thyroid cancer |
| ∗log2FC in expression of this searched gene in stem-like cells from each diseased tissue sample relative to stem-like cells in normal samples in each tissue plotted against the malignancy continuum. Samples are colored based on if they are from different disease stage. |
Top |
Malignant transformation related pathway analysis |
| Find out the enriched GO biological processes and KEGG pathways involved in transition from healthy to precancer to cancer |
| Tissue | Disease Stage | Enriched GO biological Processes |
| Cervix | N_HPV |  |
| Endometrium | AEH |  |
| Endometrium | EEC |  |
| Prostate | BPH |  |
| Prostate | Tumor |  |
| ∗Top 15 enriched GO BP terms are showed in the bar plot of each disease state in each tissue. Each row represents a significant GO biological process which is colored according to the -log10(p.adjust). |
| Page: 1 2 3 4 5 6 7 8 9 |
| GO ID | Tissue | Disease Stage | Description | Gene Ratio | Bg Ratio | pvalue | p.adjust | Count |
| GO:0044282 | Colorectum | AD | small molecule catabolic process | 118/3918 | 376/18723 | 1.05e-06 | 3.55e-05 | 118 |
| GO:0016052 | Colorectum | AD | carbohydrate catabolic process | 56/3918 | 154/18723 | 7.01e-06 | 1.73e-04 | 56 |
| GO:0048545 | Colorectum | AD | response to steroid hormone | 104/3918 | 339/18723 | 1.33e-05 | 2.90e-04 | 104 |
| GO:0019318 | Colorectum | AD | hexose metabolic process | 77/3918 | 237/18723 | 1.96e-05 | 4.01e-04 | 77 |
| GO:0044262 | Colorectum | AD | cellular carbohydrate metabolic process | 87/3918 | 283/18723 | 6.00e-05 | 1.01e-03 | 87 |
| GO:0006790 | Colorectum | AD | sulfur compound metabolic process | 101/3918 | 339/18723 | 6.46e-05 | 1.07e-03 | 101 |
| GO:0005996 | Colorectum | AD | monosaccharide metabolic process | 80/3918 | 257/18723 | 7.31e-05 | 1.17e-03 | 80 |
| GO:1901654 | Colorectum | AD | response to ketone | 59/3918 | 194/18723 | 1.14e-03 | 1.04e-02 | 59 |
| GO:0097305 | Colorectum | AD | response to alcohol | 71/3918 | 253/18723 | 4.01e-03 | 2.80e-02 | 71 |
| GO:0019320 | Colorectum | AD | hexose catabolic process | 14/3918 | 34/18723 | 5.86e-03 | 3.69e-02 | 14 |
| GO:0006012 | Colorectum | AD | galactose metabolic process | 6/3918 | 10/18723 | 8.03e-03 | 4.73e-02 | 6 |
| GO:00485452 | Colorectum | MSS | response to steroid hormone | 101/3467 | 339/18723 | 2.60e-07 | 1.10e-05 | 101 |
| GO:19016542 | Colorectum | MSS | response to ketone | 58/3467 | 194/18723 | 7.70e-05 | 1.28e-03 | 58 |
| GO:00160522 | Colorectum | MSS | carbohydrate catabolic process | 45/3467 | 154/18723 | 7.93e-04 | 8.36e-03 | 45 |
| GO:00442822 | Colorectum | MSS | small molecule catabolic process | 94/3467 | 376/18723 | 9.85e-04 | 9.86e-03 | 94 |
| GO:00193182 | Colorectum | MSS | hexose metabolic process | 63/3467 | 237/18723 | 1.32e-03 | 1.25e-02 | 63 |
| GO:00067902 | Colorectum | MSS | sulfur compound metabolic process | 85/3467 | 339/18723 | 1.52e-03 | 1.39e-02 | 85 |
| GO:00973051 | Colorectum | MSS | response to alcohol | 66/3467 | 253/18723 | 1.73e-03 | 1.54e-02 | 66 |
| GO:00059962 | Colorectum | MSS | monosaccharide metabolic process | 66/3467 | 257/18723 | 2.61e-03 | 2.06e-02 | 66 |
| GO:00060121 | Colorectum | MSS | galactose metabolic process | 6/3467 | 10/18723 | 4.25e-03 | 3.04e-02 | 6 |
| Page: 1 2 3 4 5 6 7 8 9 10 11 12 13 14 15 16 17 18 19 20 21 22 23 24 25 26 27 28 29 30 31 32 33 34 35 36 37 |
| Pathway ID | Tissue | Disease Stage | Description | Gene Ratio | Bg Ratio | pvalue | p.adjust | qvalue | Count |
| hsa00052 | Colorectum | FAP | Galactose metabolism | 12/1404 | 32/8465 | 3.61e-03 | 1.53e-02 | 9.29e-03 | 12 |
| hsa000521 | Colorectum | FAP | Galactose metabolism | 12/1404 | 32/8465 | 3.61e-03 | 1.53e-02 | 9.29e-03 | 12 |
| hsa0414222 | Esophagus | ESCC | Lysosome | 102/4205 | 132/8465 | 5.11e-11 | 7.13e-10 | 3.65e-10 | 102 |
| hsa006003 | Esophagus | ESCC | Sphingolipid metabolism | 36/4205 | 53/8465 | 5.41e-03 | 1.36e-02 | 6.99e-03 | 36 |
| hsa0414232 | Esophagus | ESCC | Lysosome | 102/4205 | 132/8465 | 5.11e-11 | 7.13e-10 | 3.65e-10 | 102 |
| hsa0060012 | Esophagus | ESCC | Sphingolipid metabolism | 36/4205 | 53/8465 | 5.41e-03 | 1.36e-02 | 6.99e-03 | 36 |
| hsa041424 | Liver | Cirrhotic | Lysosome | 68/2530 | 132/8465 | 1.34e-07 | 1.97e-06 | 1.21e-06 | 68 |
| hsa0414211 | Liver | Cirrhotic | Lysosome | 68/2530 | 132/8465 | 1.34e-07 | 1.97e-06 | 1.21e-06 | 68 |
| hsa041422 | Liver | HCC | Lysosome | 100/4020 | 132/8465 | 2.32e-11 | 4.31e-10 | 2.40e-10 | 100 |
| hsa00511 | Liver | HCC | Other glycan degradation | 15/4020 | 18/8465 | 1.96e-03 | 6.91e-03 | 3.84e-03 | 15 |
| hsa00600 | Liver | HCC | Sphingolipid metabolism | 34/4020 | 53/8465 | 1.06e-02 | 2.71e-02 | 1.51e-02 | 34 |
| hsa041423 | Liver | HCC | Lysosome | 100/4020 | 132/8465 | 2.32e-11 | 4.31e-10 | 2.40e-10 | 100 |
| hsa005111 | Liver | HCC | Other glycan degradation | 15/4020 | 18/8465 | 1.96e-03 | 6.91e-03 | 3.84e-03 | 15 |
| hsa006001 | Liver | HCC | Sphingolipid metabolism | 34/4020 | 53/8465 | 1.06e-02 | 2.71e-02 | 1.51e-02 | 34 |
| hsa041425 | Oral cavity | OSCC | Lysosome | 87/3704 | 132/8465 | 1.97e-07 | 1.35e-06 | 6.86e-07 | 87 |
| hsa006002 | Oral cavity | OSCC | Sphingolipid metabolism | 33/3704 | 53/8465 | 5.00e-03 | 1.20e-02 | 6.13e-03 | 33 |
| hsa0414212 | Oral cavity | OSCC | Lysosome | 87/3704 | 132/8465 | 1.97e-07 | 1.35e-06 | 6.86e-07 | 87 |
| hsa0060011 | Oral cavity | OSCC | Sphingolipid metabolism | 33/3704 | 53/8465 | 5.00e-03 | 1.20e-02 | 6.13e-03 | 33 |
| Page: 1 |
Top |
Cell-cell communication analysis |
| Identification of potential cell-cell interactions between two cell types and their ligand-receptor pairs for different disease states |
| Ligand | Receptor | LRpair | Pathway | Tissue | Disease Stage |
| Page: 1 |
Top |
Single-cell gene regulatory network inference analysis |
| Find out the significant the regulons (TFs) and the target genes of each regulon across cell types for different disease states |
| TF | Cell Type | Tissue | Disease Stage | Target Gene | RSS | Regulon Activity |
| ∗The dot plots of a searched regulon are shown for all cell subpopulations in each disease state of each tissue based on the regulon specific score inferred using pySCENIC and by calculating the average expression. |
| Page: 1 |
Top |
Somatic mutation of malignant transformation related genes |
| Annotation of somatic variants for genes involved in malignant transformation |
| Hugo Symbol | Variant Class | Variant Classification | dbSNP RS | HGVSc | HGVSp | HGVSp Short | SWISSPROT | BIOTYPE | SIFT | PolyPhen | Tumor Sample Barcode | Tissue | Histology | Sex | Age | Stage | Therapy Types | Drugs | Outcome |
| GLB1 | SNV | Missense_Mutation | c.1336N>C | p.Ala446Pro | p.A446P | P16278 | protein_coding | tolerated(0.2) | possibly_damaging(0.897) | TCGA-BH-A0HP-01 | Breast | breast invasive carcinoma | Female | >=65 | III/IV | Chemotherapy | doxorubicin | SD | |
| GLB1 | SNV | Missense_Mutation | novel | c.302N>G | p.Asp101Gly | p.D101G | P16278 | protein_coding | tolerated(0.07) | possibly_damaging(0.863) | TCGA-E9-A245-01 | Breast | breast invasive carcinoma | Female | <65 | I/II | Hormone Therapy | tamoxiphen | SD |
| GLB1 | SNV | Missense_Mutation | c.1628N>T | p.Ser543Leu | p.S543L | P16278 | protein_coding | tolerated(0.14) | possibly_damaging(0.543) | TCGA-GM-A2DF-01 | Breast | breast invasive carcinoma | Female | <65 | I/II | Chemotherapy | taxol | CR | |
| GLB1 | SNV | Missense_Mutation | c.592N>C | p.Asp198His | p.D198H | P16278 | protein_coding | deleterious(0.05) | possibly_damaging(0.9) | TCGA-LL-A5YO-01 | Breast | breast invasive carcinoma | Female | <65 | I/II | Chemotherapy | taxotere | CR | |
| GLB1 | insertion | Frame_Shift_Ins | novel | c.1526_1527insCG | p.Trp509CysfsTer92 | p.W509Cfs*92 | P16278 | protein_coding | TCGA-A2-A0CQ-01 | Breast | breast invasive carcinoma | Female | <65 | I/II | Chemotherapy | adriamycin | SD | ||
| GLB1 | insertion | Frame_Shift_Ins | novel | c.1524_1525insATGGGGGAAAGGGAATCTTCCCACAT | p.Trp509MetfsTer100 | p.W509Mfs*100 | P16278 | protein_coding | TCGA-A2-A0CQ-01 | Breast | breast invasive carcinoma | Female | <65 | I/II | Chemotherapy | adriamycin | SD | ||
| GLB1 | insertion | Frame_Shift_Ins | novel | c.1909_1910insGTGTACATAGTATGGTATATCT | p.Thr637SerfsTer29 | p.T637Sfs*29 | P16278 | protein_coding | TCGA-BH-A0H7-01 | Breast | breast invasive carcinoma | Female | >=65 | III/IV | Chemotherapy | doxorubicin | SD | ||
| GLB1 | deletion | Frame_Shift_Del | novel | c.237delN | p.Ile80SerfsTer41 | p.I80Sfs*41 | P16278 | protein_coding | TCGA-D8-A27V-01 | Breast | breast invasive carcinoma | Female | <65 | I/II | Hormone Therapy | tamoxiphen | SD | ||
| GLB1 | SNV | Missense_Mutation | novel | c.790N>A | p.Leu264Met | p.L264M | P16278 | protein_coding | deleterious(0.01) | probably_damaging(0.998) | TCGA-EA-A3Y4-01 | Cervix | cervical & endocervical cancer | Female | <65 | I/II | Unknown | Unknown | SD |
| GLB1 | SNV | Missense_Mutation | c.423N>T | p.Glu141Asp | p.E141D | P16278 | protein_coding | tolerated(0.18) | benign(0.006) | TCGA-FU-A3HZ-01 | Cervix | cervical & endocervical cancer | Female | <65 | I/II | Chemotherapy | cisplatin | CR |
| Page: 1 2 3 4 5 6 7 |
Top |
Related drugs of malignant transformation related genes |
| Identification of chemicals and drugs interact with genes involved in malignant transfromation |
| (DGIdb 4.0) |
| Entrez ID | Symbol | Category | Interaction Types | Drug Claim Name | Drug Name | PMIDs |
| Page: 1 |

Copyright 2023-Present -The University of Texas Health Science Center at Houston |