
|
|||||
|
 | |
| |
| |
| |
| |
| |
|
Gene: DDIT3 |
Gene summary for DDIT3 |
| Gene information | Species | Human | Gene symbol | DDIT3 | Gene ID | 1649 |
| Gene name | DNA damage inducible transcript 3 | |
| Gene Alias | AltDDIT3 | |
| Cytomap | 12q13.3 | |
| Gene Type | protein-coding | GO ID | GO:0000122 | UniProtAcc | P35638 |
Top |
Malignant transformation analysis |
| Identification of the aberrant gene expression in precancerous and cancerous lesions by comparing the gene expression of stem-like cells in diseased tissues with normal stem cells |
| Entrez ID | Symbol | Replicates | Species | Organ | Tissue | Adj P-value | Log2FC | Malignancy |
| 1649 | DDIT3 | LZE4T | Human | Esophagus | ESCC | 2.20e-15 | 8.83e-01 | 0.0811 |
| 1649 | DDIT3 | LZE7T | Human | Esophagus | ESCC | 1.18e-06 | 7.26e-01 | 0.0667 |
| 1649 | DDIT3 | LZE8T | Human | Esophagus | ESCC | 1.89e-15 | 8.76e-01 | 0.067 |
| 1649 | DDIT3 | LZE20T | Human | Esophagus | ESCC | 5.22e-15 | 1.34e+00 | 0.0662 |
| 1649 | DDIT3 | LZE22D1 | Human | Esophagus | HGIN | 5.69e-06 | 1.64e-01 | 0.0595 |
| 1649 | DDIT3 | LZE22T | Human | Esophagus | ESCC | 2.83e-04 | 8.37e-01 | 0.068 |
| 1649 | DDIT3 | LZE24T | Human | Esophagus | ESCC | 1.41e-32 | 1.90e+00 | 0.0596 |
| 1649 | DDIT3 | LZE21T | Human | Esophagus | ESCC | 4.25e-16 | 1.63e+00 | 0.0655 |
| 1649 | DDIT3 | LZE6T | Human | Esophagus | ESCC | 3.98e-08 | 6.66e-01 | 0.0845 |
| 1649 | DDIT3 | P1T-E | Human | Esophagus | ESCC | 3.40e-18 | 1.42e+00 | 0.0875 |
| 1649 | DDIT3 | P2T-E | Human | Esophagus | ESCC | 1.14e-71 | 1.82e+00 | 0.1177 |
| 1649 | DDIT3 | P4T-E | Human | Esophagus | ESCC | 2.50e-44 | 1.62e+00 | 0.1323 |
| 1649 | DDIT3 | P5T-E | Human | Esophagus | ESCC | 4.06e-42 | 9.86e-01 | 0.1327 |
| 1649 | DDIT3 | P8T-E | Human | Esophagus | ESCC | 4.45e-18 | 3.80e-01 | 0.0889 |
| 1649 | DDIT3 | P9T-E | Human | Esophagus | ESCC | 6.30e-16 | 5.50e-01 | 0.1131 |
| 1649 | DDIT3 | P10T-E | Human | Esophagus | ESCC | 4.58e-14 | 4.19e-01 | 0.116 |
| 1649 | DDIT3 | P11T-E | Human | Esophagus | ESCC | 1.83e-22 | 2.21e+00 | 0.1426 |
| 1649 | DDIT3 | P12T-E | Human | Esophagus | ESCC | 2.73e-68 | 2.13e+00 | 0.1122 |
| 1649 | DDIT3 | P15T-E | Human | Esophagus | ESCC | 6.02e-25 | 8.56e-01 | 0.1149 |
| 1649 | DDIT3 | P16T-E | Human | Esophagus | ESCC | 6.82e-45 | 1.09e+00 | 0.1153 |
| Page: 1 2 3 4 5 6 7 |
| Tissue | Expression Dynamics | Abbreviation |
| Esophagus | 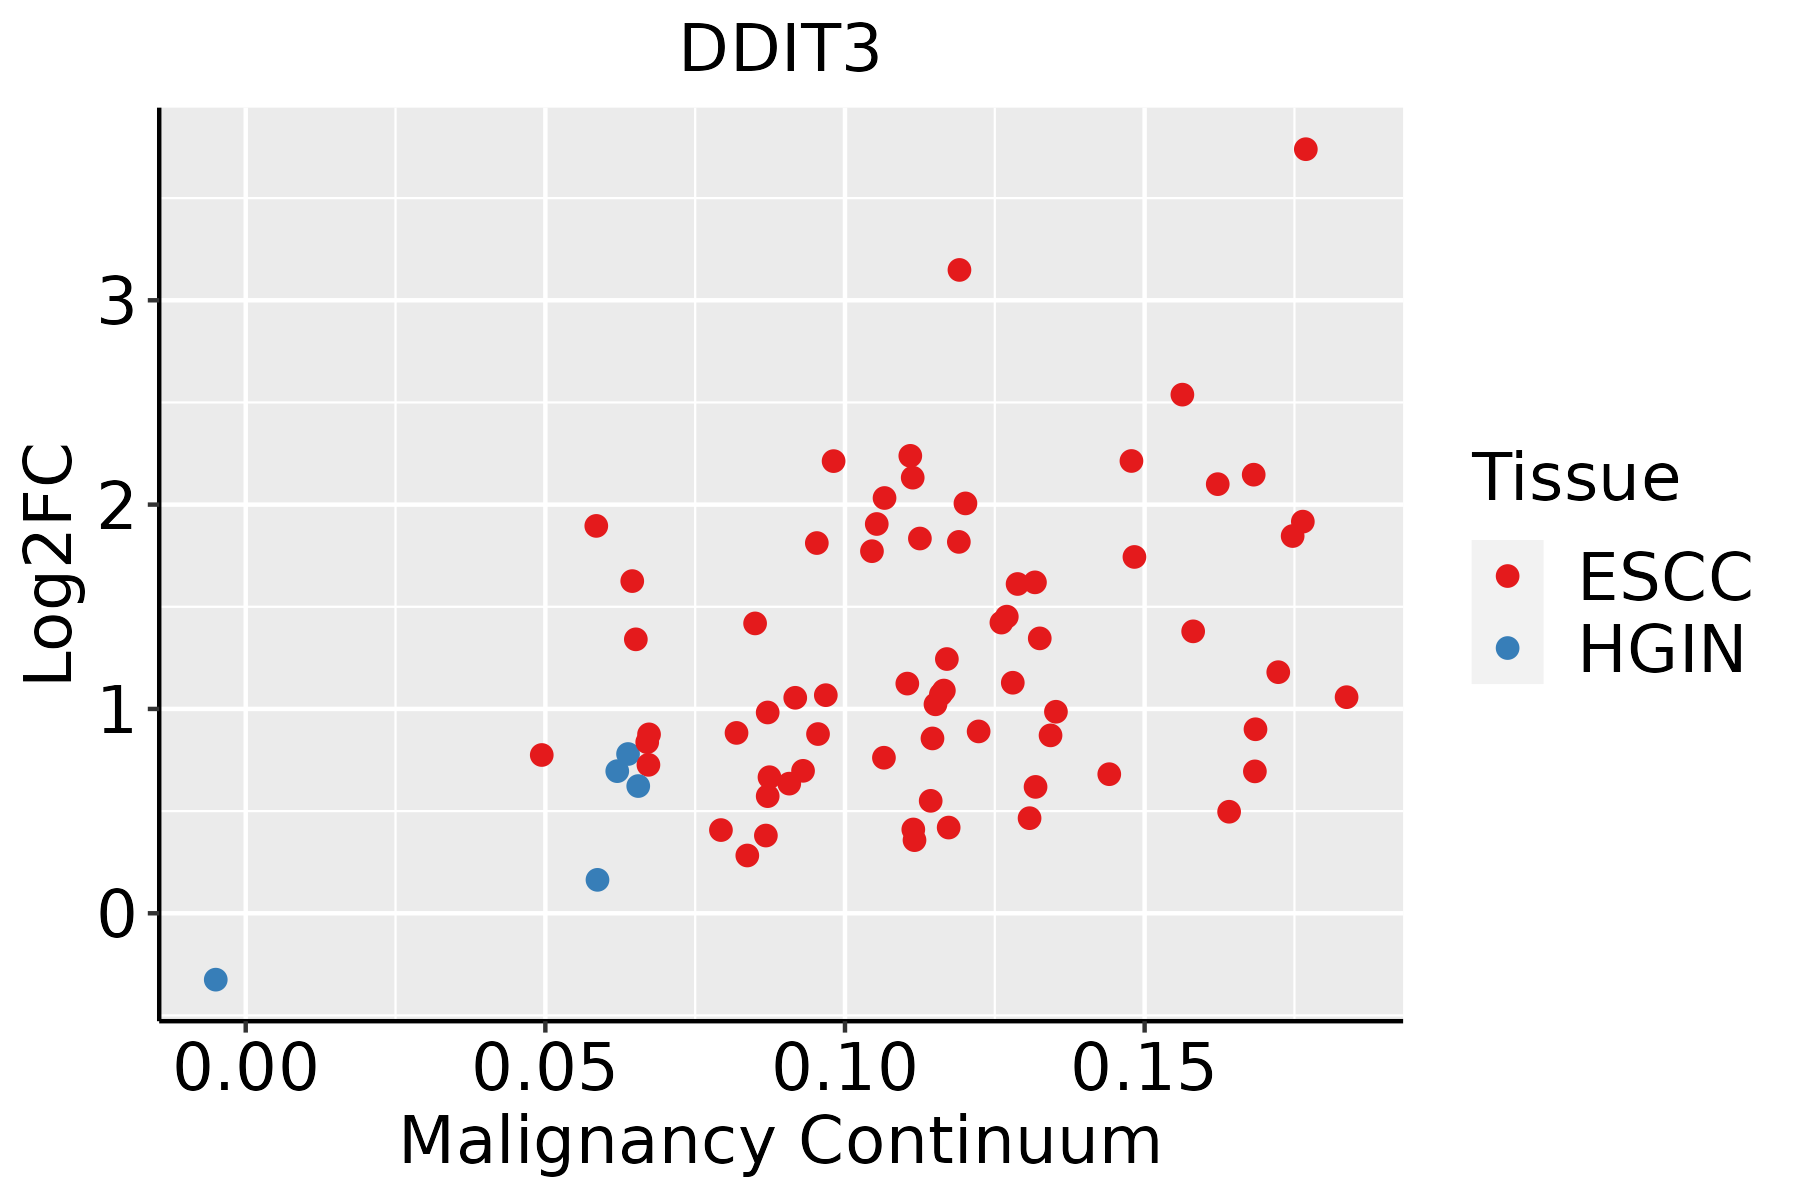 | ESCC: Esophageal squamous cell carcinoma |
| HGIN: High-grade intraepithelial neoplasias | ||
| LGIN: Low-grade intraepithelial neoplasias | ||
| Liver | 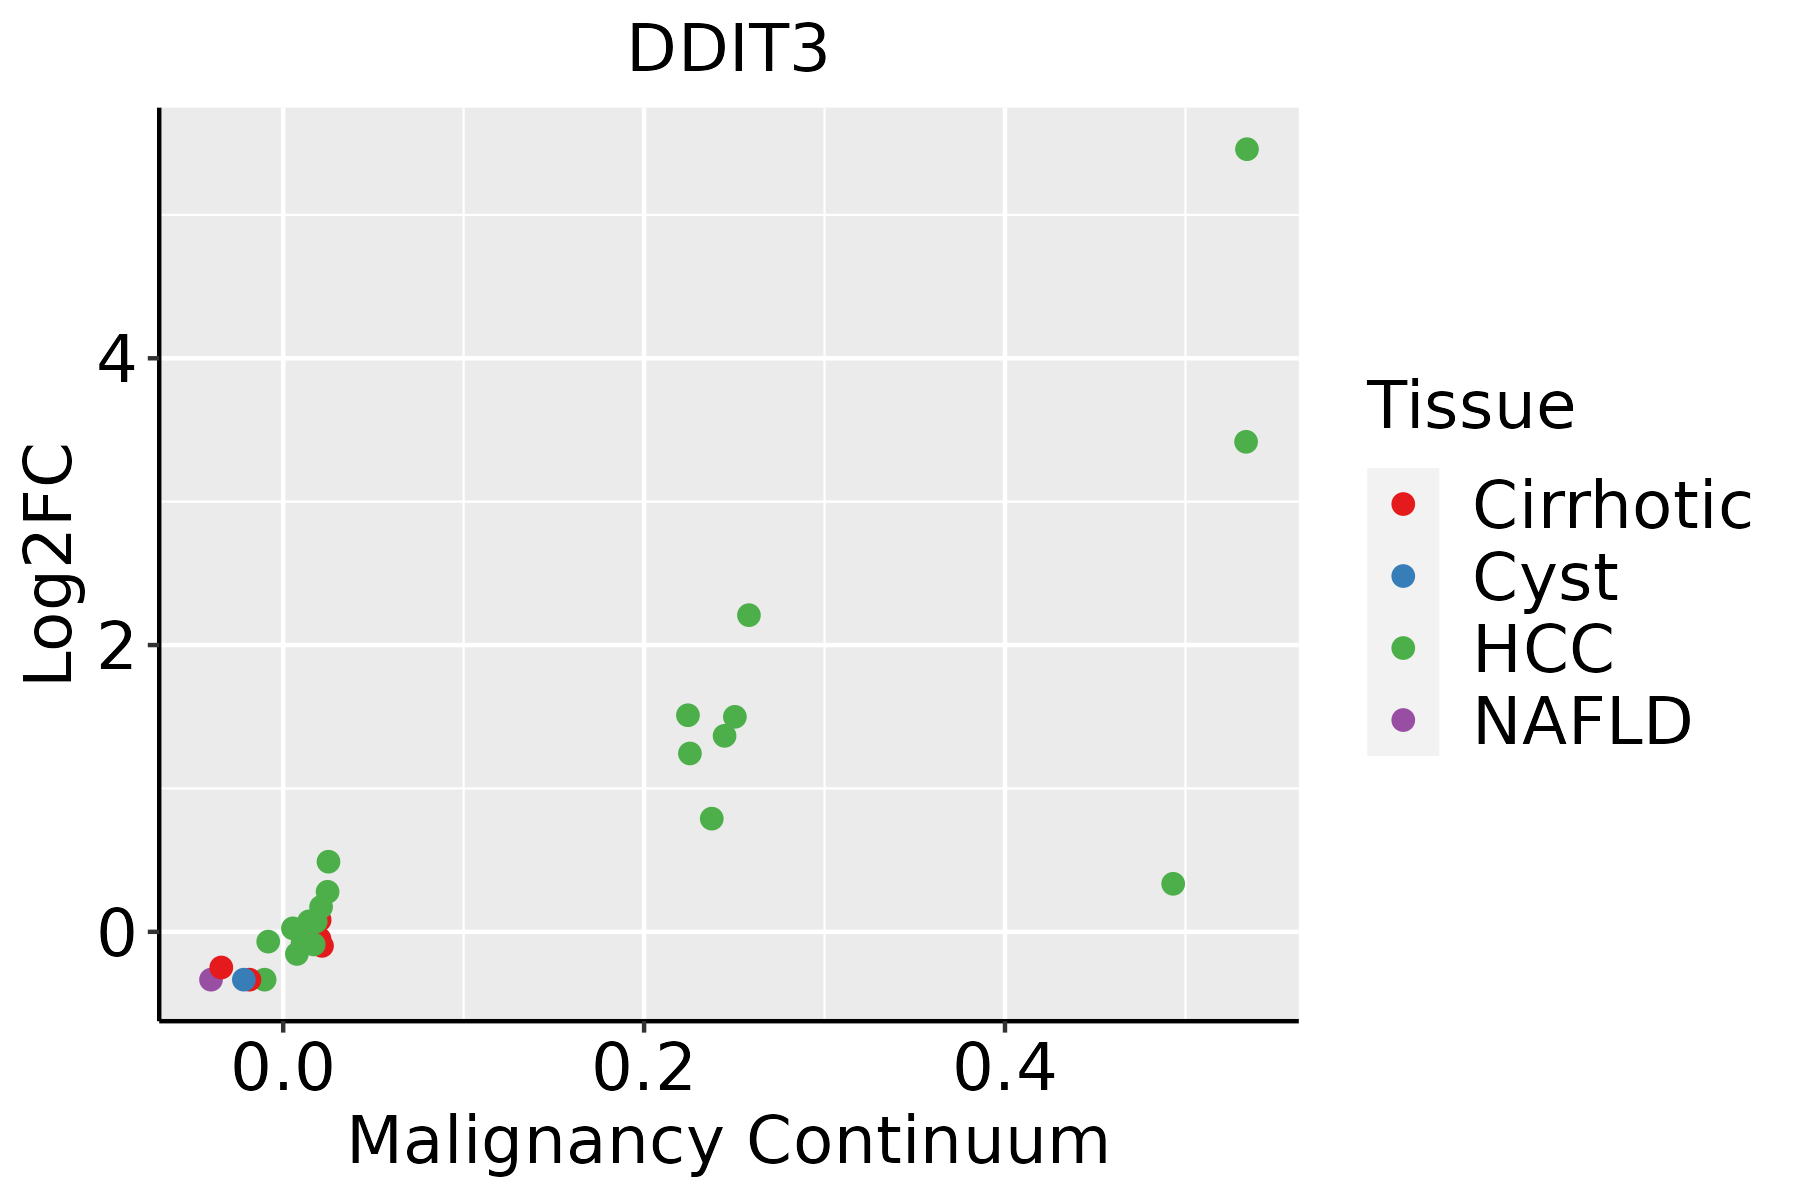 | HCC: Hepatocellular carcinoma |
| NAFLD: Non-alcoholic fatty liver disease | ||
| Oral Cavity | 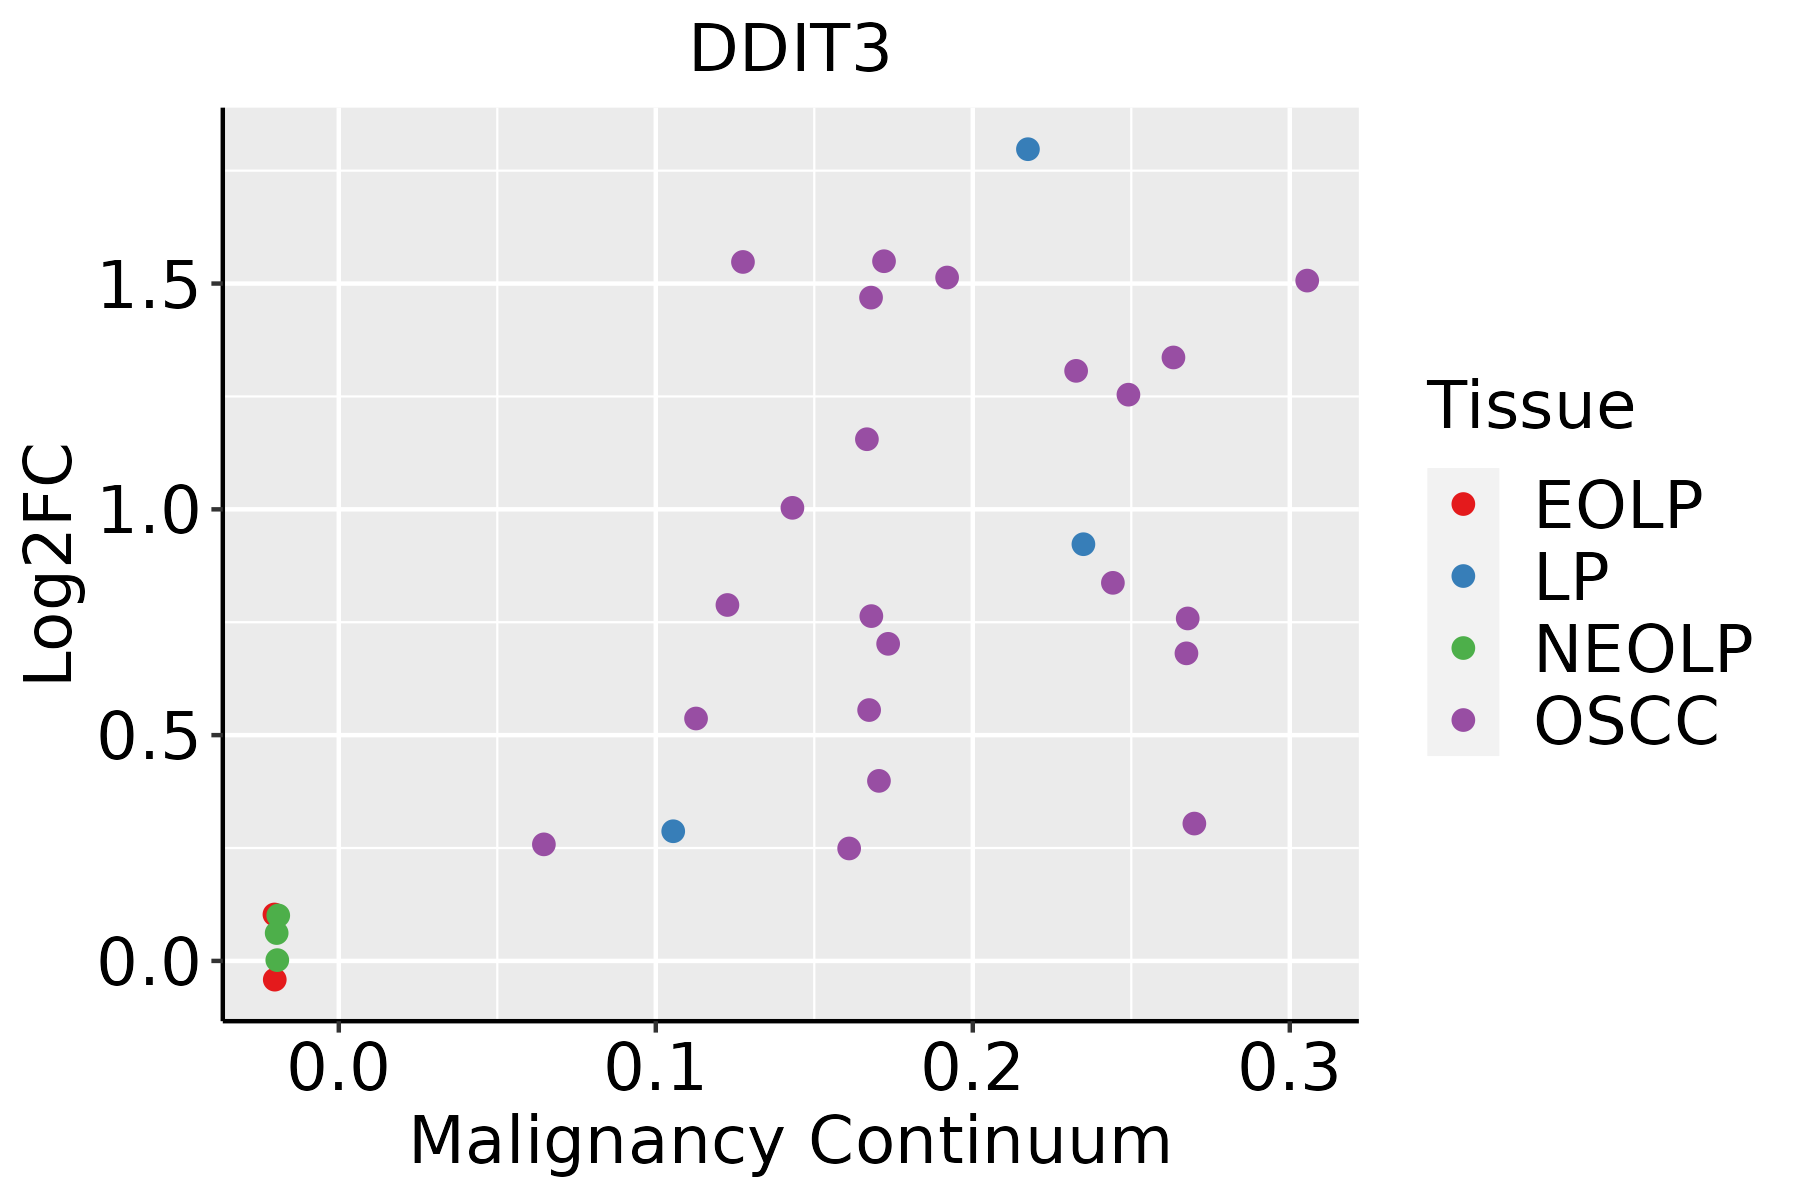 | EOLP: Erosive Oral lichen planus |
| LP: leukoplakia | ||
| NEOLP: Non-erosive oral lichen planus | ||
| OSCC: Oral squamous cell carcinoma | ||
| Prostate |  | BPH: Benign Prostatic Hyperplasia |
| Thyroid | 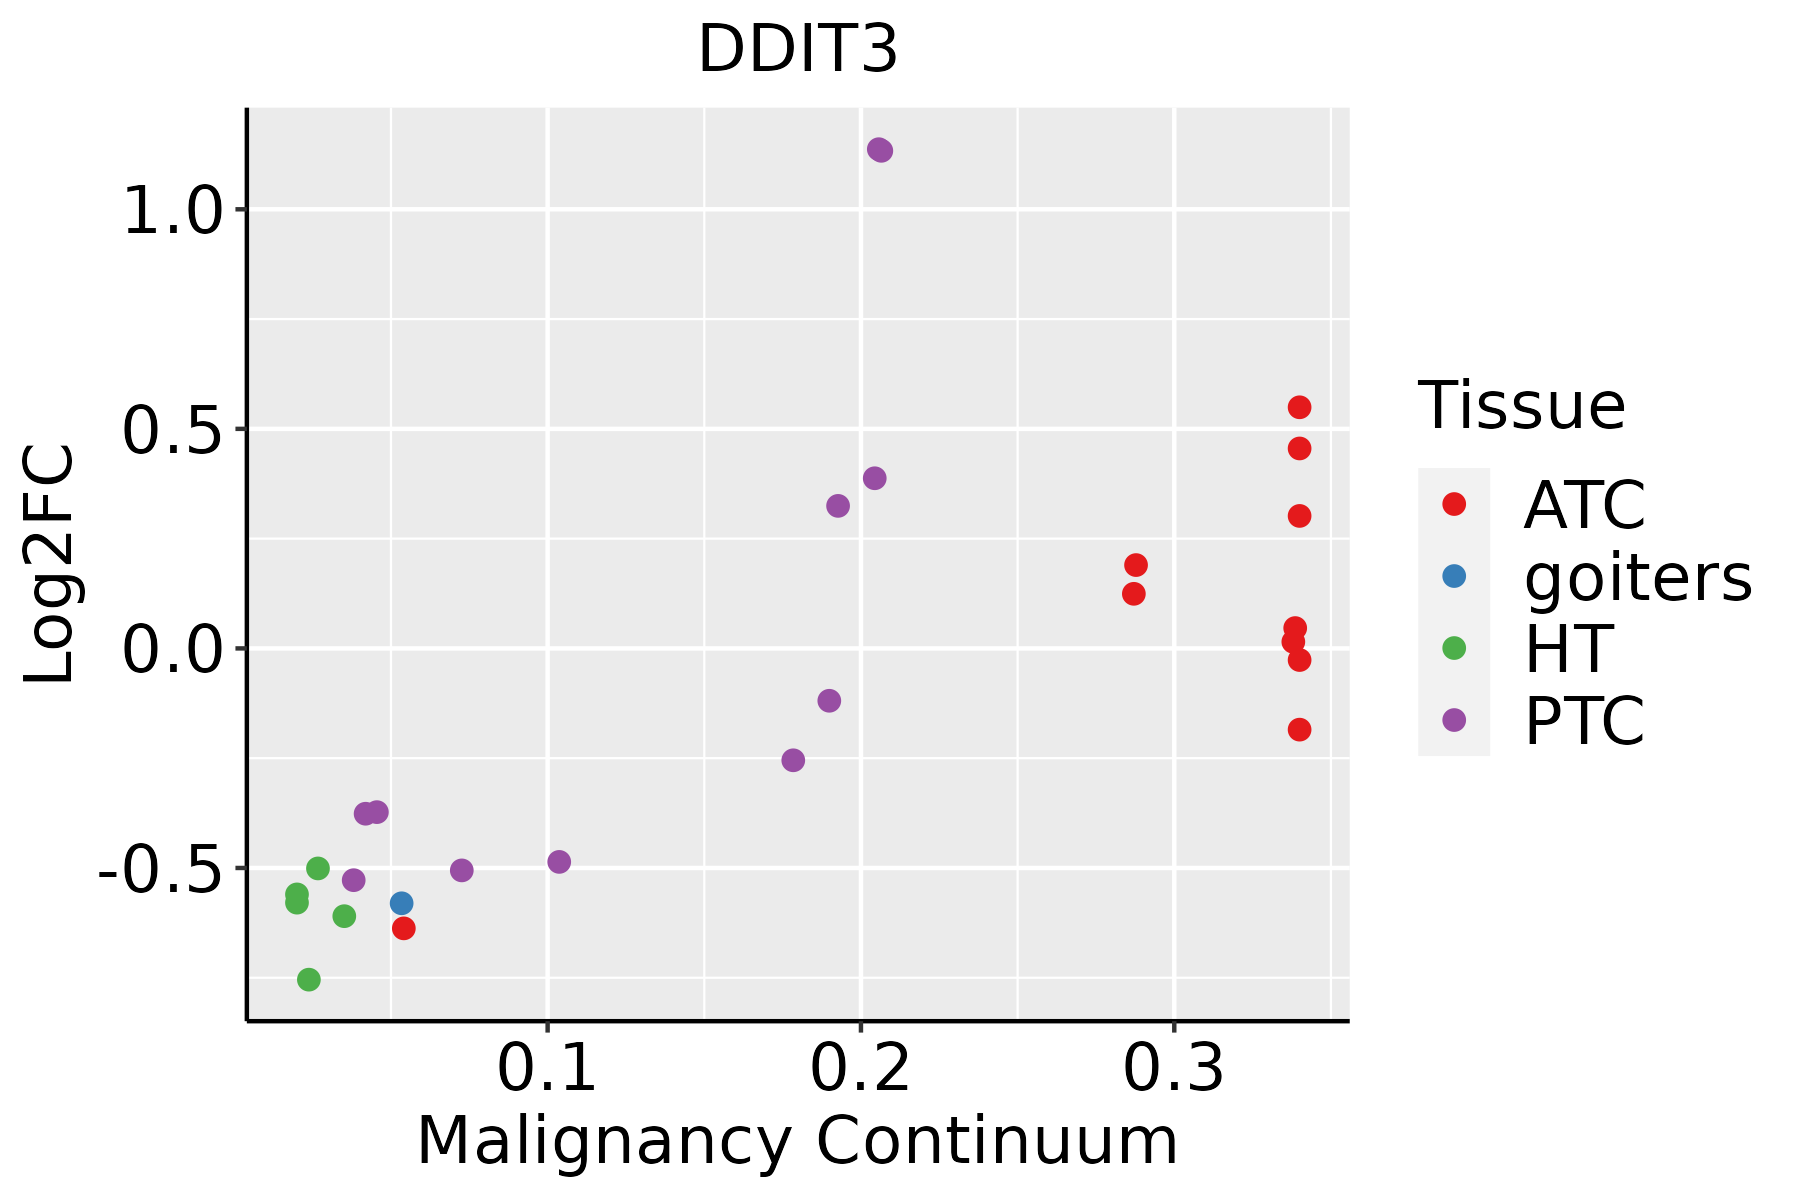 | ATC: Anaplastic thyroid cancer |
| HT: Hashimoto's thyroiditis | ||
| PTC: Papillary thyroid cancer |
| ∗log2FC in expression of this searched gene in stem-like cells from each diseased tissue sample relative to stem-like cells in normal samples in each tissue plotted against the malignancy continuum. Samples are colored based on if they are from different disease stage. |
Top |
Malignant transformation related pathway analysis |
| Find out the enriched GO biological processes and KEGG pathways involved in transition from healthy to precancer to cancer |
| Tissue | Disease Stage | Enriched GO biological Processes |
| Cervix | N_HPV |  |
| Endometrium | AEH |  |
| Endometrium | EEC |  |
| Prostate | BPH |  |
| Prostate | Tumor |  |
| ∗Top 15 enriched GO BP terms are showed in the bar plot of each disease state in each tissue. Each row represents a significant GO biological process which is colored according to the -log10(p.adjust). |
| Page: 1 2 3 4 5 6 7 8 9 |
| GO ID | Tissue | Disease Stage | Description | Gene Ratio | Bg Ratio | pvalue | p.adjust | Count |
| GO:001049826 | Esophagus | HGIN | proteasomal protein catabolic process | 139/2587 | 490/18723 | 1.20e-17 | 3.41e-15 | 139 |
| GO:007259420 | Esophagus | HGIN | establishment of protein localization to organelle | 120/2587 | 422/18723 | 1.73e-15 | 4.00e-13 | 120 |
| GO:009719327 | Esophagus | HGIN | intrinsic apoptotic signaling pathway | 90/2587 | 288/18723 | 1.50e-14 | 2.80e-12 | 90 |
| GO:004316126 | Esophagus | HGIN | proteasome-mediated ubiquitin-dependent protein catabolic process | 114/2587 | 412/18723 | 7.00e-14 | 1.20e-11 | 114 |
| GO:003497625 | Esophagus | HGIN | response to endoplasmic reticulum stress | 81/2587 | 256/18723 | 1.47e-13 | 2.32e-11 | 81 |
| GO:200124227 | Esophagus | HGIN | regulation of intrinsic apoptotic signaling pathway | 58/2587 | 164/18723 | 2.57e-12 | 3.58e-10 | 58 |
| GO:200123327 | Esophagus | HGIN | regulation of apoptotic signaling pathway | 97/2587 | 356/18723 | 1.36e-11 | 1.57e-09 | 97 |
| GO:003596625 | Esophagus | HGIN | response to topologically incorrect protein | 54/2587 | 159/18723 | 8.53e-11 | 8.89e-09 | 54 |
| GO:000698625 | Esophagus | HGIN | response to unfolded protein | 48/2587 | 137/18723 | 2.80e-10 | 2.54e-08 | 48 |
| GO:001050616 | Esophagus | HGIN | regulation of autophagy | 84/2587 | 317/18723 | 1.39e-09 | 1.08e-07 | 84 |
| GO:003596725 | Esophagus | HGIN | cellular response to topologically incorrect protein | 41/2587 | 116/18723 | 4.07e-09 | 2.84e-07 | 41 |
| GO:007058520 | Esophagus | HGIN | protein localization to mitochondrion | 43/2587 | 125/18723 | 4.43e-09 | 3.03e-07 | 43 |
| GO:003462020 | Esophagus | HGIN | cellular response to unfolded protein | 36/2587 | 96/18723 | 5.82e-09 | 3.88e-07 | 36 |
| GO:007265520 | Esophagus | HGIN | establishment of protein localization to mitochondrion | 41/2587 | 120/18723 | 1.26e-08 | 7.96e-07 | 41 |
| GO:200124410 | Esophagus | HGIN | positive regulation of intrinsic apoptotic signaling pathway | 25/2587 | 58/18723 | 4.91e-08 | 2.75e-06 | 25 |
| GO:190589725 | Esophagus | HGIN | regulation of response to endoplasmic reticulum stress | 31/2587 | 82/18723 | 5.25e-08 | 2.91e-06 | 31 |
| GO:200123519 | Esophagus | HGIN | positive regulation of apoptotic signaling pathway | 41/2587 | 126/18723 | 6.06e-08 | 3.22e-06 | 41 |
| GO:007005920 | Esophagus | HGIN | intrinsic apoptotic signaling pathway in response to endoplasmic reticulum stress | 25/2587 | 63/18723 | 3.41e-07 | 1.57e-05 | 25 |
| GO:000698410 | Esophagus | HGIN | ER-nucleus signaling pathway | 19/2587 | 46/18723 | 4.28e-06 | 1.41e-04 | 19 |
| GO:007099727 | Esophagus | HGIN | neuron death | 81/2587 | 361/18723 | 5.01e-06 | 1.61e-04 | 81 |
| Page: 1 2 3 4 5 6 7 8 9 10 11 12 13 14 15 16 17 18 19 20 21 22 23 24 25 26 27 28 29 30 31 32 33 34 35 |
| Pathway ID | Tissue | Disease Stage | Description | Gene Ratio | Bg Ratio | pvalue | p.adjust | qvalue | Count |
| hsa0501239 | Esophagus | HGIN | Parkinson disease | 124/1383 | 266/8465 | 5.95e-32 | 9.70e-30 | 7.70e-30 | 124 |
| hsa0502030 | Esophagus | HGIN | Prion disease | 117/1383 | 273/8465 | 4.15e-26 | 3.38e-24 | 2.69e-24 | 117 |
| hsa0501430 | Esophagus | HGIN | Amyotrophic lateral sclerosis | 140/1383 | 364/8465 | 2.13e-25 | 1.16e-23 | 9.19e-24 | 140 |
| hsa0502230 | Esophagus | HGIN | Pathways of neurodegeneration - multiple diseases | 153/1383 | 476/8465 | 1.22e-18 | 4.41e-17 | 3.50e-17 | 153 |
| hsa0501030 | Esophagus | HGIN | Alzheimer disease | 130/1383 | 384/8465 | 5.26e-18 | 1.71e-16 | 1.36e-16 | 130 |
| hsa0493230 | Esophagus | HGIN | Non-alcoholic fatty liver disease | 66/1383 | 155/8465 | 5.21e-15 | 1.21e-13 | 9.64e-14 | 66 |
| hsa0414139 | Esophagus | HGIN | Protein processing in endoplasmic reticulum | 67/1383 | 174/8465 | 1.06e-12 | 2.16e-11 | 1.72e-11 | 67 |
| hsa0421020 | Esophagus | HGIN | Apoptosis | 36/1383 | 136/8465 | 1.67e-03 | 1.52e-02 | 1.20e-02 | 36 |
| hsa0541739 | Esophagus | HGIN | Lipid and atherosclerosis | 51/1383 | 215/8465 | 2.95e-03 | 2.41e-02 | 1.91e-02 | 51 |
| hsa05012114 | Esophagus | HGIN | Parkinson disease | 124/1383 | 266/8465 | 5.95e-32 | 9.70e-30 | 7.70e-30 | 124 |
| hsa05020113 | Esophagus | HGIN | Prion disease | 117/1383 | 273/8465 | 4.15e-26 | 3.38e-24 | 2.69e-24 | 117 |
| hsa05014113 | Esophagus | HGIN | Amyotrophic lateral sclerosis | 140/1383 | 364/8465 | 2.13e-25 | 1.16e-23 | 9.19e-24 | 140 |
| hsa05022113 | Esophagus | HGIN | Pathways of neurodegeneration - multiple diseases | 153/1383 | 476/8465 | 1.22e-18 | 4.41e-17 | 3.50e-17 | 153 |
| hsa05010113 | Esophagus | HGIN | Alzheimer disease | 130/1383 | 384/8465 | 5.26e-18 | 1.71e-16 | 1.36e-16 | 130 |
| hsa04932113 | Esophagus | HGIN | Non-alcoholic fatty liver disease | 66/1383 | 155/8465 | 5.21e-15 | 1.21e-13 | 9.64e-14 | 66 |
| hsa04141114 | Esophagus | HGIN | Protein processing in endoplasmic reticulum | 67/1383 | 174/8465 | 1.06e-12 | 2.16e-11 | 1.72e-11 | 67 |
| hsa04210110 | Esophagus | HGIN | Apoptosis | 36/1383 | 136/8465 | 1.67e-03 | 1.52e-02 | 1.20e-02 | 36 |
| hsa05417114 | Esophagus | HGIN | Lipid and atherosclerosis | 51/1383 | 215/8465 | 2.95e-03 | 2.41e-02 | 1.91e-02 | 51 |
| hsa04141211 | Esophagus | ESCC | Protein processing in endoplasmic reticulum | 147/4205 | 174/8465 | 3.29e-22 | 1.10e-19 | 5.64e-20 | 147 |
| hsa05014210 | Esophagus | ESCC | Amyotrophic lateral sclerosis | 266/4205 | 364/8465 | 1.31e-20 | 2.20e-18 | 1.13e-18 | 266 |
| Page: 1 2 3 4 5 6 7 8 |
Top |
Cell-cell communication analysis |
| Identification of potential cell-cell interactions between two cell types and their ligand-receptor pairs for different disease states |
| Ligand | Receptor | LRpair | Pathway | Tissue | Disease Stage |
| Page: 1 |
Top |
Single-cell gene regulatory network inference analysis |
| Find out the significant the regulons (TFs) and the target genes of each regulon across cell types for different disease states |
| TF | Cell Type | Tissue | Disease Stage | Target Gene | RSS | Regulon Activity |
| DDIT3 | CD8TRM | Cervix | CC | AKR1A1,DNAJB1,TNFAIP6, etc. | 1.55e-01 |  |
| DDIT3 | CD4TN | Endometrium | EEC | SNHG12,C6orf48,SLC3A2, etc. | 9.94e-02 |  |
| DDIT3 | CD8TRM | Esophagus | ESCC | TIAF1,FAM20B,DNAJB1, etc. | 4.71e-01 |  |
| DDIT3 | TFH | Lung | MIAC | HSPE1,HSPD1,HSP90AA1, etc. | 2.26e-01 |  |
| DDIT3 | TFC | Thyroid | Healthy | ID3,SNHG5,LIMCH1, etc. | 2.75e-01 |  |
| ∗The dot plots of a searched regulon are shown for all cell subpopulations in each disease state of each tissue based on the regulon specific score inferred using pySCENIC and by calculating the average expression. |
| Page: 1 |
Top |
Somatic mutation of malignant transformation related genes |
| Annotation of somatic variants for genes involved in malignant transformation |
| Hugo Symbol | Variant Class | Variant Classification | dbSNP RS | HGVSc | HGVSp | HGVSp Short | SWISSPROT | BIOTYPE | SIFT | PolyPhen | Tumor Sample Barcode | Tissue | Histology | Sex | Age | Stage | Therapy Types | Drugs | Outcome |
| DDIT3 | SNV | Missense_Mutation | c.496N>A | p.Gln166Lys | p.Q166K | P35638 | protein_coding | tolerated(0.51) | benign(0.116) | TCGA-B6-A0RE-01 | Breast | breast invasive carcinoma | Female | <65 | I/II | Unknown | Unknown | SD | |
| DDIT3 | SNV | Missense_Mutation | novel | c.410N>A | p.Arg137Gln | p.R137Q | P35638 | protein_coding | tolerated(0.45) | benign(0.018) | TCGA-DG-A2KL-01 | Cervix | cervical & endocervical cancer | Female | <65 | I/II | Chemotherapy | cisplatin | SD |
| DDIT3 | SNV | Missense_Mutation | rs568713877 | c.530C>T | p.Ala177Val | p.A177V | P35638 | protein_coding | tolerated(0.17) | benign(0.003) | TCGA-EA-A3HU-01 | Cervix | cervical & endocervical cancer | Female | <65 | I/II | Unknown | Unknown | SD |
| DDIT3 | SNV | Missense_Mutation | novel | c.550N>A | p.Asp184Asn | p.D184N | P35638 | protein_coding | deleterious(0.03) | benign(0.011) | TCGA-VS-A958-01 | Cervix | cervical & endocervical cancer | Female | <65 | I/II | Chemotherapy | cisplatin | CR |
| DDIT3 | SNV | Missense_Mutation | rs377303534 | c.488G>A | p.Arg163Gln | p.R163Q | P35638 | protein_coding | tolerated(0.33) | probably_damaging(0.999) | TCGA-AA-3492-01 | Colorectum | colon adenocarcinoma | Female | >=65 | I/II | Unknown | Unknown | SD |
| DDIT3 | SNV | Missense_Mutation | c.343C>G | p.Gln115Glu | p.Q115E | P35638 | protein_coding | tolerated(0.27) | possibly_damaging(0.761) | TCGA-AA-A02R-01 | Colorectum | colon adenocarcinoma | Female | >=65 | I/II | Unknown | Unknown | PD | |
| DDIT3 | SNV | Missense_Mutation | novel | c.287T>C | p.Val96Ala | p.V96A | P35638 | protein_coding | tolerated(0.27) | benign(0.003) | TCGA-AZ-6607-01 | Colorectum | colon adenocarcinoma | Male | >=65 | III/IV | Unknown | Unknown | PD |
| DDIT3 | SNV | Missense_Mutation | rs139206730 | c.509N>A | p.Arg170His | p.R170H | P35638 | protein_coding | deleterious(0.03) | benign(0.042) | TCGA-AJ-A3BH-01 | Endometrium | uterine corpus endometrioid carcinoma | Female | Unknown | I/II | Unknown | Unknown | SD |
| DDIT3 | SNV | Missense_Mutation | rs568713877 | c.530N>T | p.Ala177Val | p.A177V | P35638 | protein_coding | tolerated(0.17) | benign(0.003) | TCGA-AJ-A3EK-01 | Endometrium | uterine corpus endometrioid carcinoma | Female | <65 | I/II | Chemotherapy | carboplatin | CR |
| DDIT3 | SNV | Missense_Mutation | novel | c.27N>G | p.His9Gln | p.H9Q | P35638 | protein_coding | deleterious_low_confidence(0) | benign(0.017) | TCGA-AP-A0LM-01 | Endometrium | uterine corpus endometrioid carcinoma | Female | <65 | III/IV | Chemotherapy | cisplatin | SD |
| Page: 1 2 3 |
Top |
Related drugs of malignant transformation related genes |
| Identification of chemicals and drugs interact with genes involved in malignant transfromation |
| (DGIdb 4.0) |
| Entrez ID | Symbol | Category | Interaction Types | Drug Claim Name | Drug Name | PMIDs |
| 1649 | DDIT3 | CLINICALLY ACTIONABLE, TRANSCRIPTION FACTOR COMPLEX, TRANSCRIPTION FACTOR BINDING, TRANSCRIPTION FACTOR | FENRETINIDE | FENRETINIDE | 12234979,17273769 | |
| 1649 | DDIT3 | CLINICALLY ACTIONABLE, TRANSCRIPTION FACTOR COMPLEX, TRANSCRIPTION FACTOR BINDING, TRANSCRIPTION FACTOR | PROTEIN SYNTHESIS INHIBITOR | 1735464 | ||
| 1649 | DDIT3 | CLINICALLY ACTIONABLE, TRANSCRIPTION FACTOR COMPLEX, TRANSCRIPTION FACTOR BINDING, TRANSCRIPTION FACTOR | TAXOL | PACLITAXEL | 8554977 | |
| 1649 | DDIT3 | CLINICALLY ACTIONABLE, TRANSCRIPTION FACTOR COMPLEX, TRANSCRIPTION FACTOR BINDING, TRANSCRIPTION FACTOR | SURAMIN | SURAMIN | 9586958 | |
| 1649 | DDIT3 | CLINICALLY ACTIONABLE, TRANSCRIPTION FACTOR COMPLEX, TRANSCRIPTION FACTOR BINDING, TRANSCRIPTION FACTOR | DICLOFENAC | DICLOFENAC | 15131590 | |
| 1649 | DDIT3 | CLINICALLY ACTIONABLE, TRANSCRIPTION FACTOR COMPLEX, TRANSCRIPTION FACTOR BINDING, TRANSCRIPTION FACTOR | PHOTOSENSITIZER | 15611953 | ||
| 1649 | DDIT3 | CLINICALLY ACTIONABLE, TRANSCRIPTION FACTOR COMPLEX, TRANSCRIPTION FACTOR BINDING, TRANSCRIPTION FACTOR | QUINONE | 8794898 | ||
| 1649 | DDIT3 | CLINICALLY ACTIONABLE, TRANSCRIPTION FACTOR COMPLEX, TRANSCRIPTION FACTOR BINDING, TRANSCRIPTION FACTOR | TAXOTERE | TAXOTERE | 10470115 | |
| 1649 | DDIT3 | CLINICALLY ACTIONABLE, TRANSCRIPTION FACTOR COMPLEX, TRANSCRIPTION FACTOR BINDING, TRANSCRIPTION FACTOR | CISPLATIN | CISPLATIN | 10071988,8554977 | |
| 1649 | DDIT3 | CLINICALLY ACTIONABLE, TRANSCRIPTION FACTOR COMPLEX, TRANSCRIPTION FACTOR BINDING, TRANSCRIPTION FACTOR | STAUROSPORINE | STAUROSPORINE | 17167033 |
| Page: 1 2 3 4 5 |

Copyright 2023-Present -The University of Texas Health Science Center at Houston |