
|
|||||
|
 | |
| |
| |
| |
| |
| |
|
Gene: CAVIN3 |
Gene summary for CAVIN3 |
| Gene information | Species | Human | Gene symbol | CAVIN3 | Gene ID | 112464 |
| Gene name | caveolae associated protein 3 | |
| Gene Alias | HSRBC | |
| Cytomap | 11p15.4 | |
| Gene Type | protein-coding | GO ID | GO:0000165 | UniProtAcc | Q969G5 |
Top |
Malignant transformation analysis |
| Identification of the aberrant gene expression in precancerous and cancerous lesions by comparing the gene expression of stem-like cells in diseased tissues with normal stem cells |
| Entrez ID | Symbol | Replicates | Species | Organ | Tissue | Adj P-value | Log2FC | Malignancy |
| 112464 | CAVIN3 | male-WTA | Human | Thyroid | PTC | 2.43e-03 | 8.01e-02 | 0.1037 |
| 112464 | CAVIN3 | ATC09 | Human | Thyroid | ATC | 6.18e-03 | 1.75e-01 | 0.2871 |
| 112464 | CAVIN3 | ATC11 | Human | Thyroid | ATC | 2.02e-16 | 9.77e-01 | 0.3386 |
| 112464 | CAVIN3 | ATC12 | Human | Thyroid | ATC | 1.18e-86 | 1.71e+00 | 0.34 |
| 112464 | CAVIN3 | ATC13 | Human | Thyroid | ATC | 1.87e-59 | 1.38e+00 | 0.34 |
| 112464 | CAVIN3 | ATC1 | Human | Thyroid | ATC | 2.78e-04 | 2.20e-01 | 0.2878 |
| 112464 | CAVIN3 | ATC2 | Human | Thyroid | ATC | 5.16e-32 | 2.52e+00 | 0.34 |
| 112464 | CAVIN3 | ATC3 | Human | Thyroid | ATC | 9.91e-18 | 7.88e-01 | 0.338 |
| 112464 | CAVIN3 | ATC4 | Human | Thyroid | ATC | 2.01e-98 | 2.01e+00 | 0.34 |
| 112464 | CAVIN3 | ATC5 | Human | Thyroid | ATC | 3.84e-65 | 1.49e+00 | 0.34 |
| Page: 1 |
| Tissue | Expression Dynamics | Abbreviation |
| Thyroid | 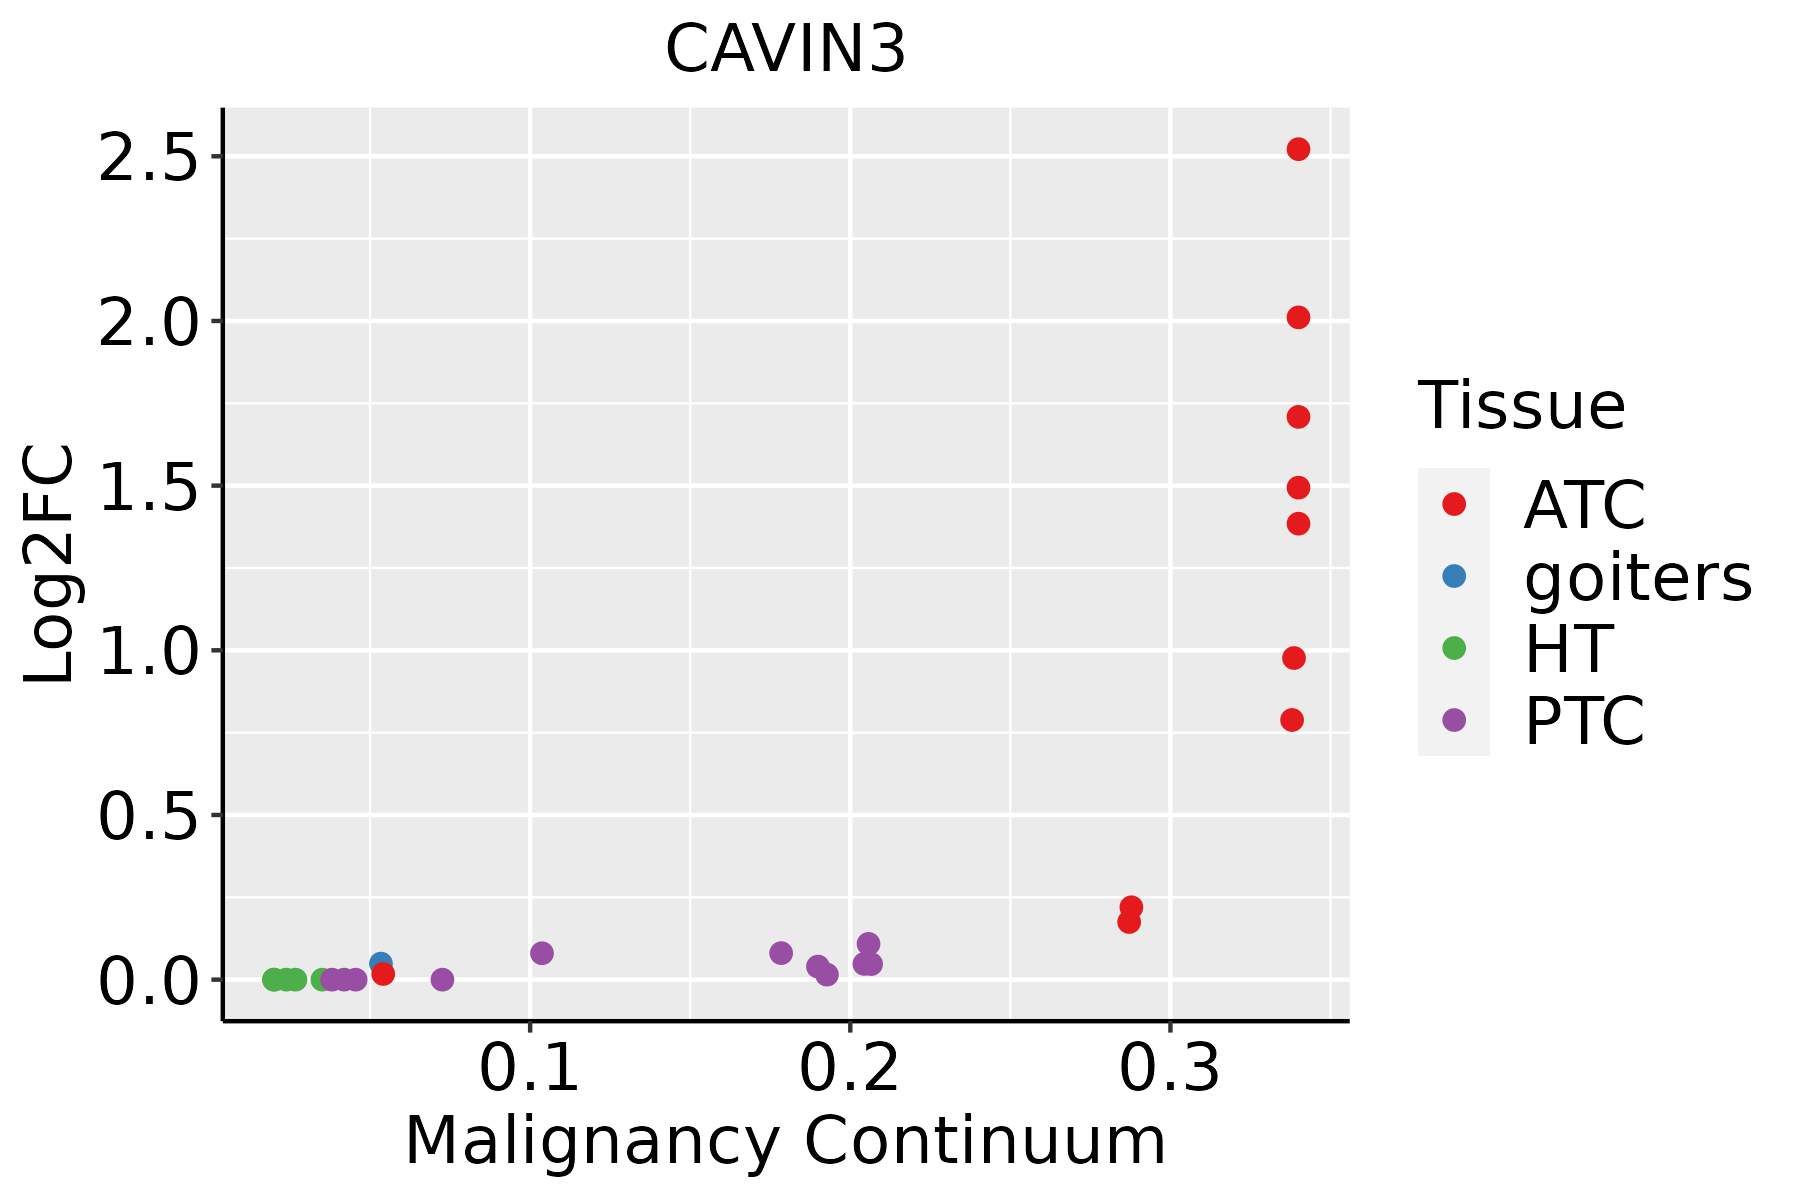 | ATC: Anaplastic thyroid cancer |
| HT: Hashimoto's thyroiditis | ||
| PTC: Papillary thyroid cancer |
| ∗log2FC in expression of this searched gene in stem-like cells from each diseased tissue sample relative to stem-like cells in normal samples in each tissue plotted against the malignancy continuum. Samples are colored based on if they are from different disease stage. |
Top |
Malignant transformation related pathway analysis |
| Find out the enriched GO biological processes and KEGG pathways involved in transition from healthy to precancer to cancer |
| Tissue | Disease Stage | Enriched GO biological Processes |
| Cervix | N_HPV |  |
| Endometrium | AEH |  |
| Endometrium | EEC |  |
| Prostate | BPH |  |
| Prostate | Tumor |  |
| ∗Top 15 enriched GO BP terms are showed in the bar plot of each disease state in each tissue. Each row represents a significant GO biological process which is colored according to the -log10(p.adjust). |
| Page: 1 2 3 4 5 6 7 8 9 |
| GO ID | Tissue | Disease Stage | Description | Gene Ratio | Bg Ratio | pvalue | p.adjust | Count |
| GO:0006091112 | Thyroid | PTC | generation of precursor metabolites and energy | 252/5968 | 490/18723 | 8.24e-20 | 1.13e-17 | 252 |
| GO:0015980111 | Thyroid | PTC | energy derivation by oxidation of organic compounds | 176/5968 | 318/18723 | 2.67e-18 | 2.90e-16 | 176 |
| GO:003292219 | Thyroid | PTC | circadian regulation of gene expression | 43/5968 | 68/18723 | 1.03e-07 | 2.05e-06 | 43 |
| GO:0030865110 | Thyroid | PTC | cortical cytoskeleton organization | 38/5968 | 61/18723 | 9.77e-07 | 1.46e-05 | 38 |
| GO:0043467110 | Thyroid | PTC | regulation of generation of precursor metabolites and energy | 68/5968 | 130/18723 | 1.03e-06 | 1.52e-05 | 68 |
| GO:0048511111 | Thyroid | PTC | rhythmic process | 131/5968 | 298/18723 | 7.06e-06 | 8.33e-05 | 131 |
| GO:0007623111 | Thyroid | PTC | circadian rhythm | 96/5968 | 210/18723 | 1.74e-05 | 1.82e-04 | 96 |
| GO:003086616 | Thyroid | PTC | cortical actin cytoskeleton organization | 25/5968 | 40/18723 | 6.51e-05 | 5.72e-04 | 25 |
| GO:00434918 | Thyroid | PTC | protein kinase B signaling | 88/5968 | 211/18723 | 1.59e-03 | 8.81e-03 | 88 |
| GO:00518969 | Thyroid | PTC | regulation of protein kinase B signaling | 74/5968 | 185/18723 | 1.16e-02 | 4.58e-02 | 74 |
| GO:000609134 | Thyroid | ATC | generation of precursor metabolites and energy | 256/6293 | 490/18723 | 6.55e-18 | 7.69e-16 | 256 |
| GO:001598034 | Thyroid | ATC | energy derivation by oxidation of organic compounds | 177/6293 | 318/18723 | 3.60e-16 | 2.92e-14 | 177 |
| GO:003086523 | Thyroid | ATC | cortical cytoskeleton organization | 41/6293 | 61/18723 | 8.28e-08 | 1.43e-06 | 41 |
| GO:003292223 | Thyroid | ATC | circadian regulation of gene expression | 43/6293 | 68/18723 | 5.45e-07 | 7.79e-06 | 43 |
| GO:004851124 | Thyroid | ATC | rhythmic process | 141/6293 | 298/18723 | 5.58e-07 | 7.93e-06 | 141 |
| GO:003086617 | Thyroid | ATC | cortical actin cytoskeleton organization | 28/6293 | 40/18723 | 2.77e-06 | 3.19e-05 | 28 |
| GO:004346726 | Thyroid | ATC | regulation of generation of precursor metabolites and energy | 68/6293 | 130/18723 | 8.19e-06 | 8.27e-05 | 68 |
| GO:000762325 | Thyroid | ATC | circadian rhythm | 100/6293 | 210/18723 | 1.67e-05 | 1.54e-04 | 100 |
| GO:004349116 | Thyroid | ATC | protein kinase B signaling | 87/6293 | 211/18723 | 1.20e-02 | 4.27e-02 | 87 |
| Page: 1 |
| Pathway ID | Tissue | Disease Stage | Description | Gene Ratio | Bg Ratio | pvalue | p.adjust | qvalue | Count |
| Page: 1 |
Top |
Cell-cell communication analysis |
| Identification of potential cell-cell interactions between two cell types and their ligand-receptor pairs for different disease states |
| Ligand | Receptor | LRpair | Pathway | Tissue | Disease Stage |
| Page: 1 |
Top |
Single-cell gene regulatory network inference analysis |
| Find out the significant the regulons (TFs) and the target genes of each regulon across cell types for different disease states |
| TF | Cell Type | Tissue | Disease Stage | Target Gene | RSS | Regulon Activity |
| ∗The dot plots of a searched regulon are shown for all cell subpopulations in each disease state of each tissue based on the regulon specific score inferred using pySCENIC and by calculating the average expression. |
| Page: 1 |
Top |
Somatic mutation of malignant transformation related genes |
| Annotation of somatic variants for genes involved in malignant transformation |
| Hugo Symbol | Variant Class | Variant Classification | dbSNP RS | HGVSc | HGVSp | HGVSp Short | SWISSPROT | BIOTYPE | SIFT | PolyPhen | Tumor Sample Barcode | Tissue | Histology | Sex | Age | Stage | Therapy Types | Drugs | Outcome |
| Page: 1 |
Top |
Related drugs of malignant transformation related genes |
| Identification of chemicals and drugs interact with genes involved in malignant transfromation |
| (DGIdb 4.0) |
| Entrez ID | Symbol | Category | Interaction Types | Drug Claim Name | Drug Name | PMIDs |
| Page: 1 |

Copyright 2023-Present -The University of Texas Health Science Center at Houston |