
|
|||||
|
 | |
| |
| |
| |
| |
| |
|
Gene: C19orf10 |
Gene summary for C19ORF10 |
| Gene information | Species | Human | Gene symbol | C19orf10 | Gene ID | 56005 |
| Gene name | myeloid derived growth factor | |
| Gene Alias | C19orf10 | |
| Cytomap | 19p13.3 | |
| Gene Type | protein-coding | GO ID | GO:0000165 | UniProtAcc | Q969H8 |
Top |
Malignant transformation analysis |
| Identification of the aberrant gene expression in precancerous and cancerous lesions by comparing the gene expression of stem-like cells in diseased tissues with normal stem cells |
| Entrez ID | Symbol | Replicates | Species | Organ | Tissue | Adj P-value | Log2FC | Malignancy |
| 56005 | C19orf10 | Pt13.a | Human | Liver | HCC | 2.23e-49 | 7.84e-01 | 0.021 |
| 56005 | C19orf10 | Pt13.b | Human | Liver | HCC | 2.66e-86 | 9.72e-01 | 0.0251 |
| 56005 | C19orf10 | Pt13.c | Human | Liver | HCC | 2.44e-07 | 4.00e-01 | 0.0076 |
| 56005 | C19orf10 | Pt14.a | Human | Liver | HCC | 1.06e-24 | 7.92e-01 | 0.0169 |
| 56005 | C19orf10 | Pt14.b | Human | Liver | HCC | 2.92e-11 | 4.04e-01 | 0.018 |
| 56005 | C19orf10 | Pt14.d | Human | Liver | HCC | 2.44e-24 | 5.11e-01 | 0.0143 |
| 56005 | C19orf10 | GSM5353218_PA_PB1B_Pool_1_2_S74_L003 | Human | Prostate | Tumor | 6.49e-08 | 6.86e-01 | 0.1479 |
| 56005 | C19orf10 | GSM5353220_PA_PB1B_Pool_3_S51_L002 | Human | Prostate | Tumor | 1.29e-04 | 5.53e-01 | 0.1531 |
| 56005 | C19orf10 | GSM5353221_PA_PB2A_Pool_1_3_S25_L001 | Human | Prostate | Tumor | 5.01e-05 | 2.62e-01 | 0.1633 |
| 56005 | C19orf10 | GSM5353223_PA_PB2B_Pool_2_S26_L001 | Human | Prostate | Tumor | 3.65e-04 | 2.07e-01 | 0.1604 |
| 56005 | C19orf10 | GSM5353224_PA_PR5186_Pool_1_2_3_S27_L001 | Human | Prostate | Tumor | 4.44e-11 | 3.98e-01 | 0.1621 |
| 56005 | C19orf10 | GSM5353225_PA_PR5196-1_Pool_1_2_3_S53_L002 | Human | Prostate | Tumor | 3.50e-02 | 3.19e-01 | 0.1619 |
| 56005 | C19orf10 | GSM5353226_PA_PR5196-2_Pool_1_2_3_S54_L002 | Human | Prostate | Tumor | 4.40e-03 | 3.86e-01 | 0.159 |
| 56005 | C19orf10 | GSM5353227_PA_PR5199-193K_Pool_1_2_3_S55_L002 | Human | Prostate | Tumor | 2.33e-03 | 2.44e-01 | 0.1602 |
| 56005 | C19orf10 | GSM5353240_PA_PR5254_T1_S15_L001 | Human | Prostate | Tumor | 1.52e-04 | 2.54e-01 | 0.1575 |
| 56005 | C19orf10 | P1_S1_AK | Human | Skin | AK | 7.41e-14 | -3.23e-01 | -0.3399 |
| 56005 | C19orf10 | P2_S3_AK | Human | Skin | AK | 7.41e-14 | -3.23e-01 | -0.3287 |
| 56005 | C19orf10 | P2_S4_SCCIS | Human | Skin | SCCIS | 8.14e-13 | -3.23e-01 | -0.3043 |
| 56005 | C19orf10 | P3_S6_AK | Human | Skin | AK | 7.41e-14 | -3.23e-01 | -0.3256 |
| 56005 | C19orf10 | P4_S8_cSCC | Human | Skin | cSCC | 4.57e-07 | -3.23e-01 | -0.3095 |
| Page: 1 2 3 |
| Tissue | Expression Dynamics | Abbreviation |
| GC | 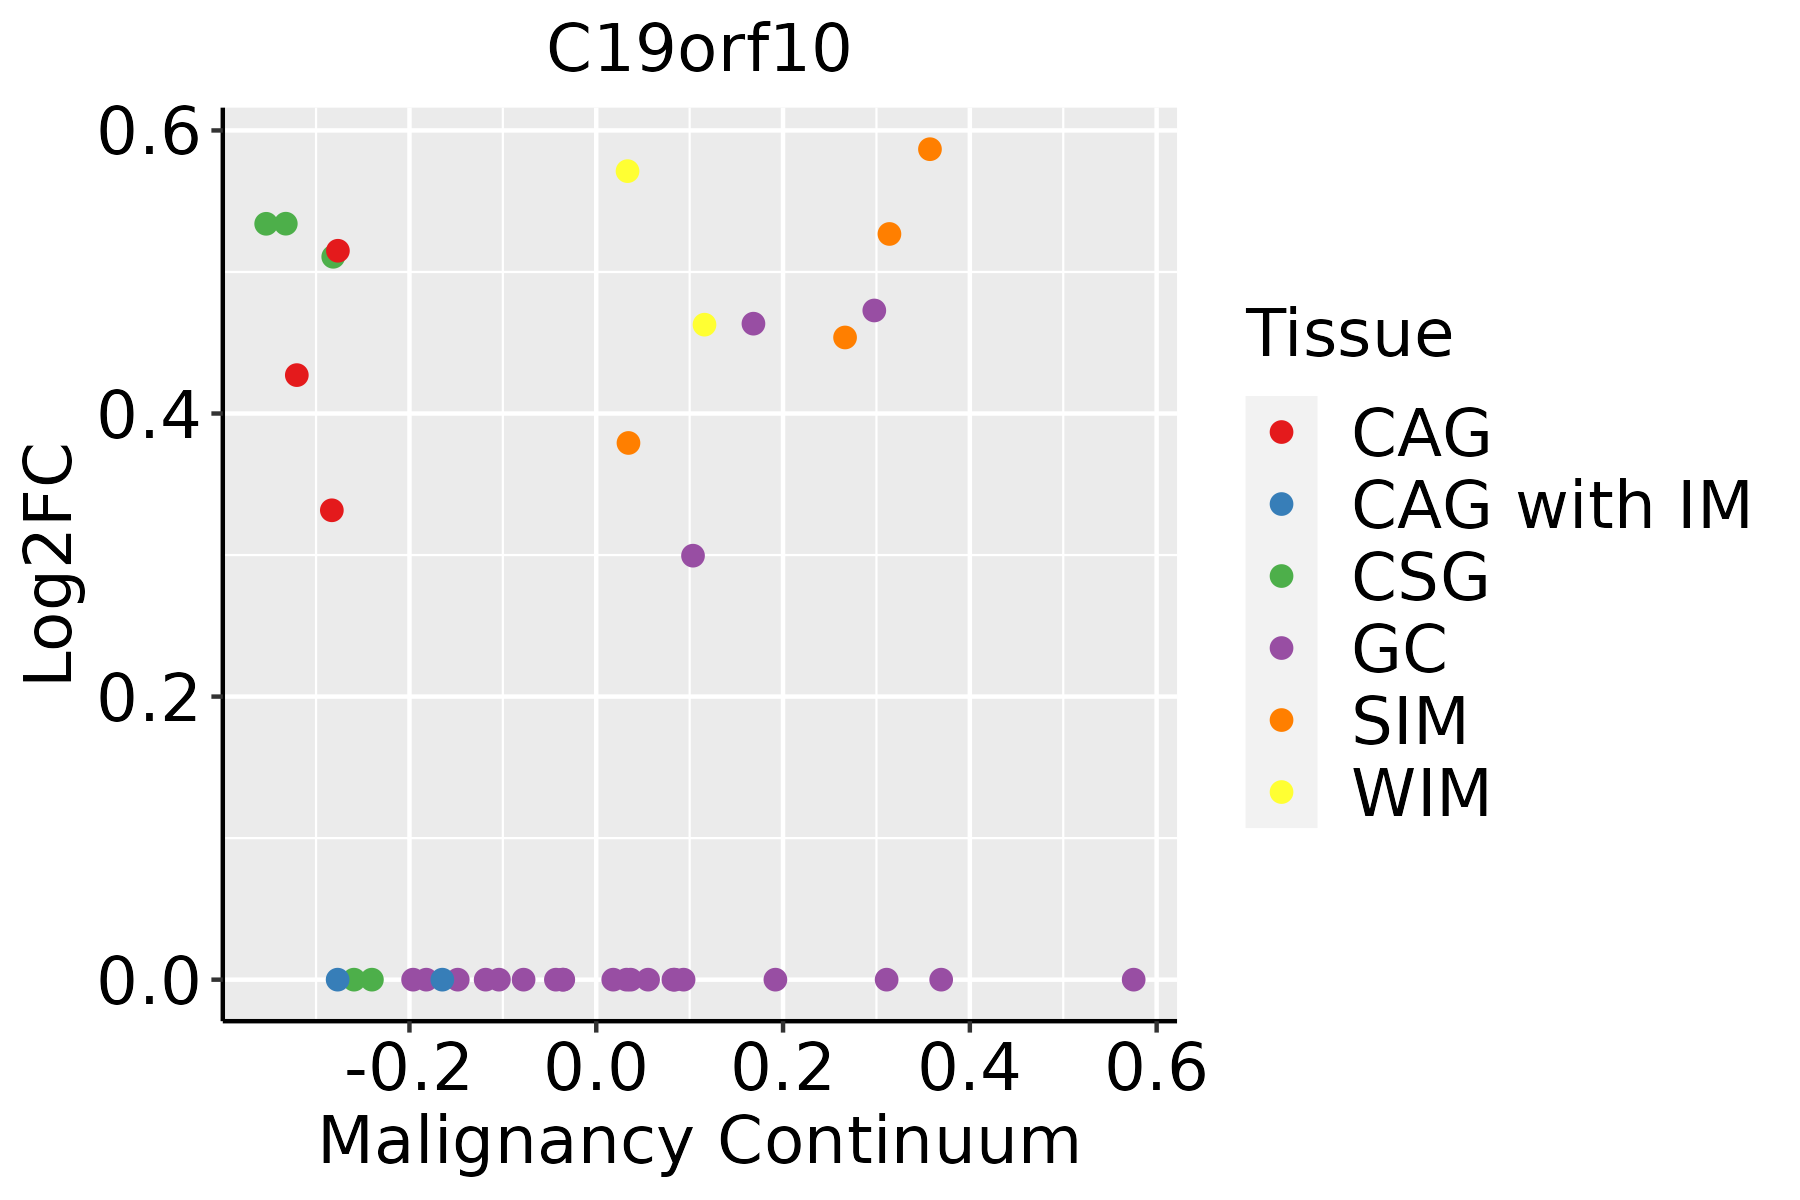 | CAG: Chronic atrophic gastritis |
| CAG with IM: Chronic atrophic gastritis with intestinal metaplasia | ||
| CSG: Chronic superficial gastritis | ||
| GC: Gastric cancer | ||
| SIM: Severe intestinal metaplasia | ||
| WIM: Wild intestinal metaplasia | ||
| Liver |  | HCC: Hepatocellular carcinoma |
| NAFLD: Non-alcoholic fatty liver disease | ||
| Prostate | 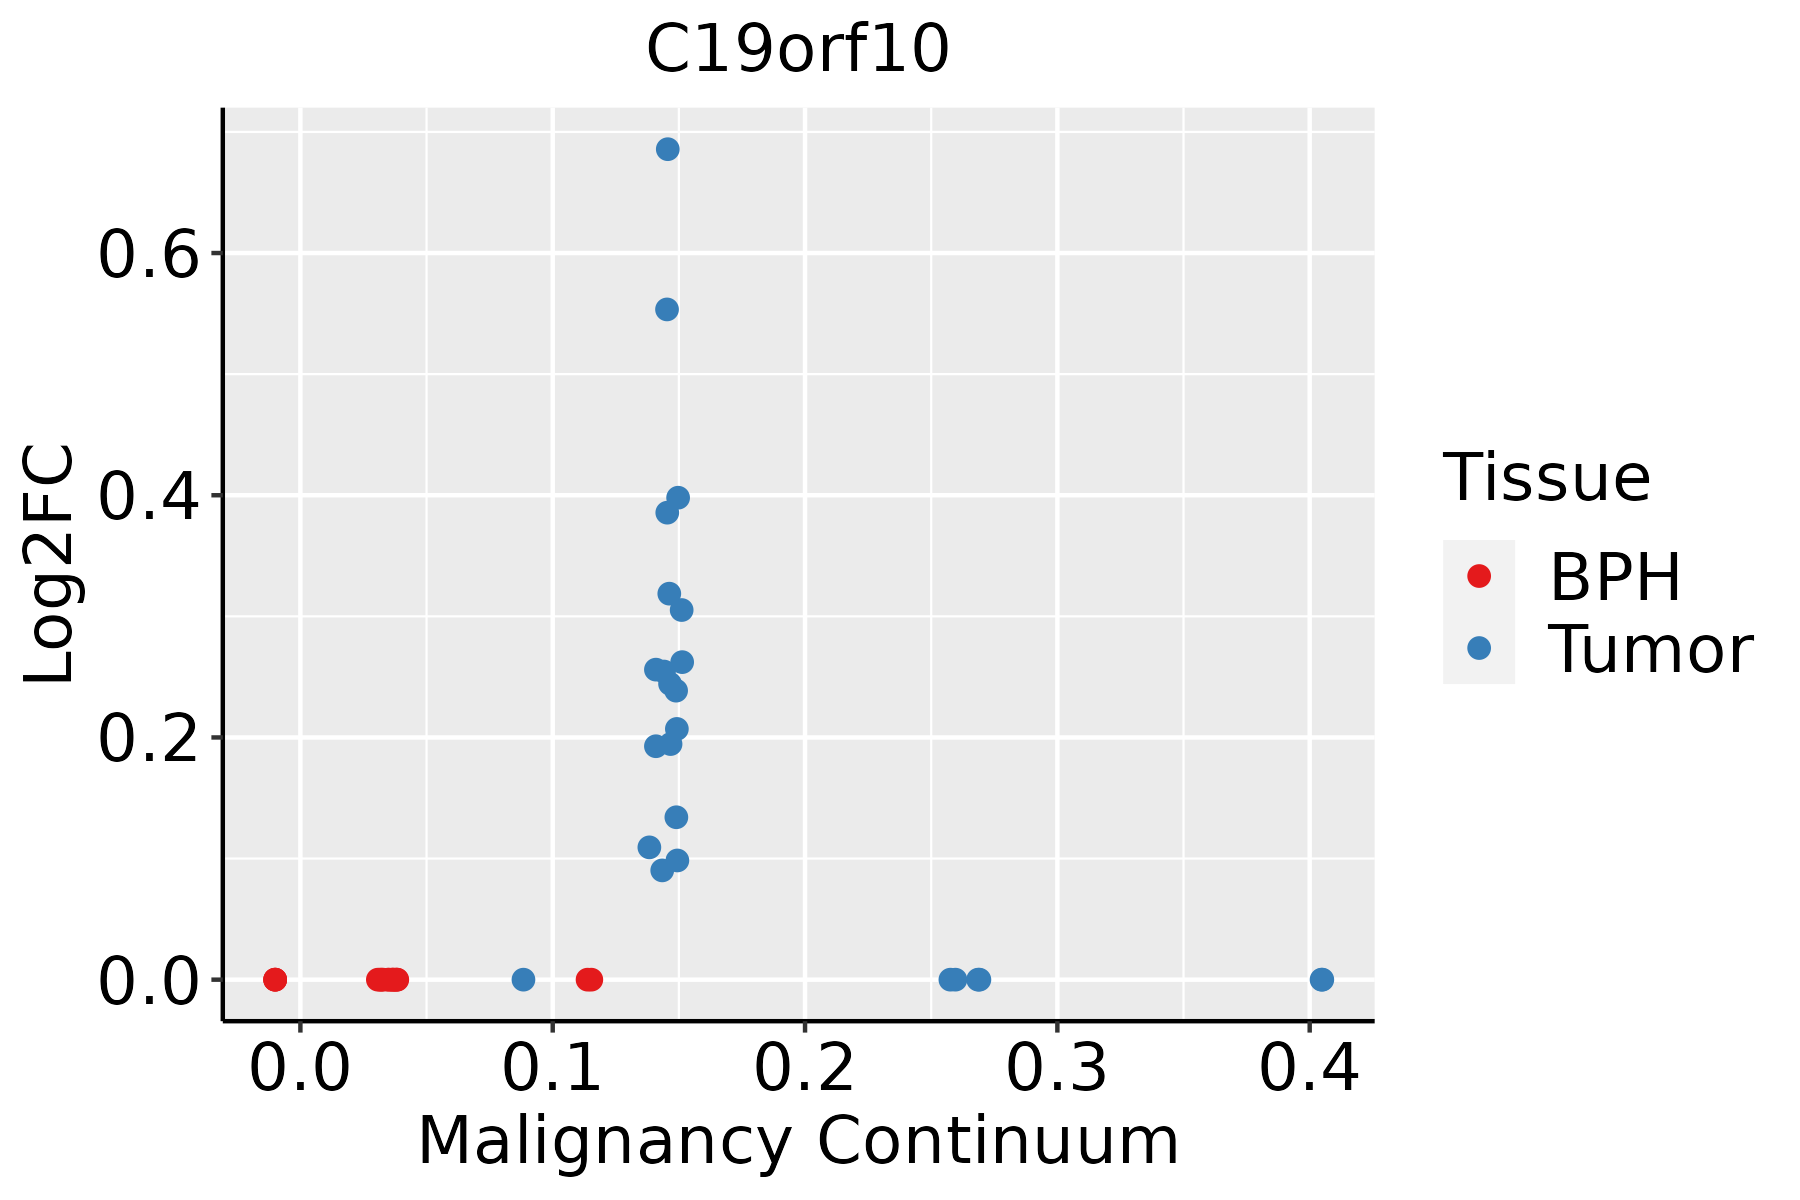 | BPH: Benign Prostatic Hyperplasia |
| Skin | 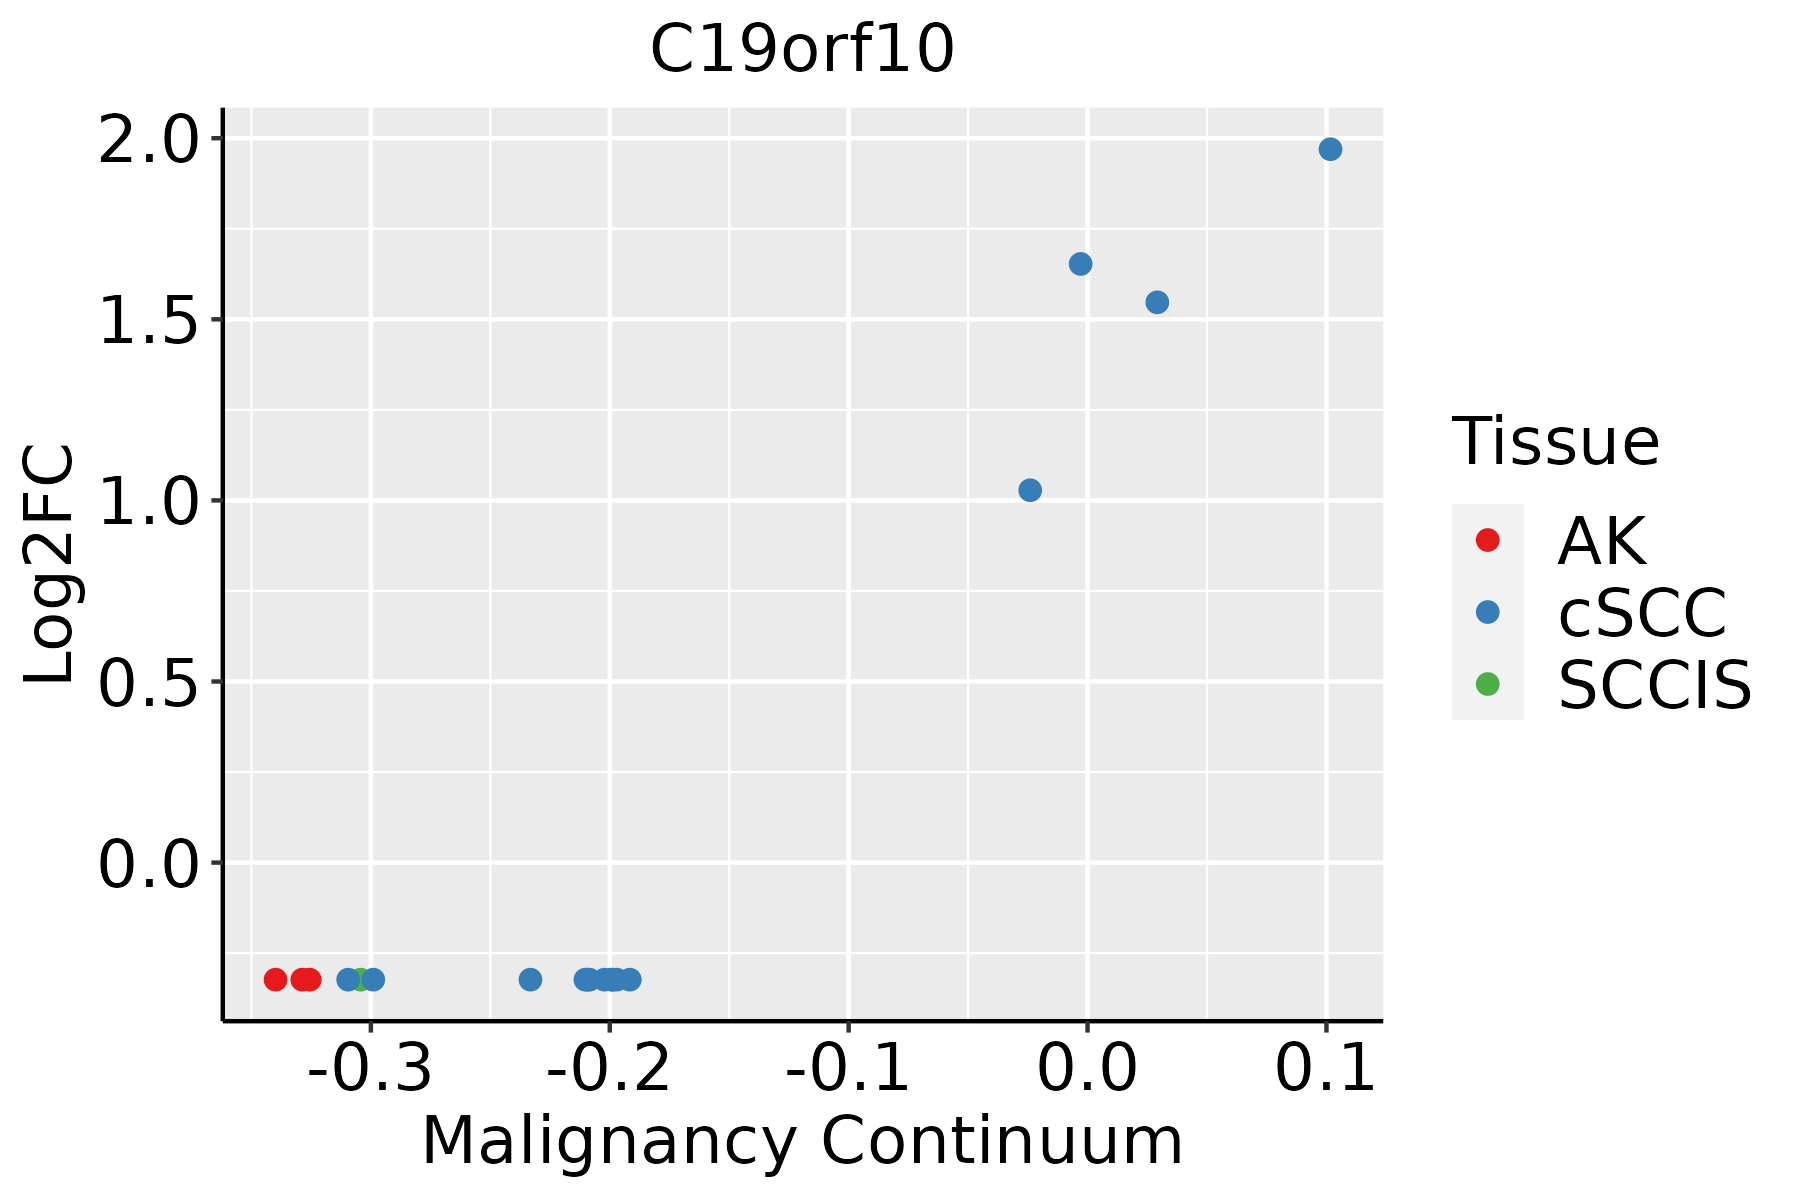 | AK: Actinic keratosis |
| cSCC: Cutaneous squamous cell carcinoma | ||
| SCCIS:squamous cell carcinoma in situ |
| ∗log2FC in expression of this searched gene in stem-like cells from each diseased tissue sample relative to stem-like cells in normal samples in each tissue plotted against the malignancy continuum. Samples are colored based on if they are from different disease stage. |
Top |
Malignant transformation related pathway analysis |
| Find out the enriched GO biological processes and KEGG pathways involved in transition from healthy to precancer to cancer |
| Tissue | Disease Stage | Enriched GO biological Processes |
| Cervix | N_HPV |  |
| Endometrium | AEH |  |
| Endometrium | EEC |  |
| Prostate | BPH |  |
| Prostate | Tumor |  |
| ∗Top 15 enriched GO BP terms are showed in the bar plot of each disease state in each tissue. Each row represents a significant GO biological process which is colored according to the -log10(p.adjust). |
| Page: 1 2 3 4 5 6 7 8 9 |
| GO ID | Tissue | Disease Stage | Description | Gene Ratio | Bg Ratio | pvalue | p.adjust | Count |
| Page: 1 |
| Pathway ID | Tissue | Disease Stage | Description | Gene Ratio | Bg Ratio | pvalue | p.adjust | qvalue | Count |
| Page: 1 |
Top |
Cell-cell communication analysis |
| Identification of potential cell-cell interactions between two cell types and their ligand-receptor pairs for different disease states |
| Ligand | Receptor | LRpair | Pathway | Tissue | Disease Stage |
| Page: 1 |
Top |
Single-cell gene regulatory network inference analysis |
| Find out the significant the regulons (TFs) and the target genes of each regulon across cell types for different disease states |
| TF | Cell Type | Tissue | Disease Stage | Target Gene | RSS | Regulon Activity |
| ∗The dot plots of a searched regulon are shown for all cell subpopulations in each disease state of each tissue based on the regulon specific score inferred using pySCENIC and by calculating the average expression. |
| Page: 1 |
Top |
Somatic mutation of malignant transformation related genes |
| Annotation of somatic variants for genes involved in malignant transformation |
| Hugo Symbol | Variant Class | Variant Classification | dbSNP RS | HGVSc | HGVSp | HGVSp Short | SWISSPROT | BIOTYPE | SIFT | PolyPhen | Tumor Sample Barcode | Tissue | Histology | Sex | Age | Stage | Therapy Types | Drugs | Outcome |
| Page: 1 |
Top |
Related drugs of malignant transformation related genes |
| Identification of chemicals and drugs interact with genes involved in malignant transfromation |
| (DGIdb 4.0) |
| Entrez ID | Symbol | Category | Interaction Types | Drug Claim Name | Drug Name | PMIDs |
| Page: 1 |

Copyright 2023-Present -The University of Texas Health Science Center at Houston |