
|
|||||
|
 | |
| |
| |
| |
| |
| |
|
Gene: BOLA2 |
Gene summary for BOLA2 |
| Gene information | Species | Human | Gene symbol | BOLA2 | Gene ID | 552900 |
| Gene name | bolA family member 2 | |
| Gene Alias | BOLA2A | |
| Cytomap | 16p11.2 | |
| Gene Type | protein-coding | GO ID | GO:0006790 | UniProtAcc | A0A087WZT3 |
Top |
Malignant transformation analysis |
| Identification of the aberrant gene expression in precancerous and cancerous lesions by comparing the gene expression of stem-like cells in diseased tissues with normal stem cells |
| Entrez ID | Symbol | Replicates | Species | Organ | Tissue | Adj P-value | Log2FC | Malignancy |
| 552900 | BOLA2 | sample3 | Human | Cervix | CC | 1.14e-39 | 5.56e-01 | 0.1387 |
| 552900 | BOLA2 | H2 | Human | Cervix | HSIL_HPV | 3.63e-03 | 1.12e-01 | 0.0632 |
| 552900 | BOLA2 | L1 | Human | Cervix | CC | 8.39e-03 | 1.87e-01 | 0.0802 |
| 552900 | BOLA2 | T1 | Human | Cervix | CC | 5.18e-03 | 1.00e-01 | 0.0918 |
| 552900 | BOLA2 | T2 | Human | Cervix | CC | 4.10e-02 | 1.32e-01 | 0.0709 |
| 552900 | BOLA2 | T3 | Human | Cervix | CC | 4.67e-35 | 5.32e-01 | 0.1389 |
| 552900 | BOLA2 | LZE2T | Human | Esophagus | ESCC | 4.73e-03 | 3.08e-01 | 0.082 |
| 552900 | BOLA2 | LZE4T | Human | Esophagus | ESCC | 2.81e-19 | 4.90e-01 | 0.0811 |
| 552900 | BOLA2 | LZE5T | Human | Esophagus | ESCC | 1.40e-06 | 3.63e-01 | 0.0514 |
| 552900 | BOLA2 | LZE7T | Human | Esophagus | ESCC | 7.39e-21 | 7.86e-01 | 0.0667 |
| 552900 | BOLA2 | LZE8T | Human | Esophagus | ESCC | 1.17e-14 | 4.06e-01 | 0.067 |
| 552900 | BOLA2 | LZE20T | Human | Esophagus | ESCC | 6.96e-12 | 3.22e-01 | 0.0662 |
| 552900 | BOLA2 | LZE22T | Human | Esophagus | ESCC | 8.47e-11 | 5.62e-01 | 0.068 |
| 552900 | BOLA2 | LZE24T | Human | Esophagus | ESCC | 1.36e-34 | 7.88e-01 | 0.0596 |
| 552900 | BOLA2 | LZE21T | Human | Esophagus | ESCC | 1.57e-07 | 3.87e-01 | 0.0655 |
| 552900 | BOLA2 | LZE6T | Human | Esophagus | ESCC | 1.68e-22 | 6.85e-01 | 0.0845 |
| 552900 | BOLA2 | P17T-E | Human | Esophagus | ESCC | 4.79e-04 | 2.06e-01 | 0.1278 |
| 552900 | BOLA2 | P22T-E | Human | Esophagus | ESCC | 1.96e-05 | 1.32e-01 | 0.1236 |
| 552900 | BOLA2 | P36T-E | Human | Esophagus | ESCC | 2.11e-03 | 1.28e-01 | 0.1187 |
| 552900 | BOLA2 | P49T-E | Human | Esophagus | ESCC | 7.48e-03 | 2.50e-01 | 0.1768 |
| Page: 1 2 3 |
| Tissue | Expression Dynamics | Abbreviation |
| Cervix | 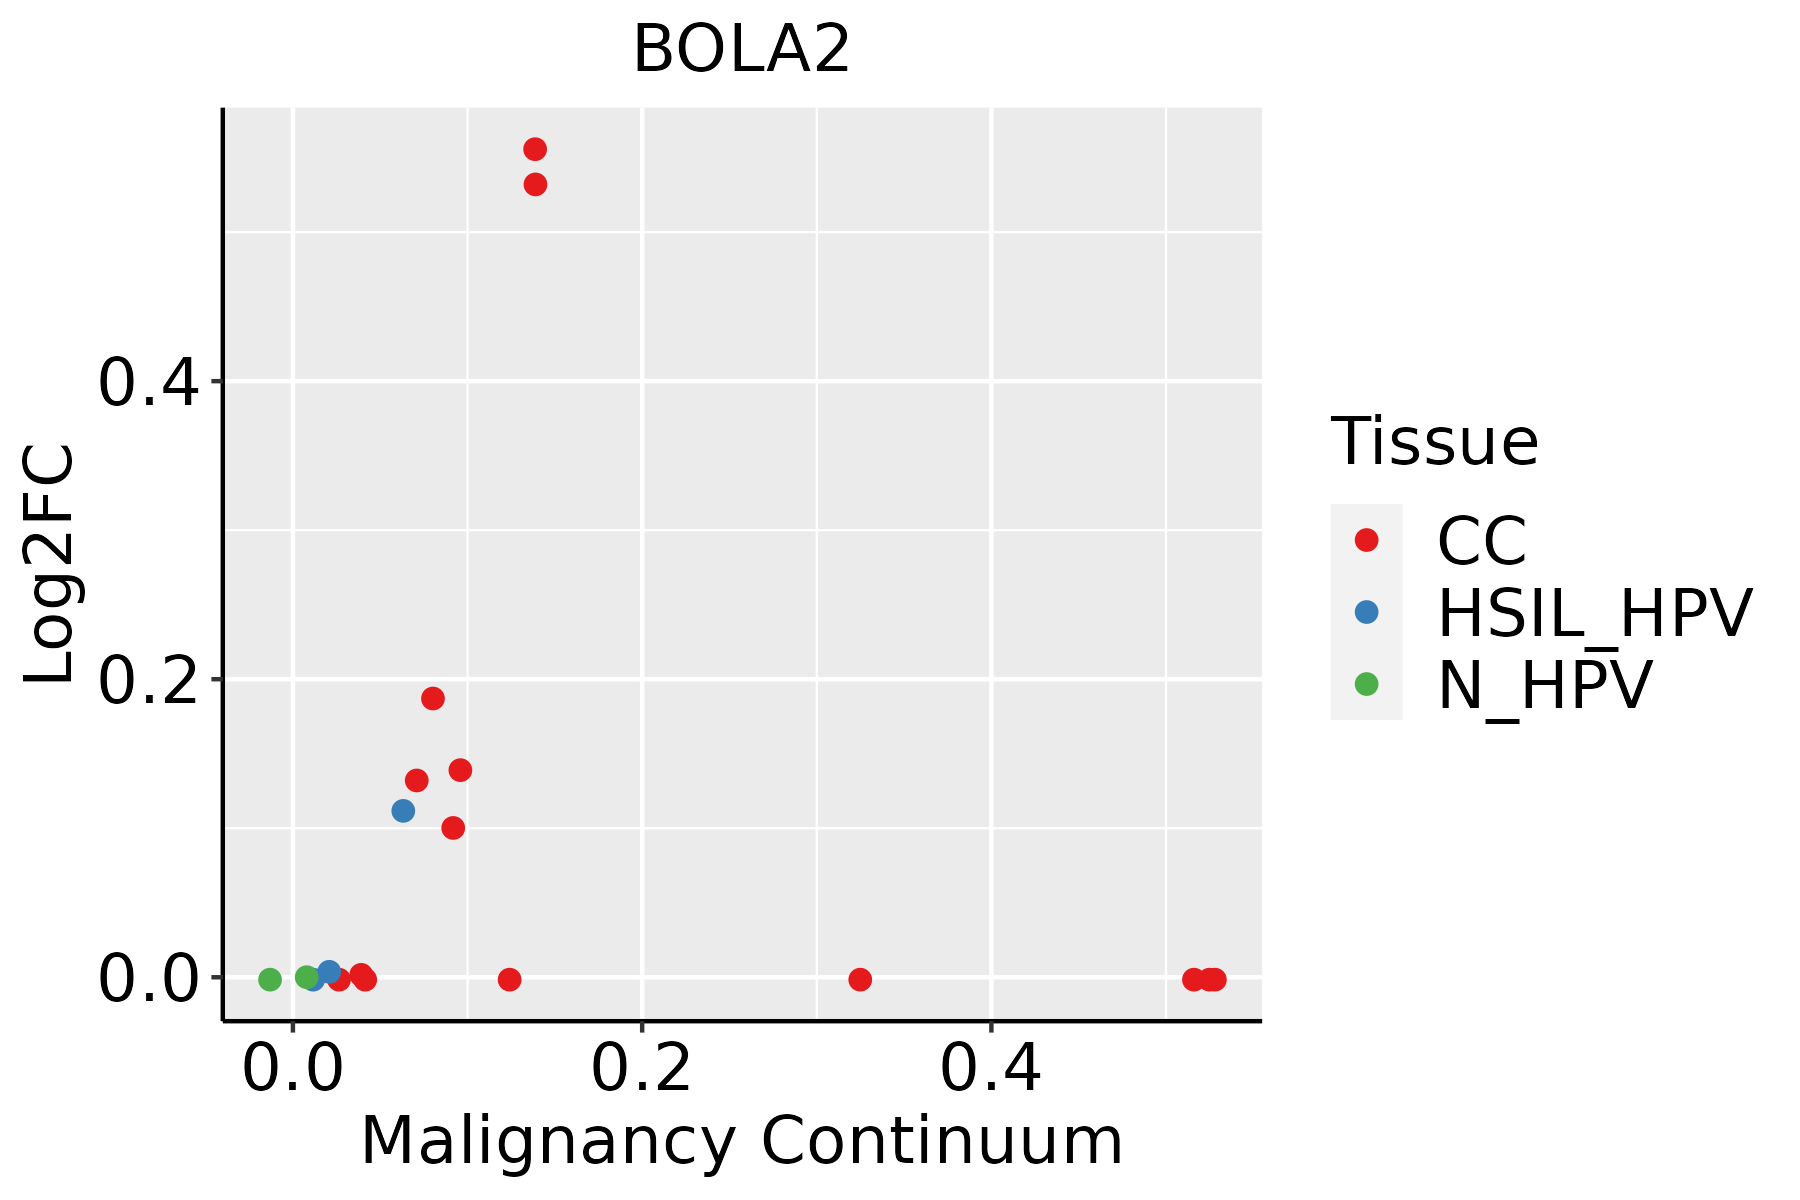 | CC: Cervix cancer |
| HSIL_HPV: HPV-infected high-grade squamous intraepithelial lesions | ||
| N_HPV: HPV-infected normal cervix | ||
| Esophagus | 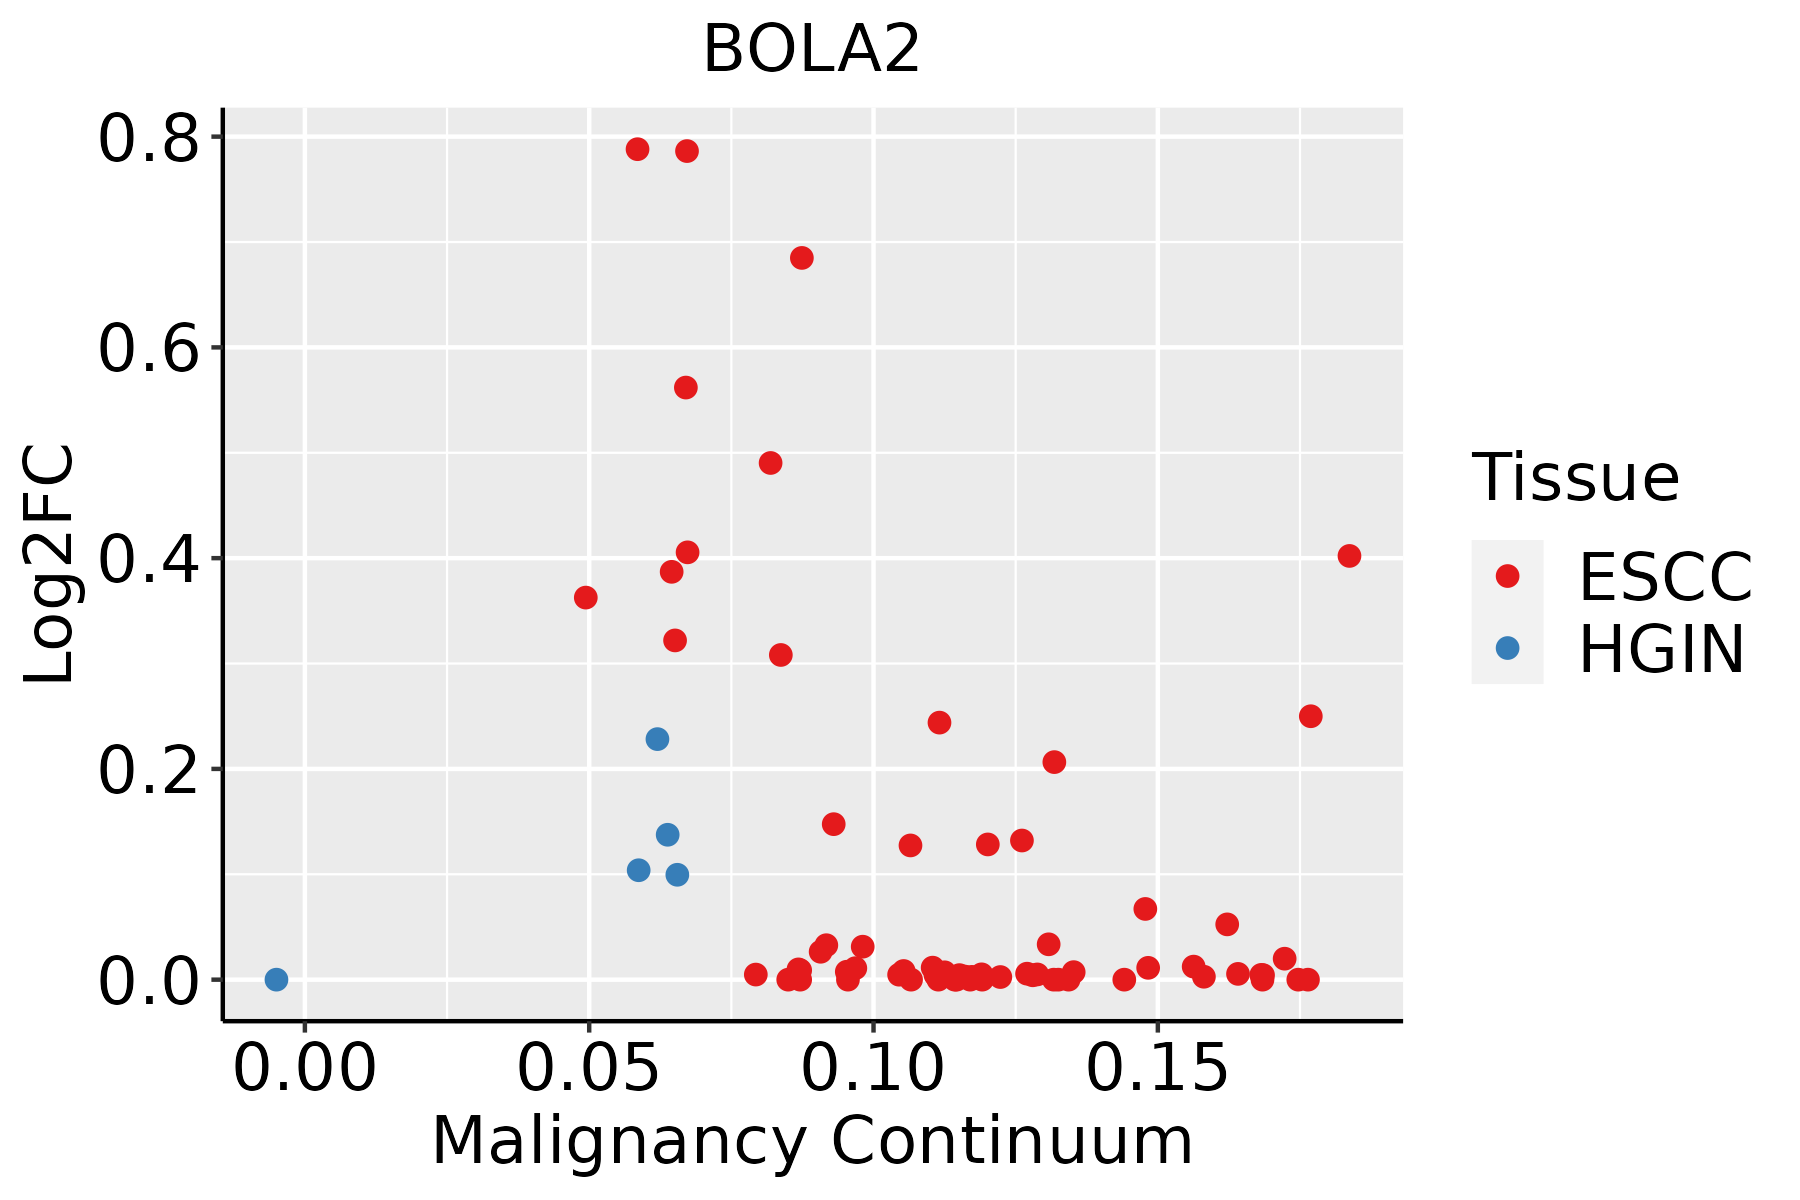 | ESCC: Esophageal squamous cell carcinoma |
| HGIN: High-grade intraepithelial neoplasias | ||
| LGIN: Low-grade intraepithelial neoplasias | ||
| GC | 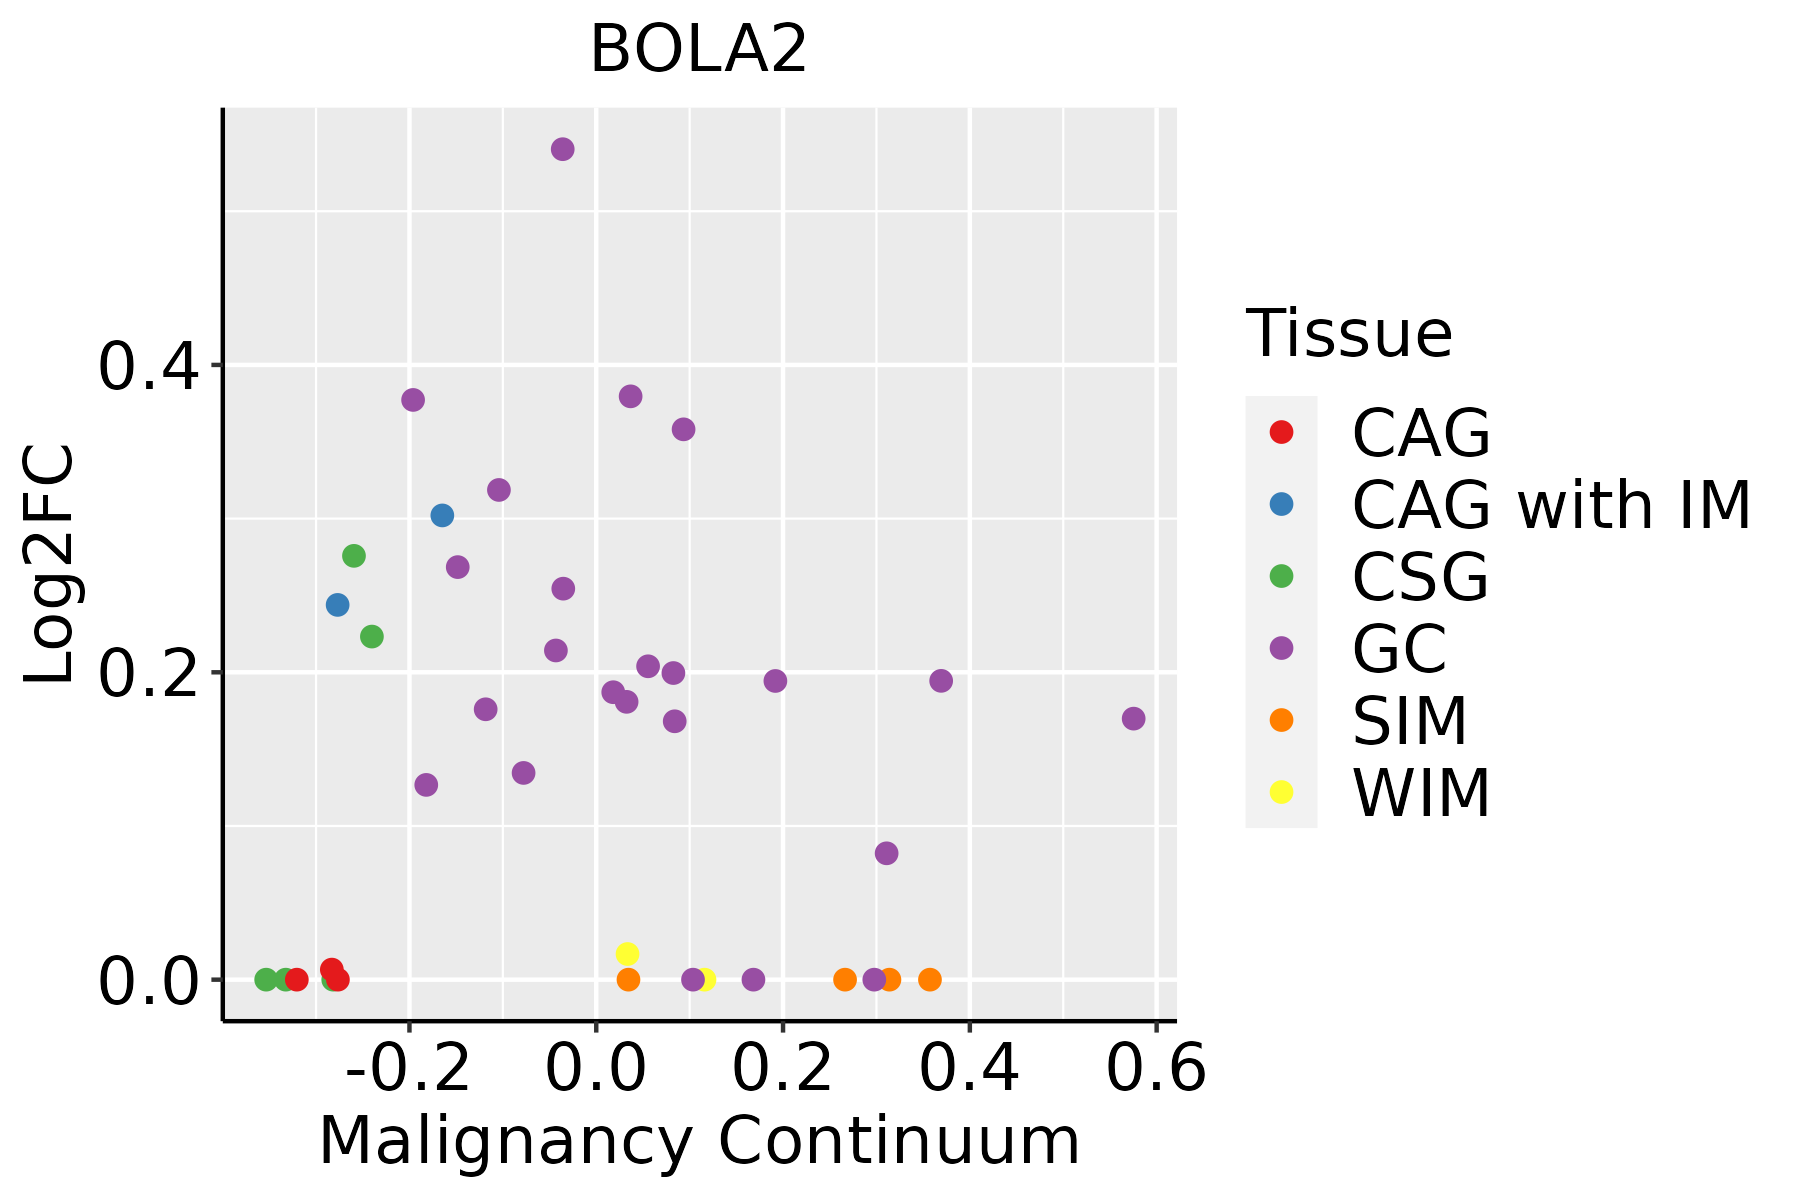 | CAG: Chronic atrophic gastritis |
| CAG with IM: Chronic atrophic gastritis with intestinal metaplasia | ||
| CSG: Chronic superficial gastritis | ||
| GC: Gastric cancer | ||
| SIM: Severe intestinal metaplasia | ||
| WIM: Wild intestinal metaplasia |
| ∗log2FC in expression of this searched gene in stem-like cells from each diseased tissue sample relative to stem-like cells in normal samples in each tissue plotted against the malignancy continuum. Samples are colored based on if they are from different disease stage. |
Top |
Malignant transformation related pathway analysis |
| Find out the enriched GO biological processes and KEGG pathways involved in transition from healthy to precancer to cancer |
| Tissue | Disease Stage | Enriched GO biological Processes |
| Cervix | N_HPV |  |
| Endometrium | AEH |  |
| Endometrium | EEC |  |
| Prostate | BPH |  |
| Prostate | Tumor |  |
| ∗Top 15 enriched GO BP terms are showed in the bar plot of each disease state in each tissue. Each row represents a significant GO biological process which is colored according to the -log10(p.adjust). |
| Page: 1 2 3 4 5 6 7 8 9 |
| GO ID | Tissue | Disease Stage | Description | Gene Ratio | Bg Ratio | pvalue | p.adjust | Count |
| GO:00516048 | Cervix | CC | protein maturation | 56/2311 | 294/18723 | 5.90e-04 | 5.59e-03 | 56 |
| GO:00550726 | Cervix | CC | iron ion homeostasis | 19/2311 | 85/18723 | 6.88e-03 | 3.74e-02 | 19 |
| GO:00550768 | Cervix | CC | transition metal ion homeostasis | 27/2311 | 138/18723 | 9.89e-03 | 4.85e-02 | 27 |
| GO:00469166 | Cervix | HSIL_HPV | cellular transition metal ion homeostasis | 13/737 | 115/18723 | 5.95e-04 | 8.37e-03 | 13 |
| GO:005507614 | Cervix | HSIL_HPV | transition metal ion homeostasis | 14/737 | 138/18723 | 1.10e-03 | 1.36e-02 | 14 |
| GO:0055076 | Colorectum | AD | transition metal ion homeostasis | 53/3918 | 138/18723 | 1.89e-06 | 5.65e-05 | 53 |
| GO:0046916 | Colorectum | AD | cellular transition metal ion homeostasis | 43/3918 | 115/18723 | 3.62e-05 | 6.56e-04 | 43 |
| GO:0006790 | Colorectum | AD | sulfur compound metabolic process | 101/3918 | 339/18723 | 6.46e-05 | 1.07e-03 | 101 |
| GO:0055072 | Colorectum | AD | iron ion homeostasis | 32/3918 | 85/18723 | 2.97e-04 | 3.60e-03 | 32 |
| GO:0051604 | Colorectum | AD | protein maturation | 85/3918 | 294/18723 | 6.73e-04 | 6.91e-03 | 85 |
| GO:0006879 | Colorectum | AD | cellular iron ion homeostasis | 25/3918 | 67/18723 | 1.51e-03 | 1.27e-02 | 25 |
| GO:00550761 | Colorectum | SER | transition metal ion homeostasis | 41/2897 | 138/18723 | 1.66e-05 | 5.05e-04 | 41 |
| GO:00516041 | Colorectum | SER | protein maturation | 73/2897 | 294/18723 | 1.82e-05 | 5.38e-04 | 73 |
| GO:00469161 | Colorectum | SER | cellular transition metal ion homeostasis | 33/2897 | 115/18723 | 2.20e-04 | 3.89e-03 | 33 |
| GO:00067901 | Colorectum | SER | sulfur compound metabolic process | 73/2897 | 339/18723 | 1.75e-03 | 1.81e-02 | 73 |
| GO:00550721 | Colorectum | SER | iron ion homeostasis | 24/2897 | 85/18723 | 1.91e-03 | 1.93e-02 | 24 |
| GO:00550762 | Colorectum | MSS | transition metal ion homeostasis | 45/3467 | 138/18723 | 4.99e-05 | 9.02e-04 | 45 |
| GO:00550722 | Colorectum | MSS | iron ion homeostasis | 29/3467 | 85/18723 | 4.44e-04 | 5.32e-03 | 29 |
| GO:00469162 | Colorectum | MSS | cellular transition metal ion homeostasis | 35/3467 | 115/18723 | 1.33e-03 | 1.26e-02 | 35 |
| GO:00067902 | Colorectum | MSS | sulfur compound metabolic process | 85/3467 | 339/18723 | 1.52e-03 | 1.39e-02 | 85 |
| Page: 1 2 3 |
| Pathway ID | Tissue | Disease Stage | Description | Gene Ratio | Bg Ratio | pvalue | p.adjust | qvalue | Count |
| Page: 1 |
Top |
Cell-cell communication analysis |
| Identification of potential cell-cell interactions between two cell types and their ligand-receptor pairs for different disease states |
| Ligand | Receptor | LRpair | Pathway | Tissue | Disease Stage |
| Page: 1 |
Top |
Single-cell gene regulatory network inference analysis |
| Find out the significant the regulons (TFs) and the target genes of each regulon across cell types for different disease states |
| TF | Cell Type | Tissue | Disease Stage | Target Gene | RSS | Regulon Activity |
| ∗The dot plots of a searched regulon are shown for all cell subpopulations in each disease state of each tissue based on the regulon specific score inferred using pySCENIC and by calculating the average expression. |
| Page: 1 |
Top |
Somatic mutation of malignant transformation related genes |
| Annotation of somatic variants for genes involved in malignant transformation |
| Hugo Symbol | Variant Class | Variant Classification | dbSNP RS | HGVSc | HGVSp | HGVSp Short | SWISSPROT | BIOTYPE | SIFT | PolyPhen | Tumor Sample Barcode | Tissue | Histology | Sex | Age | Stage | Therapy Types | Drugs | Outcome |
| Page: 1 |
Top |
Related drugs of malignant transformation related genes |
| Identification of chemicals and drugs interact with genes involved in malignant transfromation |
| (DGIdb 4.0) |
| Entrez ID | Symbol | Category | Interaction Types | Drug Claim Name | Drug Name | PMIDs |
| Page: 1 |

Copyright 2023-Present -The University of Texas Health Science Center at Houston |