
|
|||||
|
 | |
| |
| |
| |
| |
| |
|
Gene: ZNF580 |
Gene summary for ZNF580 |
| Gene information | Species | Human | Gene symbol | ZNF580 | Gene ID | 51157 |
| Gene name | zinc finger protein 580 | |
| Gene Alias | ZNF580 | |
| Cytomap | 19q13.42 | |
| Gene Type | protein-coding | GO ID | GO:0000302 | UniProtAcc | Q9UK33 |
Top |
Malignant transformation analysis |
| Identification of the aberrant gene expression in precancerous and cancerous lesions by comparing the gene expression of stem-like cells in diseased tissues with normal stem cells |
| Entrez ID | Symbol | Replicates | Species | Organ | Tissue | Adj P-value | Log2FC | Malignancy |
| 51157 | ZNF580 | LZE4T | Human | Esophagus | ESCC | 3.96e-10 | 3.77e-01 | 0.0811 |
| 51157 | ZNF580 | LZE5T | Human | Esophagus | ESCC | 3.43e-02 | 3.00e-01 | 0.0514 |
| 51157 | ZNF580 | LZE20T | Human | Esophagus | ESCC | 4.30e-04 | 2.63e-01 | 0.0662 |
| 51157 | ZNF580 | LZE24T | Human | Esophagus | ESCC | 7.90e-23 | 5.14e-01 | 0.0596 |
| 51157 | ZNF580 | P1T-E | Human | Esophagus | ESCC | 2.91e-15 | 8.09e-01 | 0.0875 |
| 51157 | ZNF580 | P2T-E | Human | Esophagus | ESCC | 5.29e-54 | 8.11e-01 | 0.1177 |
| 51157 | ZNF580 | P4T-E | Human | Esophagus | ESCC | 2.08e-21 | 6.92e-01 | 0.1323 |
| 51157 | ZNF580 | P5T-E | Human | Esophagus | ESCC | 1.34e-18 | 3.52e-01 | 0.1327 |
| 51157 | ZNF580 | P8T-E | Human | Esophagus | ESCC | 9.72e-98 | 1.70e+00 | 0.0889 |
| 51157 | ZNF580 | P9T-E | Human | Esophagus | ESCC | 3.00e-12 | 4.53e-01 | 0.1131 |
| 51157 | ZNF580 | P10T-E | Human | Esophagus | ESCC | 3.51e-88 | 1.24e+00 | 0.116 |
| 51157 | ZNF580 | P11T-E | Human | Esophagus | ESCC | 7.67e-16 | 9.95e-01 | 0.1426 |
| 51157 | ZNF580 | P12T-E | Human | Esophagus | ESCC | 6.17e-56 | 1.03e+00 | 0.1122 |
| 51157 | ZNF580 | P15T-E | Human | Esophagus | ESCC | 5.93e-50 | 1.28e+00 | 0.1149 |
| 51157 | ZNF580 | P16T-E | Human | Esophagus | ESCC | 7.11e-43 | 6.62e-01 | 0.1153 |
| 51157 | ZNF580 | P17T-E | Human | Esophagus | ESCC | 1.23e-13 | 7.45e-01 | 0.1278 |
| 51157 | ZNF580 | P19T-E | Human | Esophagus | ESCC | 9.24e-09 | 9.50e-01 | 0.1662 |
| 51157 | ZNF580 | P20T-E | Human | Esophagus | ESCC | 5.77e-22 | 5.05e-01 | 0.1124 |
| 51157 | ZNF580 | P21T-E | Human | Esophagus | ESCC | 3.36e-42 | 7.39e-01 | 0.1617 |
| 51157 | ZNF580 | P22T-E | Human | Esophagus | ESCC | 1.27e-83 | 1.34e+00 | 0.1236 |
| Page: 1 2 3 4 5 6 |
| Tissue | Expression Dynamics | Abbreviation |
| Esophagus |  | ESCC: Esophageal squamous cell carcinoma |
| HGIN: High-grade intraepithelial neoplasias | ||
| LGIN: Low-grade intraepithelial neoplasias | ||
| Liver | 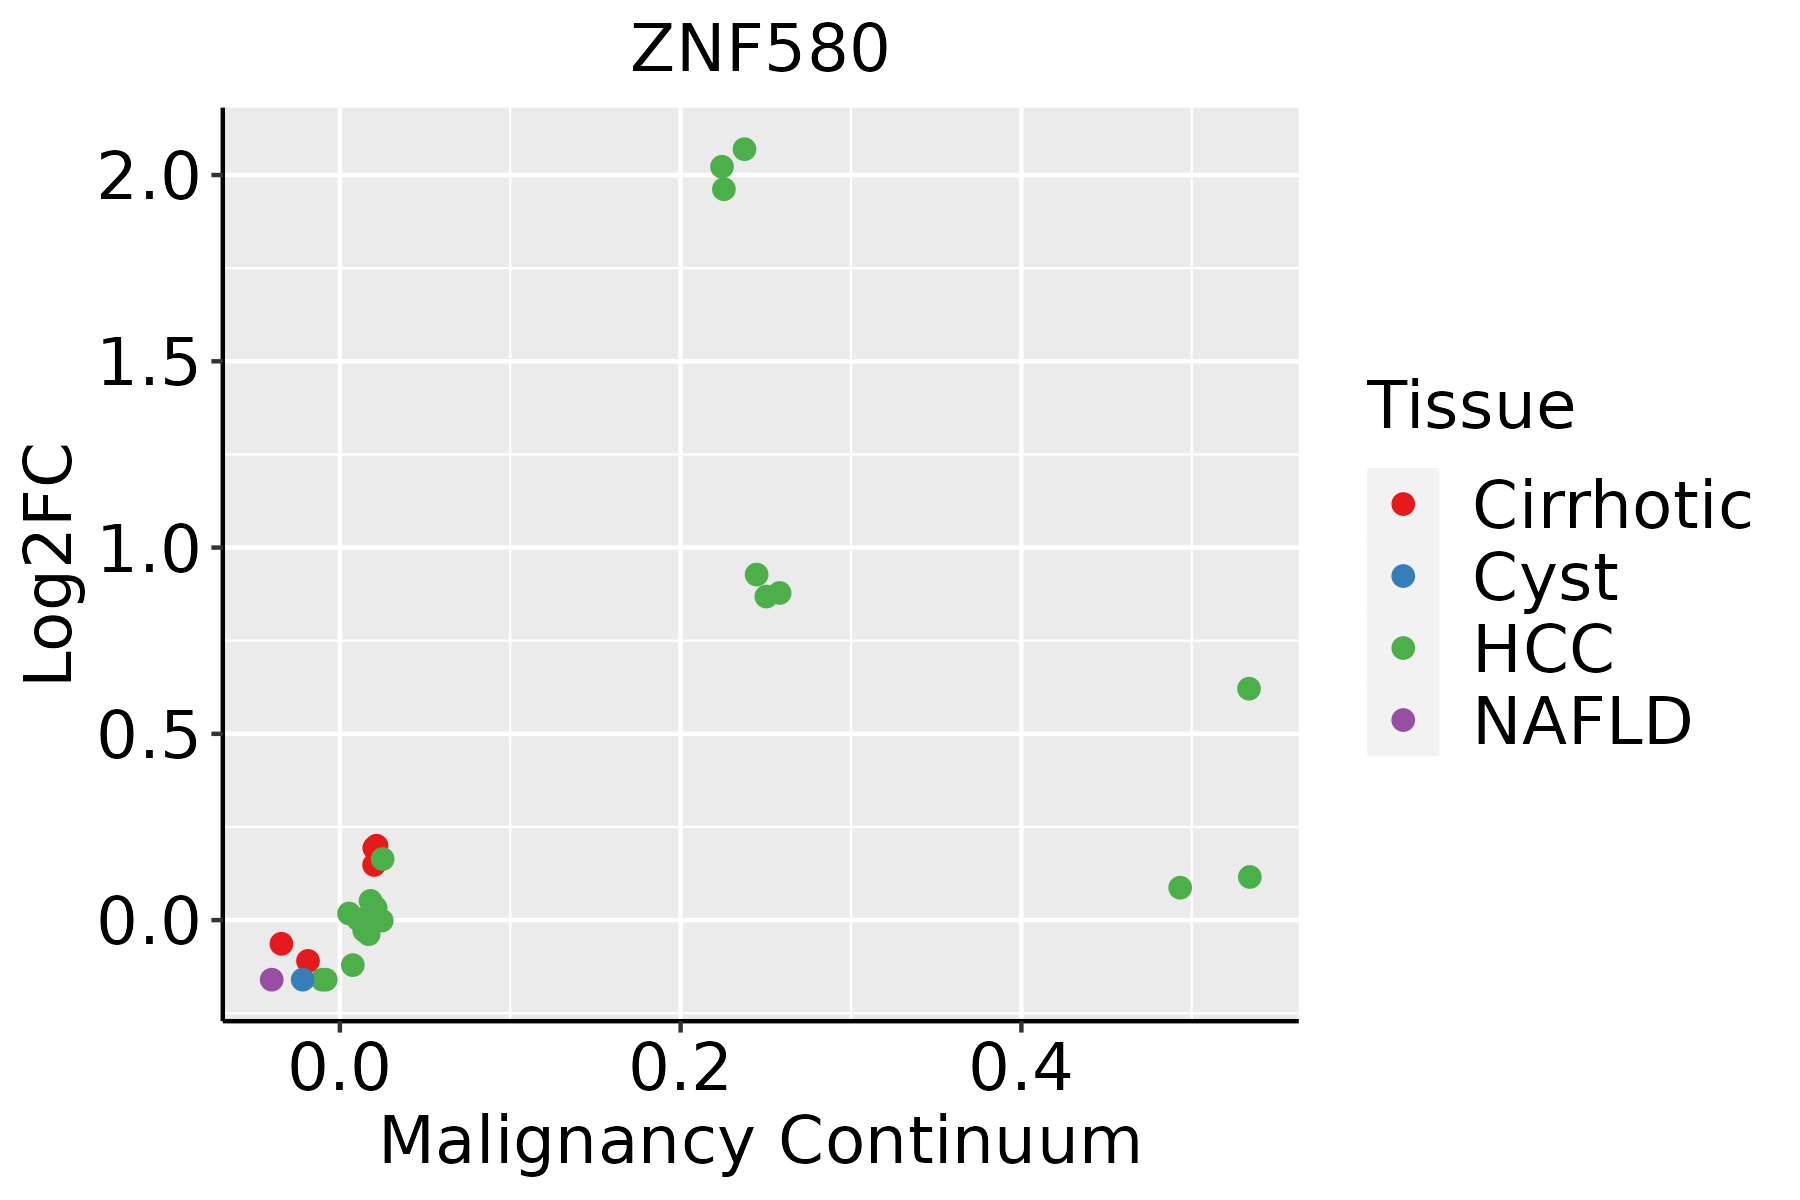 | HCC: Hepatocellular carcinoma |
| NAFLD: Non-alcoholic fatty liver disease | ||
| Oral Cavity | 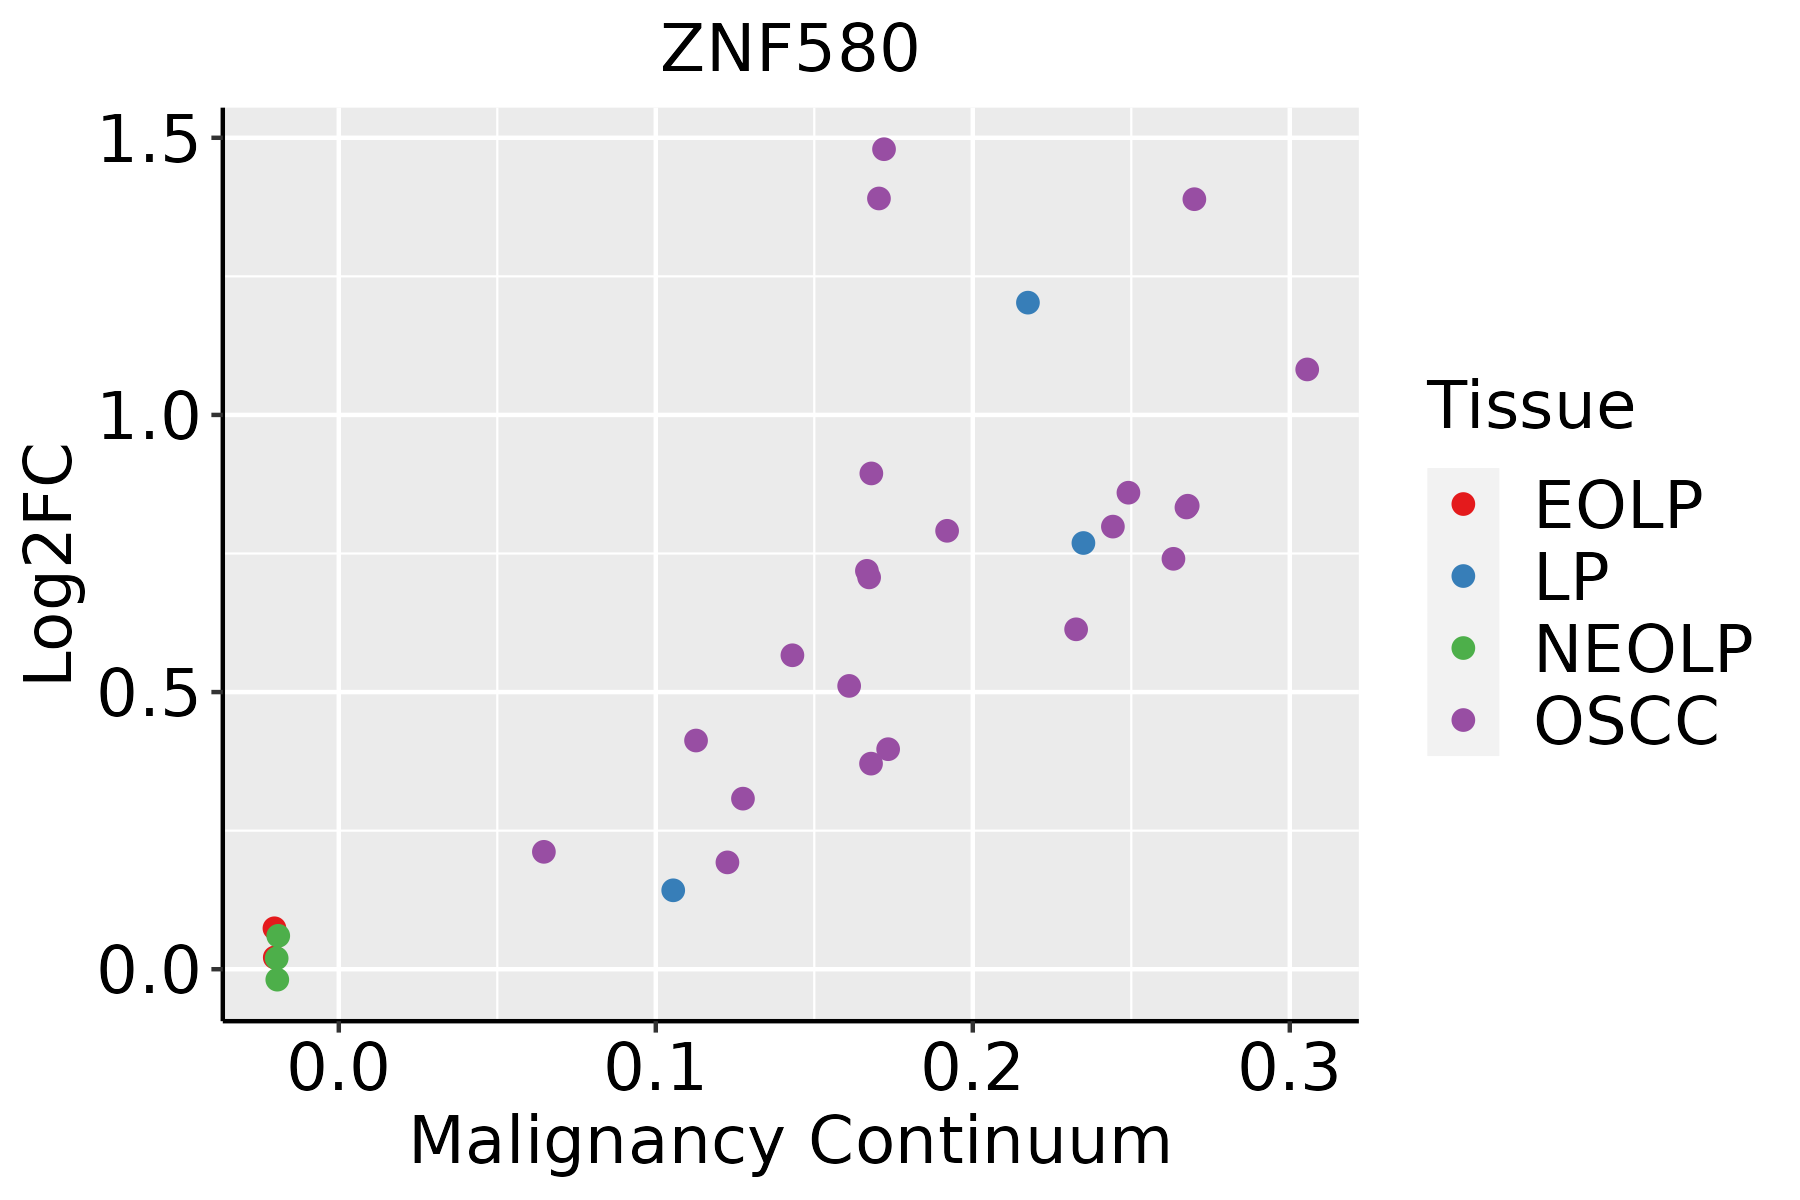 | EOLP: Erosive Oral lichen planus |
| LP: leukoplakia | ||
| NEOLP: Non-erosive oral lichen planus | ||
| OSCC: Oral squamous cell carcinoma | ||
| Skin | 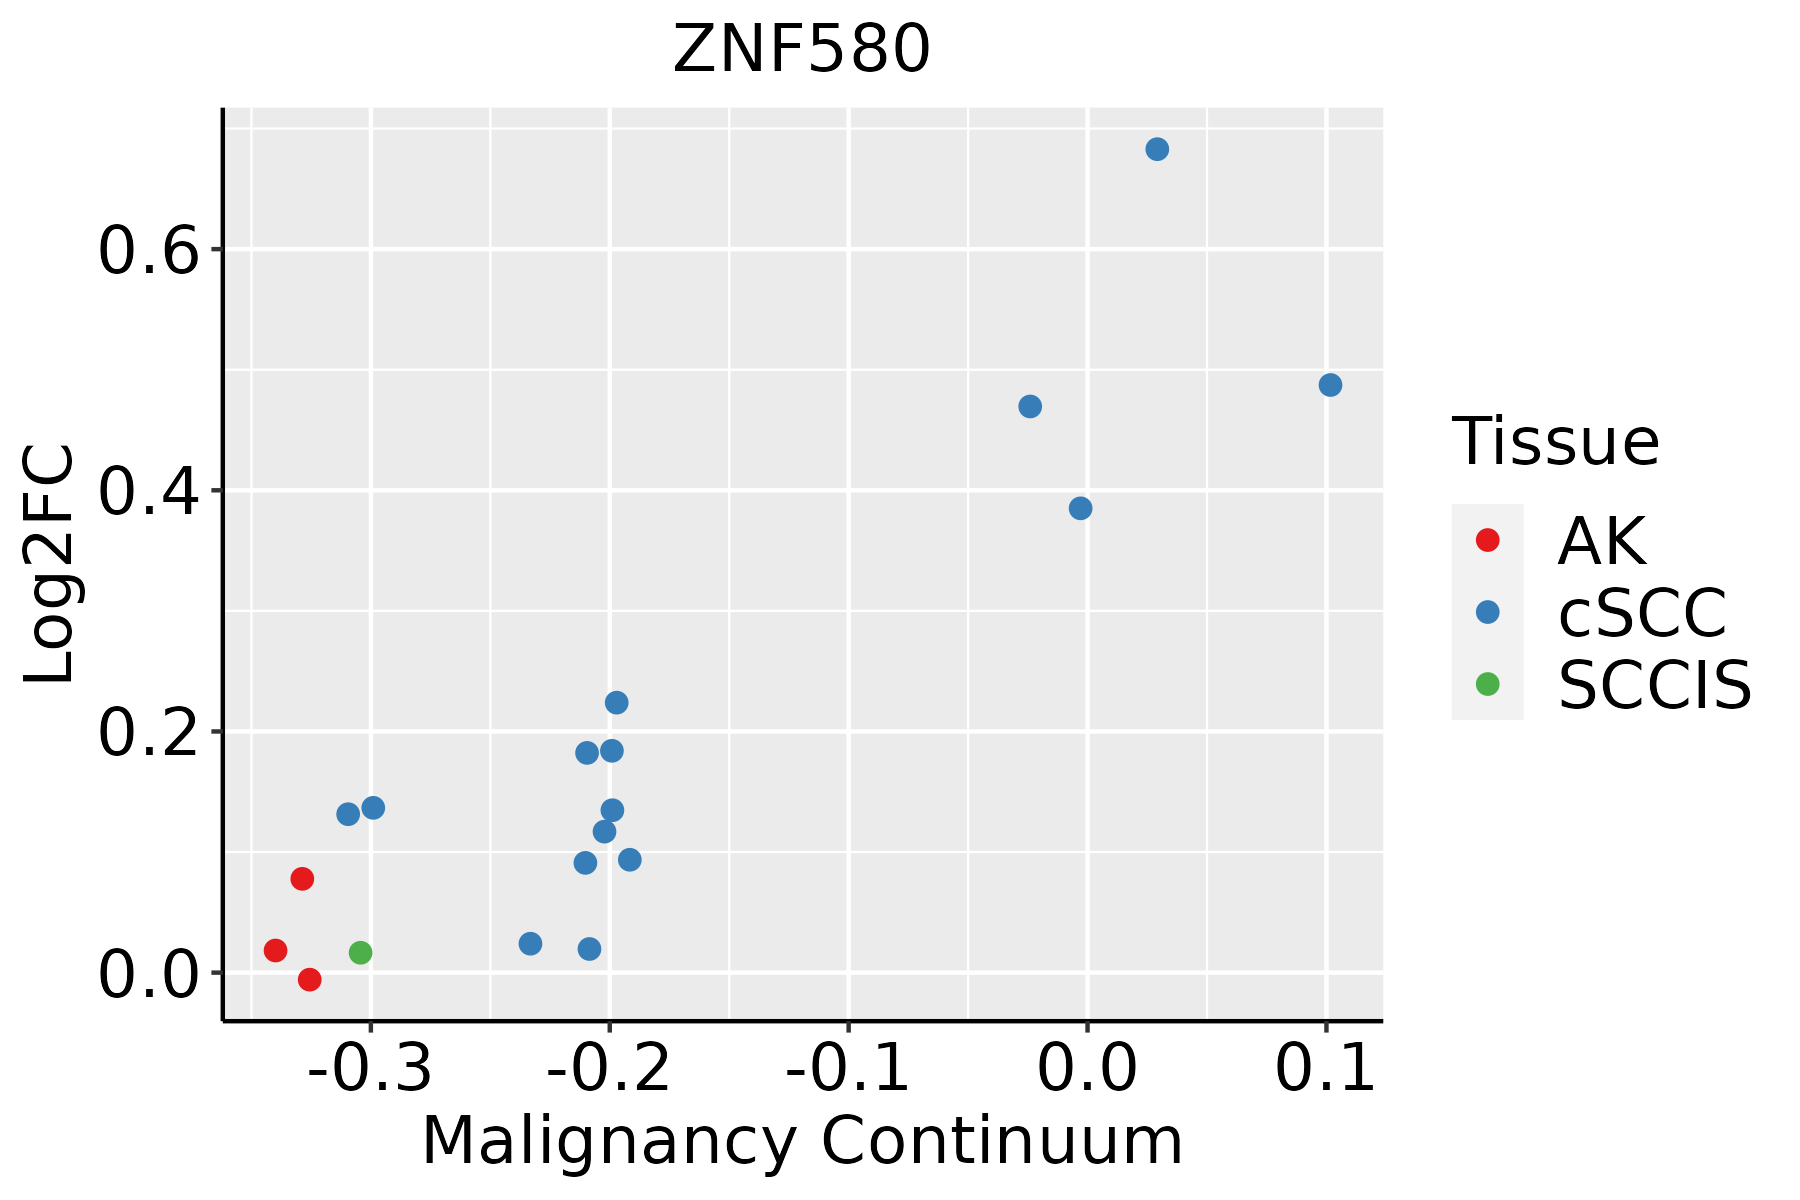 | AK: Actinic keratosis |
| cSCC: Cutaneous squamous cell carcinoma | ||
| SCCIS:squamous cell carcinoma in situ | ||
| Thyroid |  | ATC: Anaplastic thyroid cancer |
| HT: Hashimoto's thyroiditis | ||
| PTC: Papillary thyroid cancer |
| ∗log2FC in expression of this searched gene in stem-like cells from each diseased tissue sample relative to stem-like cells in normal samples in each tissue plotted against the malignancy continuum. Samples are colored based on if they are from different disease stage. |
Top |
Malignant transformation related pathway analysis |
| Find out the enriched GO biological processes and KEGG pathways involved in transition from healthy to precancer to cancer |
| Tissue | Disease Stage | Enriched GO biological Processes |
| Breast | Precancer |  |
| Breast | IDC |  |
| Breast | DCIS |  |
| Cervix | CC |  |
| Cervix | HSIL_HPV |  |
| ∗Top 15 enriched GO BP terms are showed in the bar plot of each disease state in each tissue. Each row represents a significant GO biological process which is colored according to the -log10(p.adjust). |
| Page: 1 2 3 4 5 6 7 8 9 |
| GO ID | Tissue | Disease Stage | Description | Gene Ratio | Bg Ratio | pvalue | p.adjust | Count |
| GO:0006979111 | Esophagus | ESCC | response to oxidative stress | 303/8552 | 446/18723 | 7.15e-22 | 1.30e-19 | 303 |
| GO:0062197111 | Esophagus | ESCC | cellular response to chemical stress | 234/8552 | 337/18723 | 5.37e-19 | 5.97e-17 | 234 |
| GO:0034599111 | Esophagus | ESCC | cellular response to oxidative stress | 197/8552 | 288/18723 | 3.76e-15 | 2.15e-13 | 197 |
| GO:0000302111 | Esophagus | ESCC | response to reactive oxygen species | 150/8552 | 222/18723 | 3.06e-11 | 1.02e-09 | 150 |
| GO:0042542111 | Esophagus | ESCC | response to hydrogen peroxide | 102/8552 | 146/18723 | 2.64e-09 | 5.81e-08 | 102 |
| GO:003461420 | Esophagus | ESCC | cellular response to reactive oxygen species | 103/8552 | 155/18723 | 1.34e-07 | 2.17e-06 | 103 |
| GO:00703018 | Esophagus | ESCC | cellular response to hydrogen peroxide | 68/8552 | 98/18723 | 1.70e-06 | 2.03e-05 | 68 |
| GO:005067318 | Esophagus | ESCC | epithelial cell proliferation | 238/8552 | 437/18723 | 1.19e-04 | 8.20e-04 | 238 |
| GO:005067817 | Esophagus | ESCC | regulation of epithelial cell proliferation | 206/8552 | 381/18723 | 5.51e-04 | 3.02e-03 | 206 |
| GO:000166720 | Esophagus | ESCC | ameboidal-type cell migration | 250/8552 | 475/18723 | 1.22e-03 | 5.97e-03 | 250 |
| GO:000181916 | Esophagus | ESCC | positive regulation of cytokine production | 244/8552 | 467/18723 | 2.29e-03 | 1.01e-02 | 244 |
| GO:001063120 | Esophagus | ESCC | epithelial cell migration | 187/8552 | 357/18723 | 6.05e-03 | 2.23e-02 | 187 |
| GO:009013220 | Esophagus | ESCC | epithelium migration | 188/8552 | 360/18723 | 6.96e-03 | 2.54e-02 | 188 |
| GO:000268515 | Esophagus | ESCC | regulation of leukocyte migration | 114/8552 | 210/18723 | 7.26e-03 | 2.63e-02 | 114 |
| GO:009013020 | Esophagus | ESCC | tissue migration | 190/8552 | 365/18723 | 7.91e-03 | 2.82e-02 | 190 |
| GO:000697912 | Liver | Cirrhotic | response to oxidative stress | 196/4634 | 446/18723 | 2.80e-19 | 5.86e-17 | 196 |
| GO:006219712 | Liver | Cirrhotic | cellular response to chemical stress | 147/4634 | 337/18723 | 1.84e-14 | 1.72e-12 | 147 |
| GO:003459912 | Liver | Cirrhotic | cellular response to oxidative stress | 127/4634 | 288/18723 | 4.29e-13 | 3.32e-11 | 127 |
| GO:000030212 | Liver | Cirrhotic | response to reactive oxygen species | 100/4634 | 222/18723 | 2.92e-11 | 1.73e-09 | 100 |
| GO:004254212 | Liver | Cirrhotic | response to hydrogen peroxide | 71/4634 | 146/18723 | 3.40e-10 | 1.63e-08 | 71 |
| Page: 1 2 3 4 5 6 7 |
| Pathway ID | Tissue | Disease Stage | Description | Gene Ratio | Bg Ratio | pvalue | p.adjust | qvalue | Count |
| Page: 1 |
Top |
Cell-cell communication analysis |
| Identification of potential cell-cell interactions between two cell types and their ligand-receptor pairs for different disease states |
| Ligand | Receptor | LRpair | Pathway | Tissue | Disease Stage |
| Page: 1 |
Top |
Single-cell gene regulatory network inference analysis |
| Find out the significant the regulons (TFs) and the target genes of each regulon across cell types for different disease states |
| TF | Cell Type | Tissue | Disease Stage | Target Gene | RSS | Regulon Activity |
| ZNF580 | CAF | Cervix | ADJ | SLC25A11,SERTM1,FOXO6, etc. | 1.77e-01 |  |
| ZNF580 | MVA | Liver | Healthy | HES4,MCAM,COL18A1, etc. | 5.80e-02 |  |
| ∗The dot plots of a searched regulon are shown for all cell subpopulations in each disease state of each tissue based on the regulon specific score inferred using pySCENIC and by calculating the average expression. |
| Page: 1 |
Top |
Somatic mutation of malignant transformation related genes |
| Annotation of somatic variants for genes involved in malignant transformation |
| Hugo Symbol | Variant Class | Variant Classification | dbSNP RS | HGVSc | HGVSp | HGVSp Short | SWISSPROT | BIOTYPE | SIFT | PolyPhen | Tumor Sample Barcode | Tissue | Histology | Sex | Age | Stage | Therapy Types | Drugs | Outcome |
| Page: 1 |
Top |
Related drugs of malignant transformation related genes |
| Identification of chemicals and drugs interact with genes involved in malignant transfromation |
| (DGIdb 4.0) |
| Entrez ID | Symbol | Category | Interaction Types | Drug Claim Name | Drug Name | PMIDs |
| Page: 1 |

Copyright 2023-Present -The University of Texas Health Science Center at Houston |