
|
|||||
|
 | |
| |
| |
| |
| |
| |
|
Gene: U2AF1L5 |
Gene summary for U2AF1L5 |
| Gene information | Species | Human | Gene symbol | U2AF1L5 | Gene ID | 102724594 |
| Gene name | U2 small nuclear RNA auxiliary factor 1 like 5 | |
| Gene Alias | U2AF1L5 | |
| Cytomap | 21p12 | |
| Gene Type | protein-coding | GO ID | GO:0000375 | UniProtAcc | P0DN76 |
Top |
Malignant transformation analysis |
| Identification of the aberrant gene expression in precancerous and cancerous lesions by comparing the gene expression of stem-like cells in diseased tissues with normal stem cells |
| Entrez ID | Symbol | Replicates | Species | Organ | Tissue | Adj P-value | Log2FC | Malignancy |
| 102724594 | U2AF1L5 | HTA11_3410_2000001011 | Human | Colorectum | AD | 1.74e-27 | 5.97e-01 | 0.0155 |
| 102724594 | U2AF1L5 | HTA11_2487_2000001011 | Human | Colorectum | SER | 8.12e-37 | 9.95e-01 | -0.1808 |
| 102724594 | U2AF1L5 | HTA11_2951_2000001011 | Human | Colorectum | AD | 6.69e-11 | 8.43e-01 | 0.0216 |
| 102724594 | U2AF1L5 | HTA11_1938_2000001011 | Human | Colorectum | AD | 3.37e-41 | 1.27e+00 | -0.0811 |
| 102724594 | U2AF1L5 | HTA11_78_2000001011 | Human | Colorectum | AD | 2.92e-27 | 8.26e-01 | -0.1088 |
| 102724594 | U2AF1L5 | HTA11_347_2000001011 | Human | Colorectum | AD | 4.57e-58 | 1.14e+00 | -0.1954 |
| 102724594 | U2AF1L5 | HTA11_411_2000001011 | Human | Colorectum | SER | 4.42e-15 | 1.26e+00 | -0.2602 |
| 102724594 | U2AF1L5 | HTA11_2112_2000001011 | Human | Colorectum | SER | 1.60e-06 | 7.46e-01 | -0.2196 |
| 102724594 | U2AF1L5 | HTA11_3361_2000001011 | Human | Colorectum | AD | 3.11e-20 | 8.71e-01 | -0.1207 |
| 102724594 | U2AF1L5 | HTA11_83_2000001011 | Human | Colorectum | SER | 3.43e-25 | 9.34e-01 | -0.1526 |
| 102724594 | U2AF1L5 | HTA11_696_2000001011 | Human | Colorectum | AD | 1.96e-53 | 1.16e+00 | -0.1464 |
| 102724594 | U2AF1L5 | HTA11_866_2000001011 | Human | Colorectum | AD | 6.44e-38 | 8.11e-01 | -0.1001 |
| 102724594 | U2AF1L5 | HTA11_1391_2000001011 | Human | Colorectum | AD | 1.39e-53 | 1.40e+00 | -0.059 |
| 102724594 | U2AF1L5 | HTA11_2992_2000001011 | Human | Colorectum | SER | 7.17e-17 | 8.61e-01 | -0.1706 |
| 102724594 | U2AF1L5 | HTA11_5212_2000001011 | Human | Colorectum | AD | 1.29e-11 | 8.15e-01 | -0.2061 |
| 102724594 | U2AF1L5 | HTA11_5216_2000001011 | Human | Colorectum | SER | 6.16e-12 | 8.06e-01 | -0.1462 |
| 102724594 | U2AF1L5 | HTA11_546_2000001011 | Human | Colorectum | AD | 1.92e-20 | 9.50e-01 | -0.0842 |
| 102724594 | U2AF1L5 | HTA11_9341_2000001011 | Human | Colorectum | SER | 3.23e-04 | 6.40e-01 | -0.00410000000000005 |
| 102724594 | U2AF1L5 | HTA11_7862_2000001011 | Human | Colorectum | AD | 2.08e-26 | 1.01e+00 | -0.0179 |
| 102724594 | U2AF1L5 | HTA11_866_3004761011 | Human | Colorectum | AD | 2.04e-47 | 1.17e+00 | 0.096 |
| Page: 1 2 3 4 |
| Tissue | Expression Dynamics | Abbreviation |
| Colorectum (GSE201348) |  | FAP: Familial adenomatous polyposis |
| CRC: Colorectal cancer | ||
| Colorectum (HTA11) |  | AD: Adenomas |
| SER: Sessile serrated lesions | ||
| MSI-H: Microsatellite-high colorectal cancer | ||
| MSS: Microsatellite stable colorectal cancer | ||
| Endometrium | 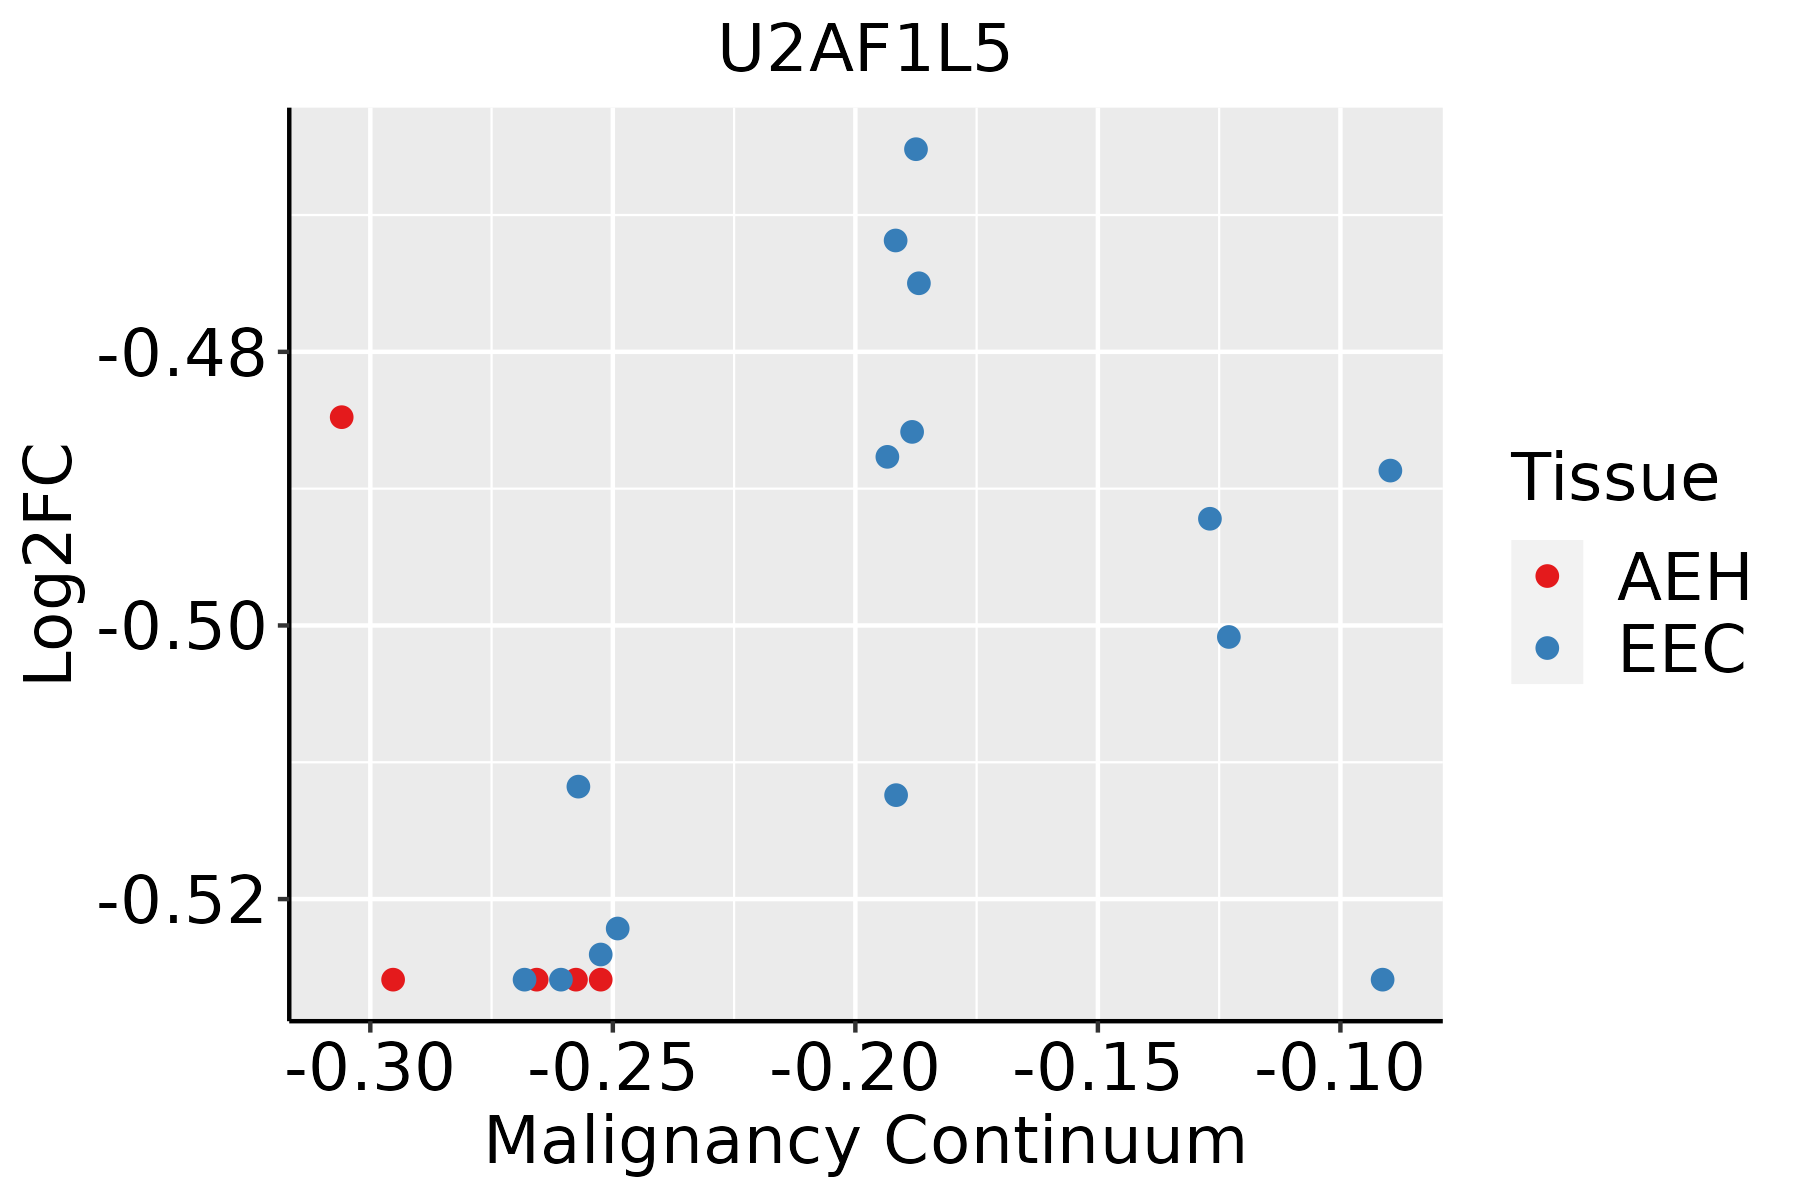 | AEH: Atypical endometrial hyperplasia |
| EEC: Endometrioid Cancer | ||
| Esophagus | 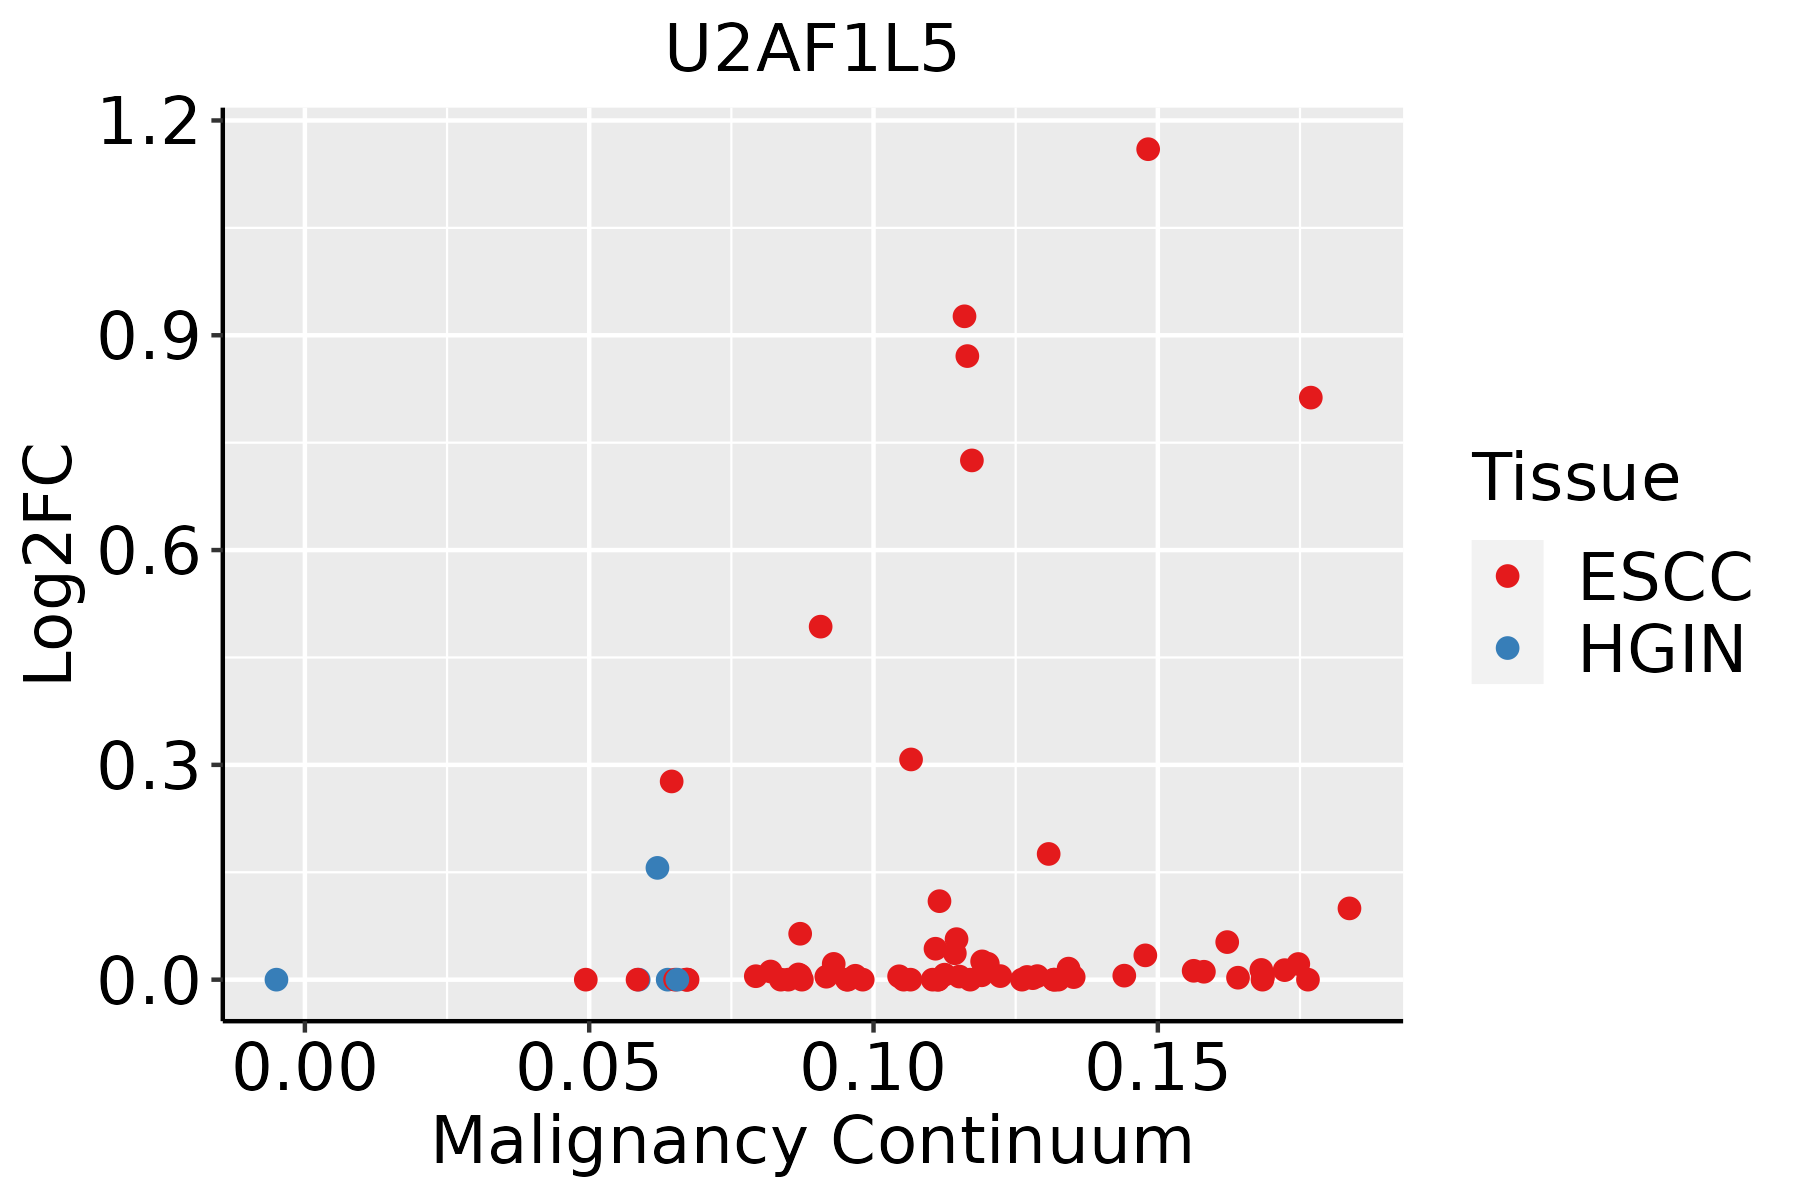 | ESCC: Esophageal squamous cell carcinoma |
| HGIN: High-grade intraepithelial neoplasias | ||
| LGIN: Low-grade intraepithelial neoplasias | ||
| Thyroid | 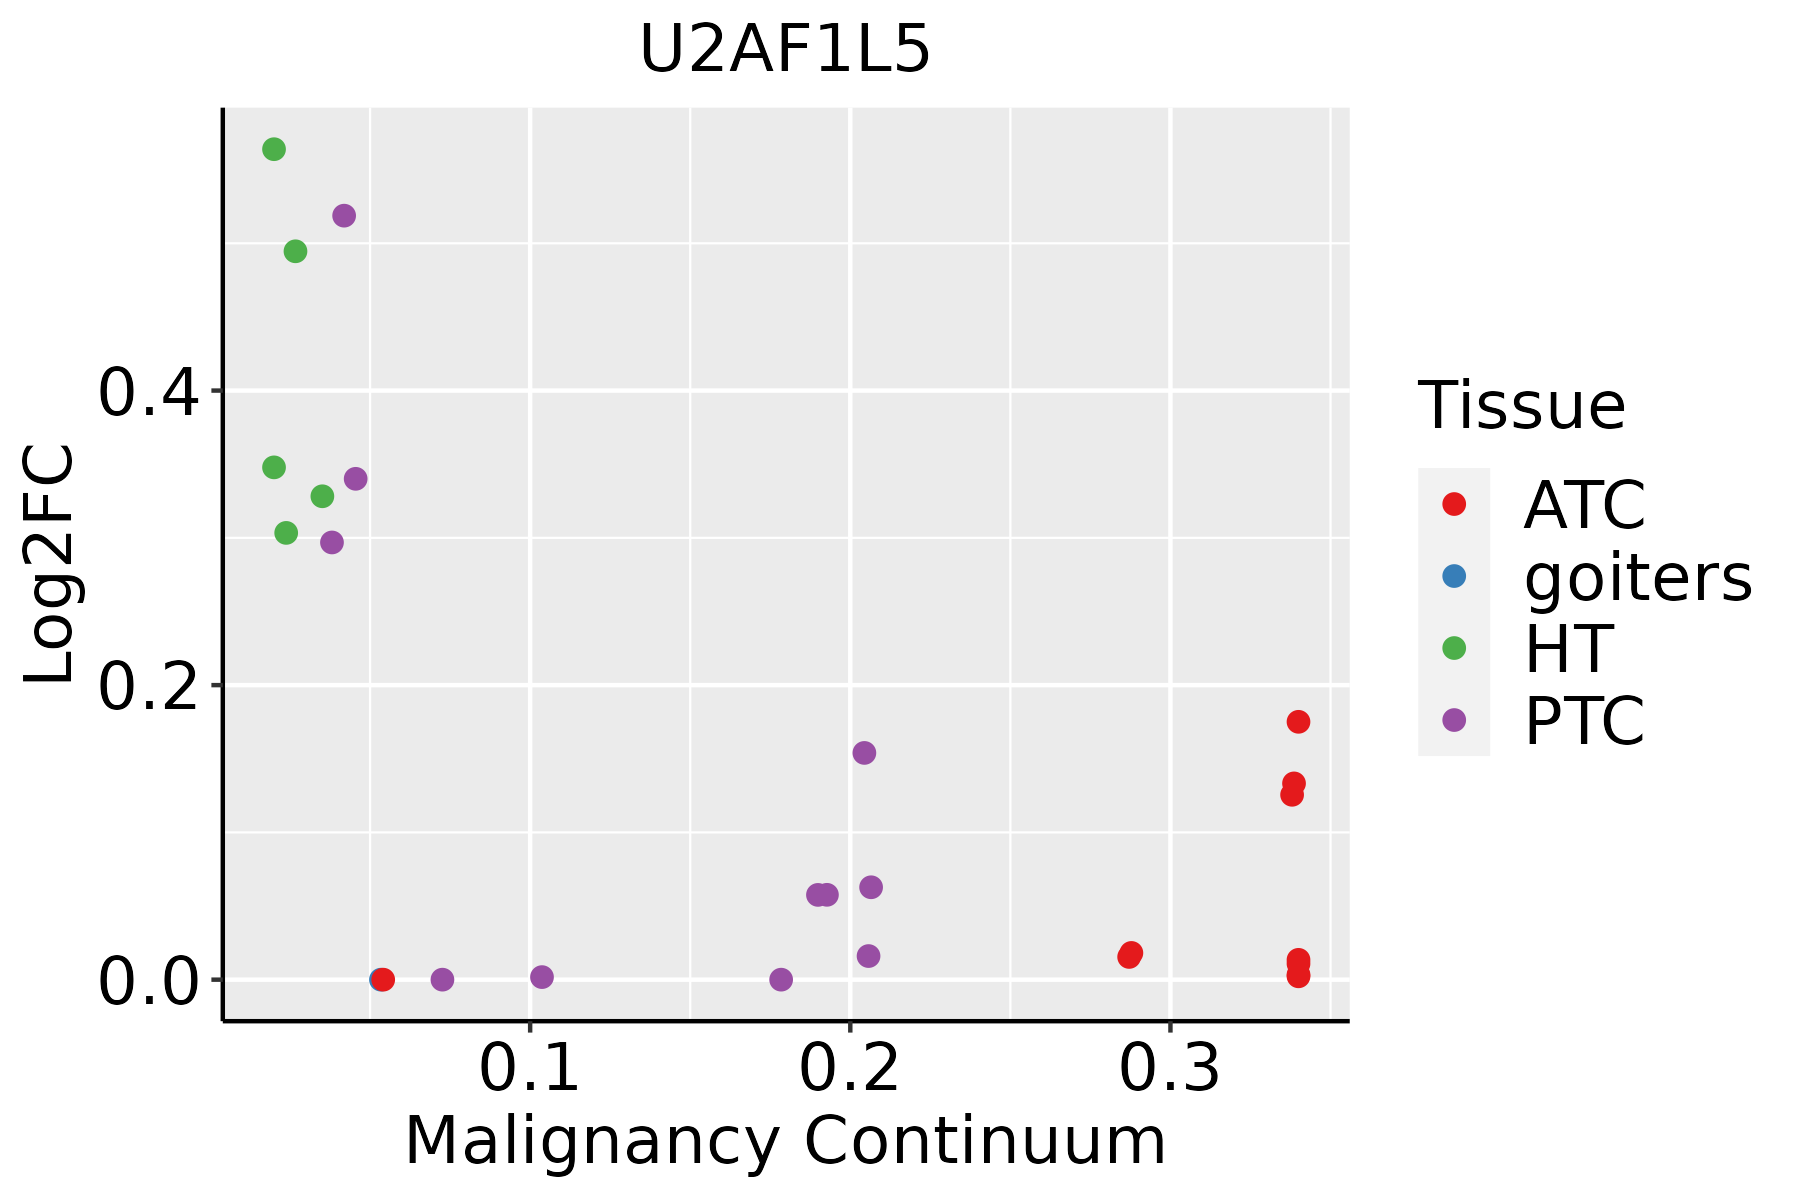 | ATC: Anaplastic thyroid cancer |
| HT: Hashimoto's thyroiditis | ||
| PTC: Papillary thyroid cancer |
| ∗log2FC in expression of this searched gene in stem-like cells from each diseased tissue sample relative to stem-like cells in normal samples in each tissue plotted against the malignancy continuum. Samples are colored based on if they are from different disease stage. |
Top |
Malignant transformation related pathway analysis |
| Find out the enriched GO biological processes and KEGG pathways involved in transition from healthy to precancer to cancer |
| Tissue | Disease Stage | Enriched GO biological Processes |
| Breast | Precancer |  |
| Breast | IDC |  |
| Breast | DCIS |  |
| Cervix | CC |  |
| Cervix | HSIL_HPV |  |
| ∗Top 15 enriched GO BP terms are showed in the bar plot of each disease state in each tissue. Each row represents a significant GO biological process which is colored according to the -log10(p.adjust). |
| Page: 1 2 3 4 5 6 7 8 9 |
| GO ID | Tissue | Disease Stage | Description | Gene Ratio | Bg Ratio | pvalue | p.adjust | Count |
| Page: 1 |
| Pathway ID | Tissue | Disease Stage | Description | Gene Ratio | Bg Ratio | pvalue | p.adjust | qvalue | Count |
| hsa05131 | Colorectum | AD | Shigellosis | 109/2092 | 247/8465 | 1.09e-11 | 2.44e-10 | 1.55e-10 | 109 |
| hsa03040 | Colorectum | AD | Spliceosome | 73/2092 | 217/8465 | 1.73e-03 | 9.68e-03 | 6.18e-03 | 73 |
| hsa051311 | Colorectum | AD | Shigellosis | 109/2092 | 247/8465 | 1.09e-11 | 2.44e-10 | 1.55e-10 | 109 |
| hsa030401 | Colorectum | AD | Spliceosome | 73/2092 | 217/8465 | 1.73e-03 | 9.68e-03 | 6.18e-03 | 73 |
| hsa051312 | Colorectum | SER | Shigellosis | 87/1580 | 247/8465 | 3.07e-10 | 7.27e-09 | 5.28e-09 | 87 |
| hsa051313 | Colorectum | SER | Shigellosis | 87/1580 | 247/8465 | 3.07e-10 | 7.27e-09 | 5.28e-09 | 87 |
| hsa051314 | Colorectum | MSS | Shigellosis | 94/1875 | 247/8465 | 6.82e-09 | 1.34e-07 | 8.23e-08 | 94 |
| hsa030402 | Colorectum | MSS | Spliceosome | 66/1875 | 217/8465 | 2.58e-03 | 1.27e-02 | 7.81e-03 | 66 |
| hsa051315 | Colorectum | MSS | Shigellosis | 94/1875 | 247/8465 | 6.82e-09 | 1.34e-07 | 8.23e-08 | 94 |
| hsa030403 | Colorectum | MSS | Spliceosome | 66/1875 | 217/8465 | 2.58e-03 | 1.27e-02 | 7.81e-03 | 66 |
| hsa030404 | Colorectum | MSI-H | Spliceosome | 37/797 | 217/8465 | 2.49e-04 | 3.23e-03 | 2.70e-03 | 37 |
| hsa051316 | Colorectum | MSI-H | Shigellosis | 40/797 | 247/8465 | 4.28e-04 | 5.34e-03 | 4.47e-03 | 40 |
| hsa030405 | Colorectum | MSI-H | Spliceosome | 37/797 | 217/8465 | 2.49e-04 | 3.23e-03 | 2.70e-03 | 37 |
| hsa051317 | Colorectum | MSI-H | Shigellosis | 40/797 | 247/8465 | 4.28e-04 | 5.34e-03 | 4.47e-03 | 40 |
| hsa0513126 | Endometrium | AEH | Shigellosis | 78/1197 | 247/8465 | 9.23e-13 | 2.00e-11 | 1.46e-11 | 78 |
| hsa030409 | Endometrium | AEH | Spliceosome | 54/1197 | 217/8465 | 1.47e-05 | 1.65e-04 | 1.21e-04 | 54 |
| hsa05131111 | Endometrium | AEH | Shigellosis | 78/1197 | 247/8465 | 9.23e-13 | 2.00e-11 | 1.46e-11 | 78 |
| hsa0304014 | Endometrium | AEH | Spliceosome | 54/1197 | 217/8465 | 1.47e-05 | 1.65e-04 | 1.21e-04 | 54 |
| hsa0513127 | Endometrium | EEC | Shigellosis | 79/1237 | 247/8465 | 1.80e-12 | 3.95e-11 | 2.95e-11 | 79 |
| hsa0304024 | Endometrium | EEC | Spliceosome | 54/1237 | 217/8465 | 3.78e-05 | 3.88e-04 | 2.89e-04 | 54 |
| Page: 1 2 |
Top |
Cell-cell communication analysis |
| Identification of potential cell-cell interactions between two cell types and their ligand-receptor pairs for different disease states |
| Ligand | Receptor | LRpair | Pathway | Tissue | Disease Stage |
| Page: 1 |
Top |
Single-cell gene regulatory network inference analysis |
| Find out the significant the regulons (TFs) and the target genes of each regulon across cell types for different disease states |
| TF | Cell Type | Tissue | Disease Stage | Target Gene | RSS | Regulon Activity |
| ∗The dot plots of a searched regulon are shown for all cell subpopulations in each disease state of each tissue based on the regulon specific score inferred using pySCENIC and by calculating the average expression. |
| Page: 1 |
Top |
Somatic mutation of malignant transformation related genes |
| Annotation of somatic variants for genes involved in malignant transformation |
| Hugo Symbol | Variant Class | Variant Classification | dbSNP RS | HGVSc | HGVSp | HGVSp Short | SWISSPROT | BIOTYPE | SIFT | PolyPhen | Tumor Sample Barcode | Tissue | Histology | Sex | Age | Stage | Therapy Types | Drugs | Outcome |
| Page: 1 |
Top |
Related drugs of malignant transformation related genes |
| Identification of chemicals and drugs interact with genes involved in malignant transfromation |
| (DGIdb 4.0) |
| Entrez ID | Symbol | Category | Interaction Types | Drug Claim Name | Drug Name | PMIDs |
| Page: 1 |

Copyright 2023-Present -The University of Texas Health Science Center at Houston |