
|
|||||
|
 | |
| |
| |
| |
| |
| |
|
Gene: RRAGA |
Gene summary for RRAGA |
| Gene information | Species | Human | Gene symbol | RRAGA | Gene ID | 10670 |
| Gene name | Ras related GTP binding A | |
| Gene Alias | FIP-1 | |
| Cytomap | 9p22.1 | |
| Gene Type | protein-coding | GO ID | GO:0001101 | UniProtAcc | Q7L523 |
Top |
Malignant transformation analysis |
| Identification of the aberrant gene expression in precancerous and cancerous lesions by comparing the gene expression of stem-like cells in diseased tissues with normal stem cells |
| Entrez ID | Symbol | Replicates | Species | Organ | Tissue | Adj P-value | Log2FC | Malignancy |
| 10670 | RRAGA | HTA11_2487_2000001011 | Human | Colorectum | SER | 8.48e-06 | 2.75e-01 | -0.1808 |
| 10670 | RRAGA | HTA11_1938_2000001011 | Human | Colorectum | AD | 3.12e-03 | 2.27e-01 | -0.0811 |
| 10670 | RRAGA | HTA11_78_2000001011 | Human | Colorectum | AD | 1.65e-05 | 2.68e-01 | -0.1088 |
| 10670 | RRAGA | HTA11_347_2000001011 | Human | Colorectum | AD | 8.96e-08 | 2.32e-01 | -0.1954 |
| 10670 | RRAGA | HTA11_411_2000001011 | Human | Colorectum | SER | 4.01e-07 | 6.14e-01 | -0.2602 |
| 10670 | RRAGA | HTA11_696_2000001011 | Human | Colorectum | AD | 2.53e-04 | 2.00e-01 | -0.1464 |
| 10670 | RRAGA | HTA11_1391_2000001011 | Human | Colorectum | AD | 4.10e-10 | 3.33e-01 | -0.059 |
| 10670 | RRAGA | HTA11_2992_2000001011 | Human | Colorectum | SER | 1.50e-03 | 3.17e-01 | -0.1706 |
| 10670 | RRAGA | HTA11_5212_2000001011 | Human | Colorectum | AD | 1.06e-04 | 3.26e-01 | -0.2061 |
| 10670 | RRAGA | HTA11_5216_2000001011 | Human | Colorectum | SER | 2.08e-03 | 3.19e-01 | -0.1462 |
| 10670 | RRAGA | HTA11_7862_2000001011 | Human | Colorectum | AD | 5.47e-03 | 2.71e-01 | -0.0179 |
| 10670 | RRAGA | HTA11_866_3004761011 | Human | Colorectum | AD | 3.83e-15 | 3.79e-01 | 0.096 |
| 10670 | RRAGA | HTA11_7663_2000001011 | Human | Colorectum | SER | 5.32e-03 | 2.67e-01 | 0.0131 |
| 10670 | RRAGA | HTA11_6801_2000001011 | Human | Colorectum | SER | 8.79e-06 | 4.53e-01 | 0.0171 |
| 10670 | RRAGA | HTA11_7696_3000711011 | Human | Colorectum | AD | 5.75e-15 | 3.48e-01 | 0.0674 |
| 10670 | RRAGA | HTA11_7469_2000001011 | Human | Colorectum | AD | 2.67e-04 | 4.77e-01 | -0.0124 |
| 10670 | RRAGA | HTA11_6818_2000001021 | Human | Colorectum | AD | 4.26e-04 | 2.83e-01 | 0.0588 |
| 10670 | RRAGA | HTA11_99999970781_79442 | Human | Colorectum | MSS | 3.34e-26 | 6.26e-01 | 0.294 |
| 10670 | RRAGA | HTA11_99999965104_69814 | Human | Colorectum | MSS | 1.47e-11 | 4.67e-01 | 0.281 |
| 10670 | RRAGA | HTA11_99999971662_82457 | Human | Colorectum | MSS | 1.98e-17 | 4.30e-01 | 0.3859 |
| Page: 1 2 3 4 5 6 7 8 |
| Tissue | Expression Dynamics | Abbreviation |
| Colorectum (GSE201348) |  | FAP: Familial adenomatous polyposis |
| CRC: Colorectal cancer | ||
| Colorectum (HTA11) |  | AD: Adenomas |
| SER: Sessile serrated lesions | ||
| MSI-H: Microsatellite-high colorectal cancer | ||
| MSS: Microsatellite stable colorectal cancer | ||
| Esophagus |  | ESCC: Esophageal squamous cell carcinoma |
| HGIN: High-grade intraepithelial neoplasias | ||
| LGIN: Low-grade intraepithelial neoplasias | ||
| Liver |  | HCC: Hepatocellular carcinoma |
| NAFLD: Non-alcoholic fatty liver disease | ||
| Oral Cavity |  | EOLP: Erosive Oral lichen planus |
| LP: leukoplakia | ||
| NEOLP: Non-erosive oral lichen planus | ||
| OSCC: Oral squamous cell carcinoma | ||
| Skin | 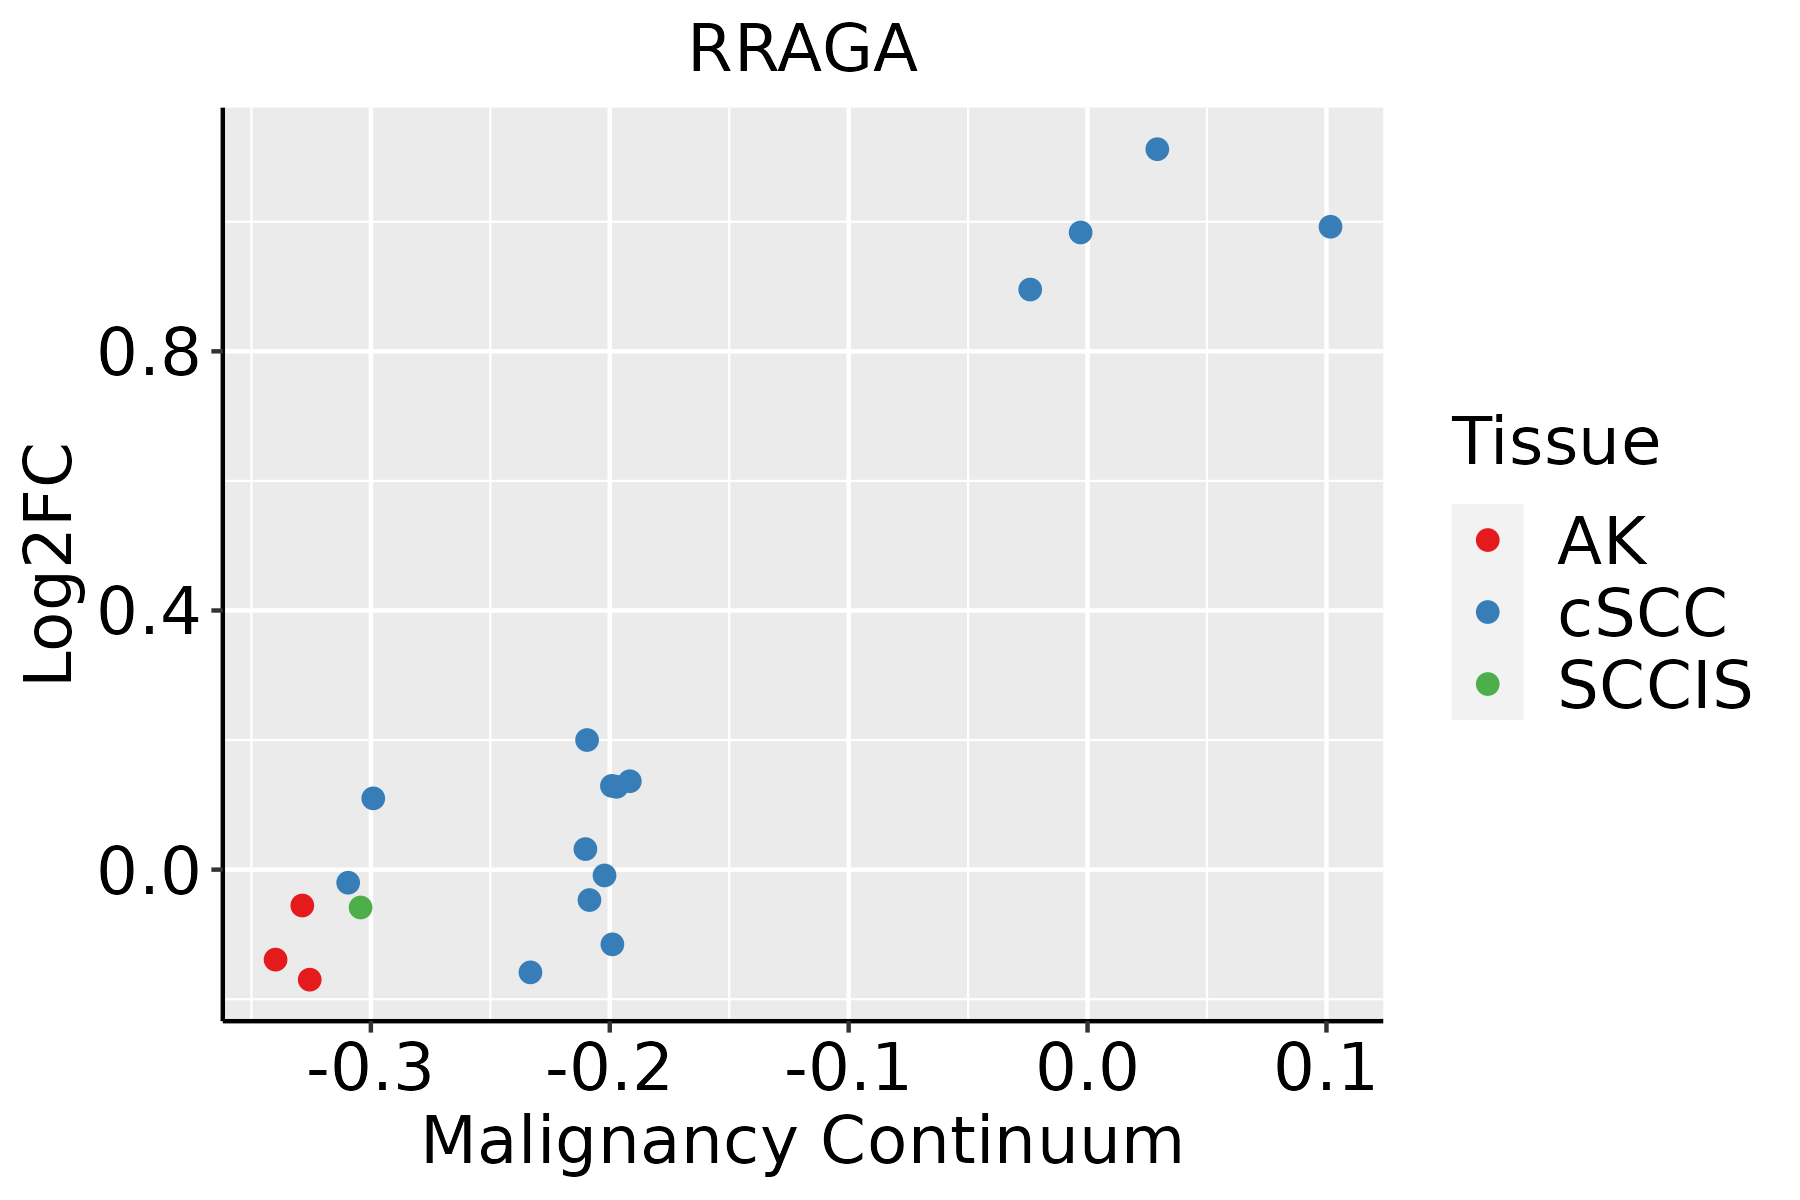 | AK: Actinic keratosis |
| cSCC: Cutaneous squamous cell carcinoma | ||
| SCCIS:squamous cell carcinoma in situ | ||
| Thyroid |  | ATC: Anaplastic thyroid cancer |
| HT: Hashimoto's thyroiditis | ||
| PTC: Papillary thyroid cancer |
| ∗log2FC in expression of this searched gene in stem-like cells from each diseased tissue sample relative to stem-like cells in normal samples in each tissue plotted against the malignancy continuum. Samples are colored based on if they are from different disease stage. |
Top |
Malignant transformation related pathway analysis |
| Find out the enriched GO biological processes and KEGG pathways involved in transition from healthy to precancer to cancer |
| Tissue | Disease Stage | Enriched GO biological Processes |
| Breast | Precancer |  |
| Breast | IDC |  |
| Breast | DCIS |  |
| Cervix | CC |  |
| Cervix | HSIL_HPV |  |
| ∗Top 15 enriched GO BP terms are showed in the bar plot of each disease state in each tissue. Each row represents a significant GO biological process which is colored according to the -log10(p.adjust). |
| Page: 1 2 3 4 5 6 7 8 9 |
| GO ID | Tissue | Disease Stage | Description | Gene Ratio | Bg Ratio | pvalue | p.adjust | Count |
| GO:0016032 | Colorectum | AD | viral process | 168/3918 | 415/18723 | 4.67e-20 | 3.66e-17 | 168 |
| GO:0009895 | Colorectum | AD | negative regulation of catabolic process | 124/3918 | 320/18723 | 1.66e-13 | 3.35e-11 | 124 |
| GO:0031330 | Colorectum | AD | negative regulation of cellular catabolic process | 104/3918 | 262/18723 | 2.66e-12 | 3.96e-10 | 104 |
| GO:0010506 | Colorectum | AD | regulation of autophagy | 111/3918 | 317/18723 | 3.57e-09 | 2.35e-07 | 111 |
| GO:0044403 | Colorectum | AD | biological process involved in symbiotic interaction | 99/3918 | 290/18723 | 1.02e-07 | 4.93e-06 | 99 |
| GO:0051701 | Colorectum | AD | biological process involved in interaction with host | 73/3918 | 203/18723 | 5.08e-07 | 1.88e-05 | 73 |
| GO:0031667 | Colorectum | AD | response to nutrient levels | 138/3918 | 474/18723 | 1.22e-05 | 2.68e-04 | 138 |
| GO:0042594 | Colorectum | AD | response to starvation | 63/3918 | 197/18723 | 1.77e-04 | 2.38e-03 | 63 |
| GO:0071496 | Colorectum | AD | cellular response to external stimulus | 94/3918 | 320/18723 | 1.98e-04 | 2.64e-03 | 94 |
| GO:0009267 | Colorectum | AD | cellular response to starvation | 51/3918 | 156/18723 | 3.90e-04 | 4.44e-03 | 51 |
| GO:0010507 | Colorectum | AD | negative regulation of autophagy | 31/3918 | 85/18723 | 6.91e-04 | 7.05e-03 | 31 |
| GO:0031668 | Colorectum | AD | cellular response to extracellular stimulus | 71/3918 | 246/18723 | 1.86e-03 | 1.52e-02 | 71 |
| GO:0031669 | Colorectum | AD | cellular response to nutrient levels | 63/3918 | 215/18723 | 2.19e-03 | 1.73e-02 | 63 |
| GO:0019048 | Colorectum | AD | modulation by virus of host process | 7/3918 | 11/18723 | 2.59e-03 | 1.96e-02 | 7 |
| GO:0035821 | Colorectum | AD | modulation of process of other organism | 34/3918 | 106/18723 | 4.73e-03 | 3.22e-02 | 34 |
| GO:00160321 | Colorectum | SER | viral process | 118/2897 | 415/18723 | 8.36e-12 | 1.65e-09 | 118 |
| GO:00098951 | Colorectum | SER | negative regulation of catabolic process | 84/2897 | 320/18723 | 3.93e-07 | 2.06e-05 | 84 |
| GO:00313301 | Colorectum | SER | negative regulation of cellular catabolic process | 70/2897 | 262/18723 | 1.79e-06 | 7.70e-05 | 70 |
| GO:00517011 | Colorectum | SER | biological process involved in interaction with host | 55/2897 | 203/18723 | 1.42e-05 | 4.38e-04 | 55 |
| GO:00444031 | Colorectum | SER | biological process involved in symbiotic interaction | 72/2897 | 290/18723 | 2.08e-05 | 6.02e-04 | 72 |
| Page: 1 2 3 4 5 6 7 8 9 10 11 12 13 |
| Pathway ID | Tissue | Disease Stage | Description | Gene Ratio | Bg Ratio | pvalue | p.adjust | qvalue | Count |
| hsa05131 | Colorectum | AD | Shigellosis | 109/2092 | 247/8465 | 1.09e-11 | 2.44e-10 | 1.55e-10 | 109 |
| hsa04140 | Colorectum | AD | Autophagy - animal | 49/2092 | 141/8465 | 4.58e-03 | 2.20e-02 | 1.40e-02 | 49 |
| hsa051311 | Colorectum | AD | Shigellosis | 109/2092 | 247/8465 | 1.09e-11 | 2.44e-10 | 1.55e-10 | 109 |
| hsa041401 | Colorectum | AD | Autophagy - animal | 49/2092 | 141/8465 | 4.58e-03 | 2.20e-02 | 1.40e-02 | 49 |
| hsa051312 | Colorectum | SER | Shigellosis | 87/1580 | 247/8465 | 3.07e-10 | 7.27e-09 | 5.28e-09 | 87 |
| hsa041402 | Colorectum | SER | Autophagy - animal | 39/1580 | 141/8465 | 5.43e-03 | 3.28e-02 | 2.38e-02 | 39 |
| hsa051313 | Colorectum | SER | Shigellosis | 87/1580 | 247/8465 | 3.07e-10 | 7.27e-09 | 5.28e-09 | 87 |
| hsa041403 | Colorectum | SER | Autophagy - animal | 39/1580 | 141/8465 | 5.43e-03 | 3.28e-02 | 2.38e-02 | 39 |
| hsa051314 | Colorectum | MSS | Shigellosis | 94/1875 | 247/8465 | 6.82e-09 | 1.34e-07 | 8.23e-08 | 94 |
| hsa041404 | Colorectum | MSS | Autophagy - animal | 45/1875 | 141/8465 | 4.42e-03 | 1.90e-02 | 1.16e-02 | 45 |
| hsa04150 | Colorectum | MSS | mTOR signaling pathway | 47/1875 | 156/8465 | 1.19e-02 | 3.99e-02 | 2.44e-02 | 47 |
| hsa051315 | Colorectum | MSS | Shigellosis | 94/1875 | 247/8465 | 6.82e-09 | 1.34e-07 | 8.23e-08 | 94 |
| hsa041405 | Colorectum | MSS | Autophagy - animal | 45/1875 | 141/8465 | 4.42e-03 | 1.90e-02 | 1.16e-02 | 45 |
| hsa041501 | Colorectum | MSS | mTOR signaling pathway | 47/1875 | 156/8465 | 1.19e-02 | 3.99e-02 | 2.44e-02 | 47 |
| hsa0513139 | Esophagus | HGIN | Shigellosis | 71/1383 | 247/8465 | 4.89e-07 | 7.98e-06 | 6.34e-06 | 71 |
| hsa05131114 | Esophagus | HGIN | Shigellosis | 71/1383 | 247/8465 | 4.89e-07 | 7.98e-06 | 6.34e-06 | 71 |
| hsa05131211 | Esophagus | ESCC | Shigellosis | 176/4205 | 247/8465 | 2.27e-12 | 4.01e-11 | 2.05e-11 | 176 |
| hsa0414010 | Esophagus | ESCC | Autophagy - animal | 101/4205 | 141/8465 | 7.60e-08 | 6.21e-07 | 3.18e-07 | 101 |
| hsa041505 | Esophagus | ESCC | mTOR signaling pathway | 98/4205 | 156/8465 | 5.81e-04 | 1.95e-03 | 9.97e-04 | 98 |
| hsa05131310 | Esophagus | ESCC | Shigellosis | 176/4205 | 247/8465 | 2.27e-12 | 4.01e-11 | 2.05e-11 | 176 |
| Page: 1 2 3 |
Top |
Cell-cell communication analysis |
| Identification of potential cell-cell interactions between two cell types and their ligand-receptor pairs for different disease states |
| Ligand | Receptor | LRpair | Pathway | Tissue | Disease Stage |
| Page: 1 |
Top |
Single-cell gene regulatory network inference analysis |
| Find out the significant the regulons (TFs) and the target genes of each regulon across cell types for different disease states |
| TF | Cell Type | Tissue | Disease Stage | Target Gene | RSS | Regulon Activity |
| ∗The dot plots of a searched regulon are shown for all cell subpopulations in each disease state of each tissue based on the regulon specific score inferred using pySCENIC and by calculating the average expression. |
| Page: 1 |
Top |
Somatic mutation of malignant transformation related genes |
| Annotation of somatic variants for genes involved in malignant transformation |
| Hugo Symbol | Variant Class | Variant Classification | dbSNP RS | HGVSc | HGVSp | HGVSp Short | SWISSPROT | BIOTYPE | SIFT | PolyPhen | Tumor Sample Barcode | Tissue | Histology | Sex | Age | Stage | Therapy Types | Drugs | Outcome |
| RRAGA | insertion | Frame_Shift_Ins | novel | c.713_714insGTGTTTGA | p.Phe238LeufsTer6 | p.F238Lfs*6 | Q7L523 | protein_coding | TCGA-A8-A093-01 | Breast | breast invasive carcinoma | Female | <65 | I/II | Hormone Therapy | tamoxiphen | SD | ||
| RRAGA | insertion | Frame_Shift_Ins | novel | c.714_715insGTGGAGAGCCGCGAACTGGA | p.Lys239ValfsTer9 | p.K239Vfs*9 | Q7L523 | protein_coding | TCGA-A8-A093-01 | Breast | breast invasive carcinoma | Female | <65 | I/II | Hormone Therapy | tamoxiphen | SD | ||
| RRAGA | insertion | Nonsense_Mutation | novel | c.499_500insGGGGGATTGTGGAAGCCAAGGTTCTTGTTATGT | p.Glu167delinsGlyGlyIleValGluAlaLysValLeuValMetTer | p.E167delinsGGIVEAKVLVM* | Q7L523 | protein_coding | TCGA-A8-A09E-01 | Breast | breast invasive carcinoma | Female | >=65 | III/IV | Hormone Therapy | anastrozole | SD | ||
| RRAGA | insertion | Frame_Shift_Ins | novel | c.862_863insAAGG | p.Ile288LysfsTer12 | p.I288Kfs*12 | Q7L523 | protein_coding | TCGA-AN-A03X-01 | Breast | breast invasive carcinoma | Female | >=65 | I/II | Unknown | Unknown | SD | ||
| RRAGA | insertion | In_Frame_Ins | novel | c.863_864insGCTGCTGATGGGGAAGAGCGGGTCGGGGAAGAC | p.Ile288delinsMetLeuLeuMetGlyLysSerGlySerGlyLysThr | p.I288delinsMLLMGKSGSGKT | Q7L523 | protein_coding | TCGA-AN-A03X-01 | Breast | breast invasive carcinoma | Female | >=65 | I/II | Unknown | Unknown | SD | ||
| RRAGA | SNV | Missense_Mutation | novel | c.778N>T | p.Ala260Ser | p.A260S | Q7L523 | protein_coding | tolerated(0.89) | benign(0.017) | TCGA-EK-A2RJ-01 | Cervix | cervical & endocervical cancer | Female | <65 | I/II | Unknown | Unknown | SD |
| RRAGA | SNV | Missense_Mutation | c.112C>T | p.Arg38Cys | p.R38C | Q7L523 | protein_coding | deleterious(0) | possibly_damaging(0.468) | TCGA-AD-5900-01 | Colorectum | colon adenocarcinoma | Male | >=65 | I/II | Unknown | Unknown | SD | |
| RRAGA | SNV | Missense_Mutation | c.390N>A | p.Asp130Glu | p.D130E | Q7L523 | protein_coding | deleterious(0) | probably_damaging(0.998) | TCGA-A5-A0GH-01 | Endometrium | uterine corpus endometrioid carcinoma | Female | <65 | I/II | Unknown | Unknown | SD | |
| RRAGA | SNV | Missense_Mutation | novel | c.932N>G | p.Leu311Arg | p.L311R | Q7L523 | protein_coding | tolerated_low_confidence(0.19) | benign(0) | TCGA-AJ-A3EL-01 | Endometrium | uterine corpus endometrioid carcinoma | Female | <65 | I/II | Unknown | Unknown | SD |
| RRAGA | SNV | Missense_Mutation | c.275T>C | p.Phe92Ser | p.F92S | Q7L523 | protein_coding | deleterious(0) | probably_damaging(1) | TCGA-AP-A056-01 | Endometrium | uterine corpus endometrioid carcinoma | Female | <65 | I/II | Unknown | Unknown | SD |
| Page: 1 2 3 |
Top |
Related drugs of malignant transformation related genes |
| Identification of chemicals and drugs interact with genes involved in malignant transfromation |
| (DGIdb 4.0) |
| Entrez ID | Symbol | Category | Interaction Types | Drug Claim Name | Drug Name | PMIDs |
| Page: 1 |

Copyright 2023-Present -The University of Texas Health Science Center at Houston |