
|
|||||
|
 | |
| |
| |
| |
| |
| |
|
Gene: RIPOR1 |
Gene summary for RIPOR1 |
| Gene information | Species | Human | Gene symbol | RIPOR1 | Gene ID | 79567 |
| Gene name | RHO family interacting cell polarization regulator 1 | |
| Gene Alias | FAM65A | |
| Cytomap | 16q22.1 | |
| Gene Type | protein-coding | GO ID | GO:0006810 | UniProtAcc | Q6ZS17 |
Top |
Malignant transformation analysis |
| Identification of the aberrant gene expression in precancerous and cancerous lesions by comparing the gene expression of stem-like cells in diseased tissues with normal stem cells |
| Entrez ID | Symbol | Replicates | Species | Organ | Tissue | Adj P-value | Log2FC | Malignancy |
| 79567 | RIPOR1 | S014 | Human | Liver | HCC | 1.36e-21 | 4.94e-01 | 0.2254 |
| 79567 | RIPOR1 | S015 | Human | Liver | HCC | 2.68e-22 | 5.12e-01 | 0.2375 |
| 79567 | RIPOR1 | S016 | Human | Liver | HCC | 2.99e-15 | 4.13e-01 | 0.2243 |
| 79567 | RIPOR1 | S027 | Human | Liver | HCC | 2.12e-21 | 8.82e-01 | 0.2446 |
| 79567 | RIPOR1 | S028 | Human | Liver | HCC | 1.13e-27 | 7.50e-01 | 0.2503 |
| 79567 | RIPOR1 | S029 | Human | Liver | HCC | 7.94e-23 | 7.10e-01 | 0.2581 |
| 79567 | RIPOR1 | male-WTA | Human | Thyroid | PTC | 1.28e-06 | 9.98e-02 | 0.1037 |
| 79567 | RIPOR1 | PTC04 | Human | Thyroid | PTC | 4.82e-02 | 1.01e-01 | 0.1927 |
| 79567 | RIPOR1 | PTC05 | Human | Thyroid | PTC | 4.70e-03 | 1.52e-01 | 0.2065 |
| 79567 | RIPOR1 | PTC06 | Human | Thyroid | PTC | 5.78e-05 | 1.60e-01 | 0.2057 |
| 79567 | RIPOR1 | PTC07 | Human | Thyroid | PTC | 1.25e-05 | 1.49e-01 | 0.2044 |
| 79567 | RIPOR1 | ATC09 | Human | Thyroid | ATC | 9.00e-08 | 2.68e-01 | 0.2871 |
| 79567 | RIPOR1 | ATC11 | Human | Thyroid | ATC | 5.90e-10 | 7.74e-01 | 0.3386 |
| 79567 | RIPOR1 | ATC12 | Human | Thyroid | ATC | 1.90e-14 | 2.82e-01 | 0.34 |
| 79567 | RIPOR1 | ATC13 | Human | Thyroid | ATC | 1.17e-31 | 4.92e-01 | 0.34 |
| 79567 | RIPOR1 | ATC1 | Human | Thyroid | ATC | 7.57e-09 | 3.11e-01 | 0.2878 |
| 79567 | RIPOR1 | ATC2 | Human | Thyroid | ATC | 1.80e-12 | 6.31e-01 | 0.34 |
| 79567 | RIPOR1 | ATC3 | Human | Thyroid | ATC | 3.69e-12 | 7.30e-01 | 0.338 |
| 79567 | RIPOR1 | ATC4 | Human | Thyroid | ATC | 2.04e-17 | 3.42e-01 | 0.34 |
| 79567 | RIPOR1 | ATC5 | Human | Thyroid | ATC | 1.84e-32 | 5.35e-01 | 0.34 |
| Page: 1 |
| Tissue | Expression Dynamics | Abbreviation |
| Liver | 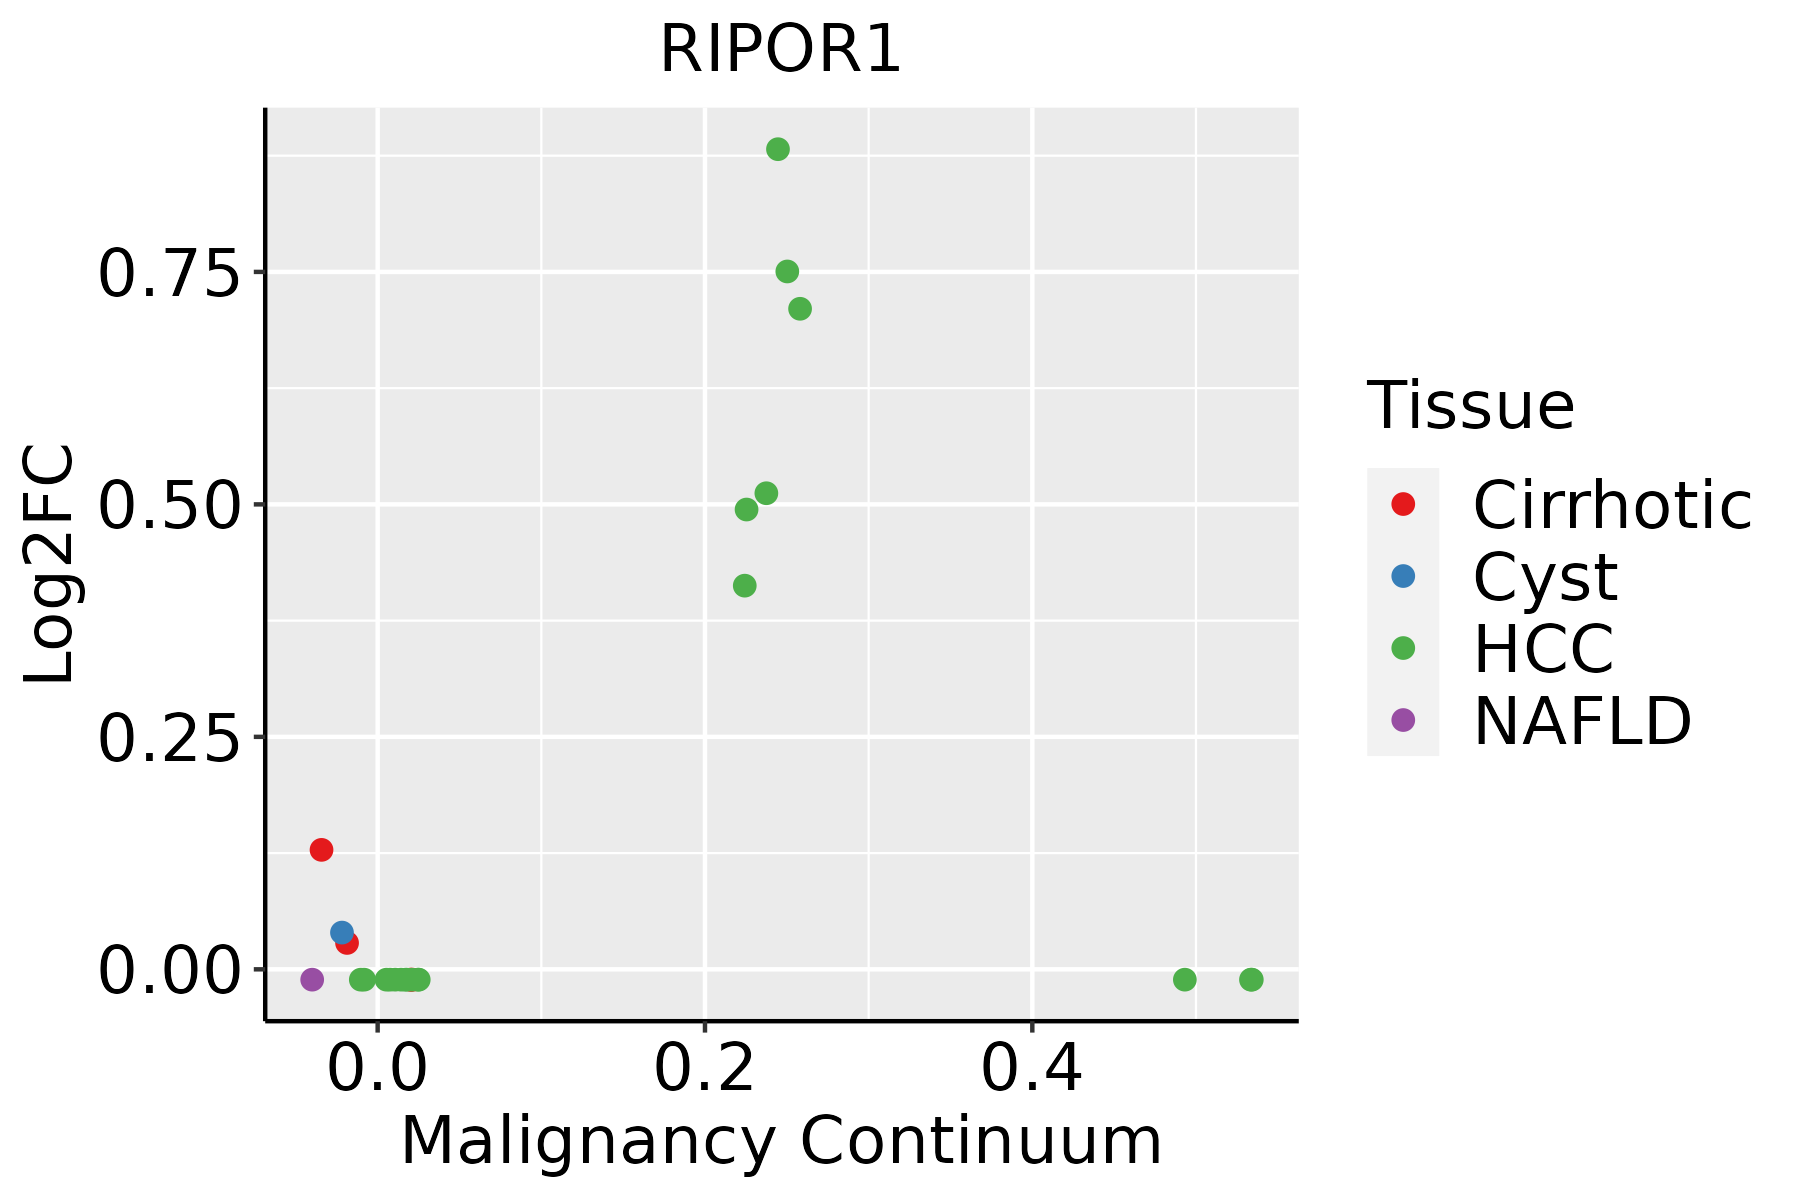 | HCC: Hepatocellular carcinoma |
| NAFLD: Non-alcoholic fatty liver disease | ||
| Thyroid |  | ATC: Anaplastic thyroid cancer |
| HT: Hashimoto's thyroiditis | ||
| PTC: Papillary thyroid cancer |
| ∗log2FC in expression of this searched gene in stem-like cells from each diseased tissue sample relative to stem-like cells in normal samples in each tissue plotted against the malignancy continuum. Samples are colored based on if they are from different disease stage. |
Top |
Malignant transformation related pathway analysis |
| Find out the enriched GO biological processes and KEGG pathways involved in transition from healthy to precancer to cancer |
| Tissue | Disease Stage | Enriched GO biological Processes |
| Breast | Precancer |  |
| Breast | IDC |  |
| Breast | DCIS |  |
| Cervix | CC |  |
| Cervix | HSIL_HPV |  |
| ∗Top 15 enriched GO BP terms are showed in the bar plot of each disease state in each tissue. Each row represents a significant GO biological process which is colored according to the -log10(p.adjust). |
| Page: 1 2 3 4 5 6 7 8 9 |
| GO ID | Tissue | Disease Stage | Description | Gene Ratio | Bg Ratio | pvalue | p.adjust | Count |
| GO:003238621 | Liver | HCC | regulation of intracellular transport | 231/7958 | 337/18723 | 1.99e-22 | 3.40e-20 | 231 |
| GO:003315721 | Liver | HCC | regulation of intracellular protein transport | 165/7958 | 229/18723 | 8.37e-20 | 1.15e-17 | 165 |
| GO:003238821 | Liver | HCC | positive regulation of intracellular transport | 148/7958 | 202/18723 | 5.15e-19 | 6.66e-17 | 148 |
| GO:009031621 | Liver | HCC | positive regulation of intracellular protein transport | 121/7958 | 160/18723 | 1.27e-17 | 1.39e-15 | 121 |
| GO:190495122 | Liver | HCC | positive regulation of establishment of protein localization | 207/7958 | 319/18723 | 3.95e-16 | 3.29e-14 | 207 |
| GO:005122222 | Liver | HCC | positive regulation of protein transport | 194/7958 | 303/18723 | 2.41e-14 | 1.56e-12 | 194 |
| GO:003166722 | Liver | HCC | response to nutrient levels | 276/7958 | 474/18723 | 2.30e-12 | 1.08e-10 | 276 |
| GO:007149622 | Liver | HCC | cellular response to external stimulus | 191/7958 | 320/18723 | 3.40e-10 | 1.13e-08 | 191 |
| GO:005165621 | Liver | HCC | establishment of organelle localization | 226/7958 | 390/18723 | 4.15e-10 | 1.34e-08 | 226 |
| GO:003166812 | Liver | HCC | cellular response to extracellular stimulus | 149/7958 | 246/18723 | 7.35e-09 | 1.86e-07 | 149 |
| GO:004259421 | Liver | HCC | response to starvation | 121/7958 | 197/18723 | 6.08e-08 | 1.28e-06 | 121 |
| GO:003166912 | Liver | HCC | cellular response to nutrient levels | 130/7958 | 215/18723 | 7.52e-08 | 1.51e-06 | 130 |
| GO:000726521 | Liver | HCC | Ras protein signal transduction | 187/7958 | 337/18723 | 8.89e-07 | 1.35e-05 | 187 |
| GO:000926712 | Liver | HCC | cellular response to starvation | 94/7958 | 156/18723 | 5.61e-06 | 6.95e-05 | 94 |
| GO:003406721 | Liver | HCC | protein localization to Golgi apparatus | 23/7958 | 29/18723 | 5.86e-05 | 5.38e-04 | 23 |
| GO:005164511 | Liver | HCC | Golgi localization | 12/7958 | 14/18723 | 1.17e-03 | 6.54e-03 | 12 |
| GO:000726621 | Liver | HCC | Rho protein signal transduction | 76/7958 | 137/18723 | 1.46e-03 | 7.75e-03 | 76 |
| GO:0032386111 | Thyroid | PTC | regulation of intracellular transport | 202/5968 | 337/18723 | 1.12e-26 | 3.93e-24 | 202 |
| GO:0033157112 | Thyroid | PTC | regulation of intracellular protein transport | 149/5968 | 229/18723 | 3.83e-25 | 1.15e-22 | 149 |
| GO:0032388112 | Thyroid | PTC | positive regulation of intracellular transport | 132/5968 | 202/18723 | 1.10e-22 | 2.57e-20 | 132 |
| Page: 1 2 3 |
| Pathway ID | Tissue | Disease Stage | Description | Gene Ratio | Bg Ratio | pvalue | p.adjust | qvalue | Count |
| Page: 1 |
Top |
Cell-cell communication analysis |
| Identification of potential cell-cell interactions between two cell types and their ligand-receptor pairs for different disease states |
| Ligand | Receptor | LRpair | Pathway | Tissue | Disease Stage |
| Page: 1 |
Top |
Single-cell gene regulatory network inference analysis |
| Find out the significant the regulons (TFs) and the target genes of each regulon across cell types for different disease states |
| TF | Cell Type | Tissue | Disease Stage | Target Gene | RSS | Regulon Activity |
| ∗The dot plots of a searched regulon are shown for all cell subpopulations in each disease state of each tissue based on the regulon specific score inferred using pySCENIC and by calculating the average expression. |
| Page: 1 |
Top |
Somatic mutation of malignant transformation related genes |
| Annotation of somatic variants for genes involved in malignant transformation |
| Hugo Symbol | Variant Class | Variant Classification | dbSNP RS | HGVSc | HGVSp | HGVSp Short | SWISSPROT | BIOTYPE | SIFT | PolyPhen | Tumor Sample Barcode | Tissue | Histology | Sex | Age | Stage | Therapy Types | Drugs | Outcome |
| Page: 1 |
Top |
Related drugs of malignant transformation related genes |
| Identification of chemicals and drugs interact with genes involved in malignant transfromation |
| (DGIdb 4.0) |
| Entrez ID | Symbol | Category | Interaction Types | Drug Claim Name | Drug Name | PMIDs |
| Page: 1 |

Copyright 2023-Present -The University of Texas Health Science Center at Houston |