
|
|||||
|
 | |
| |
| |
| |
| |
| |
|
Gene: RHOQ |
Gene summary for RHOQ |
| Gene information | Species | Human | Gene symbol | RHOQ | Gene ID | 23433 |
| Gene name | ras homolog family member Q | |
| Gene Alias | ARHQ | |
| Cytomap | 2p21 | |
| Gene Type | protein-coding | GO ID | GO:0000902 | UniProtAcc | P17081 |
Top |
Malignant transformation analysis |
| Identification of the aberrant gene expression in precancerous and cancerous lesions by comparing the gene expression of stem-like cells in diseased tissues with normal stem cells |
| Entrez ID | Symbol | Replicates | Species | Organ | Tissue | Adj P-value | Log2FC | Malignancy |
| 23433 | RHOQ | HCC1_Meng | Human | Liver | HCC | 1.08e-77 | 2.44e-01 | 0.0246 |
| 23433 | RHOQ | HCC2_Meng | Human | Liver | HCC | 3.38e-08 | 3.12e-02 | 0.0107 |
| 23433 | RHOQ | HCC2 | Human | Liver | HCC | 8.38e-29 | 4.32e+00 | 0.5341 |
| 23433 | RHOQ | Pt13.b | Human | Liver | HCC | 2.47e-02 | 1.31e-01 | 0.0251 |
| 23433 | RHOQ | S027 | Human | Liver | HCC | 3.46e-07 | 7.16e-01 | 0.2446 |
| 23433 | RHOQ | S028 | Human | Liver | HCC | 2.11e-12 | 6.60e-01 | 0.2503 |
| 23433 | RHOQ | S029 | Human | Liver | HCC | 2.15e-14 | 7.51e-01 | 0.2581 |
| 23433 | RHOQ | GSM5252132_BPH389PrGF | Human | Prostate | BPH | 4.38e-06 | 6.27e-01 | -0.2247 |
| 23433 | RHOQ | GSM5252135_BPH511PrPUr_Fcol_3GEX | Human | Prostate | BPH | 3.87e-04 | 3.73e-01 | -0.1833 |
| 23433 | RHOQ | 047563_1562-all-cells | Human | Prostate | BPH | 8.83e-14 | 5.69e-01 | 0.0791 |
| 23433 | RHOQ | 048752_1579-all-cells | Human | Prostate | BPH | 3.52e-14 | 4.40e-01 | 0.1008 |
| 23433 | RHOQ | 052095_1628-all-cells | Human | Prostate | BPH | 4.03e-06 | 3.64e-01 | 0.1032 |
| 23433 | RHOQ | 052097_1595-all-cells | Human | Prostate | BPH | 2.82e-30 | 6.84e-01 | 0.0972 |
| 23433 | RHOQ | 052099_1652-all-cells | Human | Prostate | BPH | 1.85e-05 | 3.49e-01 | 0.1038 |
| 23433 | RHOQ | Dong_P1 | Human | Prostate | Tumor | 5.12e-14 | 7.44e-02 | 0.035 |
| 23433 | RHOQ | Dong_P3 | Human | Prostate | Tumor | 9.43e-04 | 3.77e-02 | 0.0278 |
| 23433 | RHOQ | Dong_P5 | Human | Prostate | Tumor | 2.97e-04 | -5.69e-02 | 0.053 |
| 23433 | RHOQ | Adj_PTCwithHT_6 | Human | Thyroid | HT | 5.67e-05 | -2.10e-01 | 0.02 |
| 23433 | RHOQ | PTCwithHT_6 | Human | Thyroid | HT | 1.15e-03 | -2.06e-01 | 0.02 |
| 23433 | RHOQ | PTCwithHT_8 | Human | Thyroid | HT | 5.67e-05 | -2.10e-01 | 0.0351 |
| Page: 1 2 |
| Tissue | Expression Dynamics | Abbreviation |
| Liver |  | HCC: Hepatocellular carcinoma |
| NAFLD: Non-alcoholic fatty liver disease | ||
| Prostate | 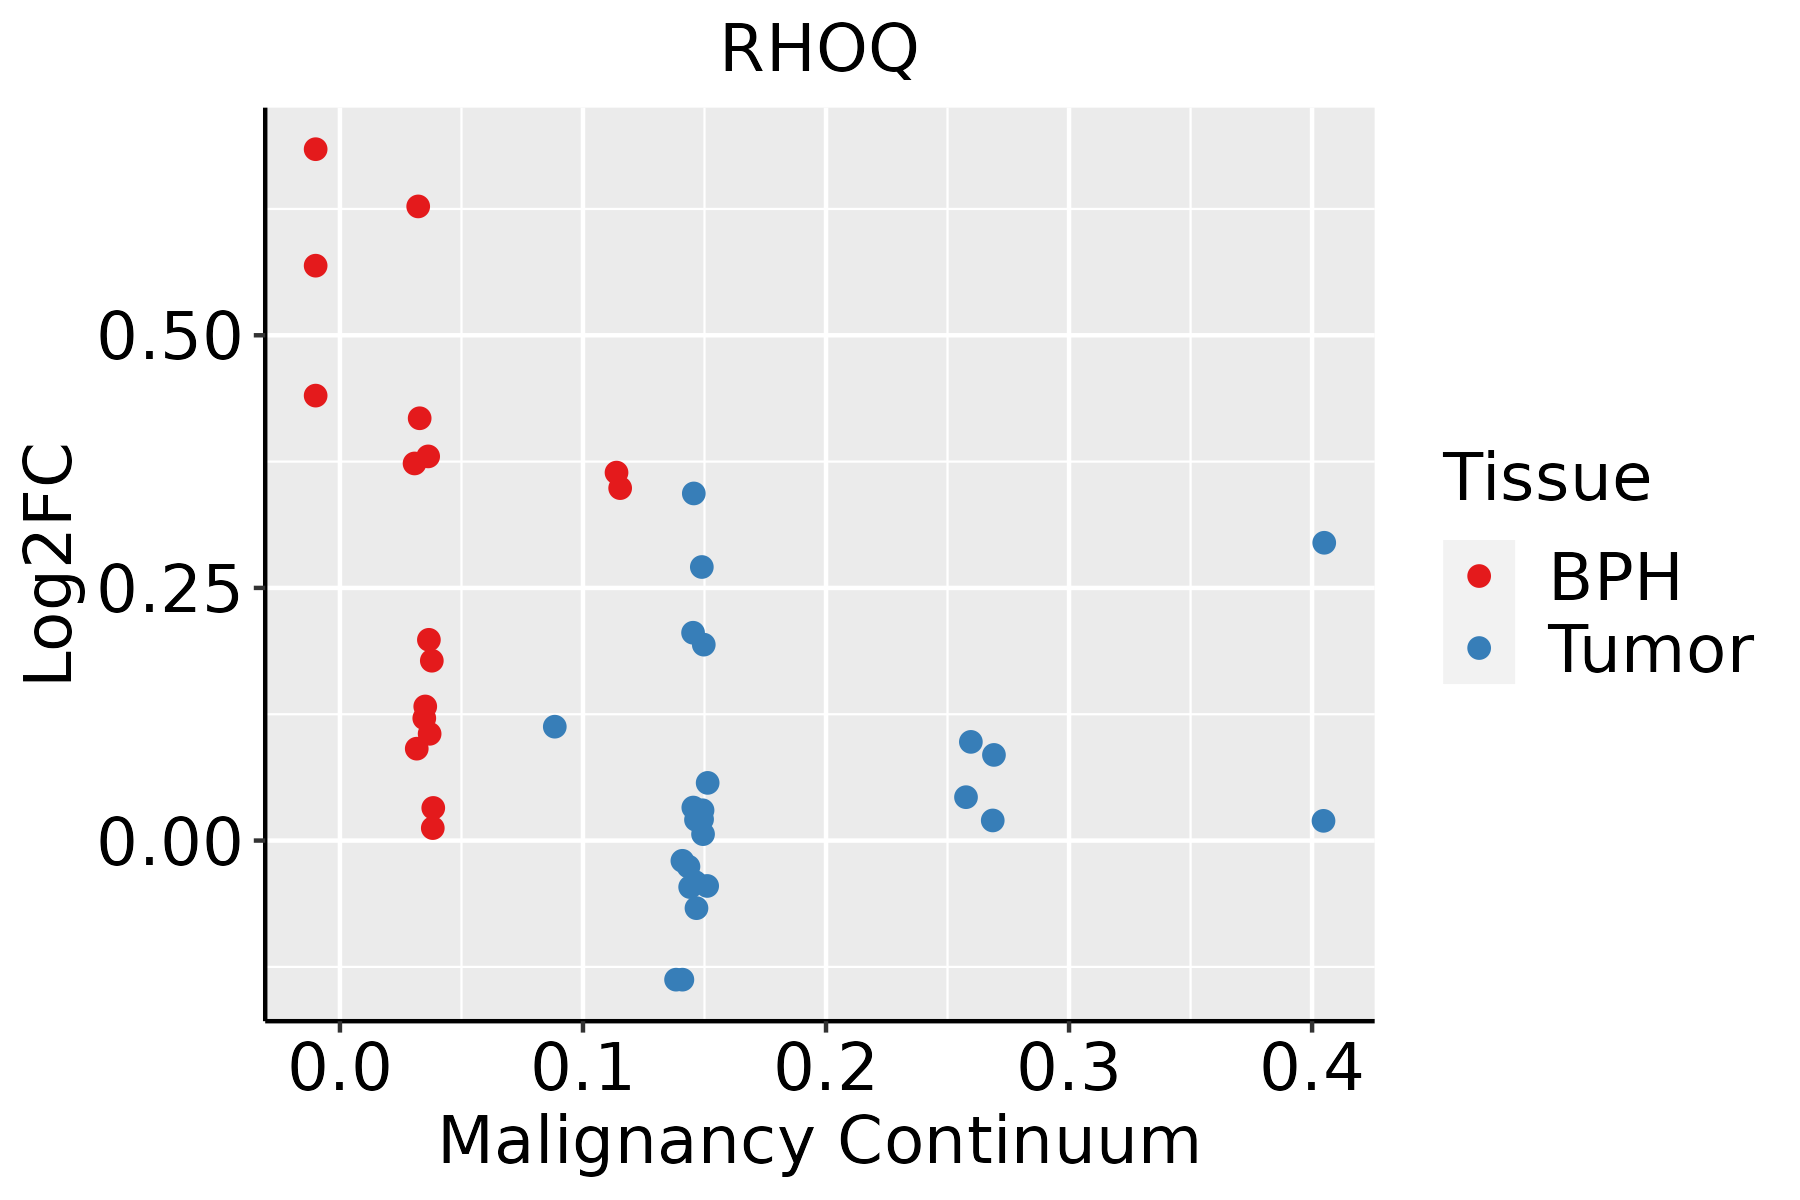 | BPH: Benign Prostatic Hyperplasia |
| Thyroid |  | ATC: Anaplastic thyroid cancer |
| HT: Hashimoto's thyroiditis | ||
| PTC: Papillary thyroid cancer |
| ∗log2FC in expression of this searched gene in stem-like cells from each diseased tissue sample relative to stem-like cells in normal samples in each tissue plotted against the malignancy continuum. Samples are colored based on if they are from different disease stage. |
Top |
Malignant transformation related pathway analysis |
| Find out the enriched GO biological processes and KEGG pathways involved in transition from healthy to precancer to cancer |
| Tissue | Disease Stage | Enriched GO biological Processes |
| Breast | Precancer |  |
| Breast | IDC |  |
| Breast | DCIS |  |
| Cervix | CC |  |
| Cervix | HSIL_HPV |  |
| ∗Top 15 enriched GO BP terms are showed in the bar plot of each disease state in each tissue. Each row represents a significant GO biological process which is colored according to the -log10(p.adjust). |
| Page: 1 2 3 4 5 6 7 8 9 |
| GO ID | Tissue | Disease Stage | Description | Gene Ratio | Bg Ratio | pvalue | p.adjust | Count |
| GO:000911722 | Liver | HCC | nucleotide metabolic process | 300/7958 | 489/18723 | 1.61e-17 | 1.71e-15 | 300 |
| GO:000675322 | Liver | HCC | nucleoside phosphate metabolic process | 304/7958 | 497/18723 | 1.78e-17 | 1.85e-15 | 304 |
| GO:001969322 | Liver | HCC | ribose phosphate metabolic process | 248/7958 | 396/18723 | 3.15e-16 | 2.70e-14 | 248 |
| GO:000925922 | Liver | HCC | ribonucleotide metabolic process | 240/7958 | 385/18723 | 2.07e-15 | 1.51e-13 | 240 |
| GO:003286821 | Liver | HCC | response to insulin | 172/7958 | 264/18723 | 7.14e-14 | 4.23e-12 | 172 |
| GO:000915022 | Liver | HCC | purine ribonucleotide metabolic process | 226/7958 | 368/18723 | 1.36e-13 | 7.69e-12 | 226 |
| GO:007252122 | Liver | HCC | purine-containing compound metabolic process | 250/7958 | 416/18723 | 2.26e-13 | 1.24e-11 | 250 |
| GO:003286921 | Liver | HCC | cellular response to insulin stimulus | 137/7958 | 203/18723 | 4.69e-13 | 2.44e-11 | 137 |
| GO:004343422 | Liver | HCC | response to peptide hormone | 247/7958 | 414/18723 | 9.55e-13 | 4.77e-11 | 247 |
| GO:000616322 | Liver | HCC | purine nucleotide metabolic process | 236/7958 | 396/18723 | 3.59e-12 | 1.62e-10 | 236 |
| GO:007265921 | Liver | HCC | protein localization to plasma membrane | 177/7958 | 284/18723 | 1.02e-11 | 4.18e-10 | 177 |
| GO:007137521 | Liver | HCC | cellular response to peptide hormone stimulus | 179/7958 | 290/18723 | 2.54e-11 | 9.88e-10 | 179 |
| GO:002260422 | Liver | HCC | regulation of cell morphogenesis | 188/7958 | 309/18723 | 4.84e-11 | 1.82e-09 | 188 |
| GO:199077821 | Liver | HCC | protein localization to cell periphery | 200/7958 | 333/18723 | 6.07e-11 | 2.23e-09 | 200 |
| GO:190165321 | Liver | HCC | cellular response to peptide | 211/7958 | 359/18723 | 2.86e-10 | 9.63e-09 | 211 |
| GO:190547511 | Liver | HCC | regulation of protein localization to membrane | 113/7958 | 175/18723 | 2.90e-09 | 7.78e-08 | 113 |
| GO:003297022 | Liver | HCC | regulation of actin filament-based process | 222/7958 | 397/18723 | 3.81e-08 | 8.30e-07 | 222 |
| GO:003086512 | Liver | HCC | cortical cytoskeleton organization | 47/7958 | 61/18723 | 4.03e-08 | 8.69e-07 | 47 |
| GO:190437521 | Liver | HCC | regulation of protein localization to cell periphery | 83/7958 | 125/18723 | 5.60e-08 | 1.19e-06 | 83 |
| GO:00082862 | Liver | HCC | insulin receptor signaling pathway | 78/7958 | 116/18723 | 6.15e-08 | 1.29e-06 | 78 |
| Page: 1 2 3 4 5 6 7 8 9 10 11 |
| Pathway ID | Tissue | Disease Stage | Description | Gene Ratio | Bg Ratio | pvalue | p.adjust | qvalue | Count |
| hsa0491041 | Liver | HCC | Insulin signaling pathway | 95/4020 | 137/8465 | 1.53e-07 | 1.97e-06 | 1.10e-06 | 95 |
| hsa0491051 | Liver | HCC | Insulin signaling pathway | 95/4020 | 137/8465 | 1.53e-07 | 1.97e-06 | 1.10e-06 | 95 |
| hsa049107 | Prostate | BPH | Insulin signaling pathway | 43/1718 | 137/8465 | 1.34e-03 | 5.81e-03 | 3.60e-03 | 43 |
| hsa0491012 | Prostate | BPH | Insulin signaling pathway | 43/1718 | 137/8465 | 1.34e-03 | 5.81e-03 | 3.60e-03 | 43 |
| hsa0491022 | Prostate | Tumor | Insulin signaling pathway | 44/1791 | 137/8465 | 1.69e-03 | 7.10e-03 | 4.40e-03 | 44 |
| hsa0491032 | Prostate | Tumor | Insulin signaling pathway | 44/1791 | 137/8465 | 1.69e-03 | 7.10e-03 | 4.40e-03 | 44 |
| Page: 1 |
Top |
Cell-cell communication analysis |
| Identification of potential cell-cell interactions between two cell types and their ligand-receptor pairs for different disease states |
| Ligand | Receptor | LRpair | Pathway | Tissue | Disease Stage |
| Page: 1 |
Top |
Single-cell gene regulatory network inference analysis |
| Find out the significant the regulons (TFs) and the target genes of each regulon across cell types for different disease states |
| TF | Cell Type | Tissue | Disease Stage | Target Gene | RSS | Regulon Activity |
| ∗The dot plots of a searched regulon are shown for all cell subpopulations in each disease state of each tissue based on the regulon specific score inferred using pySCENIC and by calculating the average expression. |
| Page: 1 |
Top |
Somatic mutation of malignant transformation related genes |
| Annotation of somatic variants for genes involved in malignant transformation |
| Hugo Symbol | Variant Class | Variant Classification | dbSNP RS | HGVSc | HGVSp | HGVSp Short | SWISSPROT | BIOTYPE | SIFT | PolyPhen | Tumor Sample Barcode | Tissue | Histology | Sex | Age | Stage | Therapy Types | Drugs | Outcome |
| RHOQ | SNV | Missense_Mutation | rs141544914 | c.614C>T | p.Thr205Met | p.T205M | P17081 | protein_coding | deleterious_low_confidence(0) | probably_damaging(0.991) | TCGA-A2-A04T-01 | Breast | breast invasive carcinoma | Female | <65 | I/II | Chemotherapy | cyclophosphamide | SD |
| RHOQ | SNV | Missense_Mutation | novel | c.513N>C | p.Leu171Phe | p.L171F | P17081 | protein_coding | deleterious(0.01) | probably_damaging(0.998) | TCGA-A2-A0YK-01 | Breast | breast invasive carcinoma | Female | <65 | I/II | Chemotherapy | cytoxan | SD |
| RHOQ | SNV | Missense_Mutation | novel | c.227T>C | p.Leu76Ser | p.L76S | P17081 | protein_coding | deleterious(0) | probably_damaging(0.997) | TCGA-2W-A8YY-01 | Cervix | cervical & endocervical cancer | Female | <65 | I/II | Chemotherapy | cisplatin | CR |
| RHOQ | SNV | Missense_Mutation | c.499N>G | p.Thr167Ala | p.T167A | P17081 | protein_coding | deleterious(0) | possibly_damaging(0.894) | TCGA-AZ-4615-01 | Colorectum | colon adenocarcinoma | Male | >=65 | III/IV | Chemotherapy | xeloda | PD | |
| RHOQ | SNV | Missense_Mutation | c.205N>T | p.Asp69Tyr | p.D69Y | P17081 | protein_coding | deleterious(0) | probably_damaging(0.999) | TCGA-CM-5861-01 | Colorectum | colon adenocarcinoma | Female | <65 | I/II | Unknown | Unknown | PD | |
| RHOQ | SNV | Missense_Mutation | c.169N>C | p.Tyr57His | p.Y57H | P17081 | protein_coding | tolerated(0.27) | possibly_damaging(0.816) | TCGA-D5-6928-01 | Colorectum | colon adenocarcinoma | Male | >=65 | I/II | Unknown | Unknown | SD | |
| RHOQ | SNV | Missense_Mutation | c.304N>A | p.Glu102Lys | p.E102K | P17081 | protein_coding | tolerated(1) | probably_damaging(0.988) | TCGA-AX-A05Z-01 | Endometrium | uterine corpus endometrioid carcinoma | Female | <65 | III/IV | Chemotherapy | adriamycin | SD | |
| RHOQ | SNV | Missense_Mutation | novel | c.28N>T | p.Leu10Phe | p.L10F | P17081 | protein_coding | deleterious(0) | benign(0.003) | TCGA-AX-A3G8-01 | Endometrium | uterine corpus endometrioid carcinoma | Female | >=65 | I/II | Unknown | Unknown | SD |
| RHOQ | SNV | Missense_Mutation | novel | c.38N>C | p.Val13Ala | p.V13A | P17081 | protein_coding | deleterious(0.01) | benign(0.031) | TCGA-DI-A1BU-01 | Endometrium | uterine corpus endometrioid carcinoma | Female | <65 | I/II | Chemotherapy | paclitaxel | SD |
| RHOQ | SNV | Missense_Mutation | rs371750832 | c.196N>A | p.Gly66Arg | p.G66R | P17081 | protein_coding | deleterious(0) | benign(0.2) | TCGA-DI-A1BU-01 | Endometrium | uterine corpus endometrioid carcinoma | Female | <65 | I/II | Chemotherapy | paclitaxel | SD |
| Page: 1 2 |
Top |
Related drugs of malignant transformation related genes |
| Identification of chemicals and drugs interact with genes involved in malignant transfromation |
| (DGIdb 4.0) |
| Entrez ID | Symbol | Category | Interaction Types | Drug Claim Name | Drug Name | PMIDs |
| Page: 1 |

Copyright 2023-Present -The University of Texas Health Science Center at Houston |