
|
|||||
|
 | |
| |
| |
| |
| |
| |
|
Gene: REST |
Gene summary for REST |
| Gene information | Species | Human | Gene symbol | REST | Gene ID | 5978 |
| Gene name | RE1 silencing transcription factor | |
| Gene Alias | DFNA27 | |
| Cytomap | 4q12 | |
| Gene Type | protein-coding | GO ID | GO:0000122 | UniProtAcc | Q13127 |
Top |
Malignant transformation analysis |
| Identification of the aberrant gene expression in precancerous and cancerous lesions by comparing the gene expression of stem-like cells in diseased tissues with normal stem cells |
| Entrez ID | Symbol | Replicates | Species | Organ | Tissue | Adj P-value | Log2FC | Malignancy |
| 5978 | REST | LZE2T | Human | Esophagus | ESCC | 1.52e-02 | 5.83e-01 | 0.082 |
| 5978 | REST | LZE4T | Human | Esophagus | ESCC | 5.92e-15 | 4.81e-01 | 0.0811 |
| 5978 | REST | LZE5T | Human | Esophagus | ESCC | 5.23e-03 | 2.24e-01 | 0.0514 |
| 5978 | REST | LZE7T | Human | Esophagus | ESCC | 2.65e-04 | 3.94e-01 | 0.0667 |
| 5978 | REST | LZE8T | Human | Esophagus | ESCC | 8.02e-06 | 1.11e-01 | 0.067 |
| 5978 | REST | LZE20T | Human | Esophagus | ESCC | 7.39e-08 | 2.78e-01 | 0.0662 |
| 5978 | REST | LZE21D1 | Human | Esophagus | HGIN | 4.54e-02 | 1.16e-01 | 0.0632 |
| 5978 | REST | LZE22T | Human | Esophagus | ESCC | 5.18e-04 | 4.03e-01 | 0.068 |
| 5978 | REST | LZE24T | Human | Esophagus | ESCC | 6.48e-25 | 7.52e-01 | 0.0596 |
| 5978 | REST | LZE21T | Human | Esophagus | ESCC | 3.53e-08 | 4.36e-01 | 0.0655 |
| 5978 | REST | P1T-E | Human | Esophagus | ESCC | 9.93e-14 | 7.14e-01 | 0.0875 |
| 5978 | REST | P2T-E | Human | Esophagus | ESCC | 5.17e-82 | 1.40e+00 | 0.1177 |
| 5978 | REST | P4T-E | Human | Esophagus | ESCC | 1.20e-43 | 9.93e-01 | 0.1323 |
| 5978 | REST | P5T-E | Human | Esophagus | ESCC | 1.10e-21 | 4.16e-01 | 0.1327 |
| 5978 | REST | P8T-E | Human | Esophagus | ESCC | 3.71e-50 | 1.01e+00 | 0.0889 |
| 5978 | REST | P9T-E | Human | Esophagus | ESCC | 5.27e-16 | 3.83e-01 | 0.1131 |
| 5978 | REST | P10T-E | Human | Esophagus | ESCC | 4.10e-50 | 8.64e-01 | 0.116 |
| 5978 | REST | P11T-E | Human | Esophagus | ESCC | 2.58e-14 | 6.56e-01 | 0.1426 |
| 5978 | REST | P12T-E | Human | Esophagus | ESCC | 1.08e-47 | 1.09e+00 | 0.1122 |
| 5978 | REST | P15T-E | Human | Esophagus | ESCC | 1.98e-46 | 9.90e-01 | 0.1149 |
| Page: 1 2 3 4 5 6 7 8 |
| Tissue | Expression Dynamics | Abbreviation |
| Esophagus | 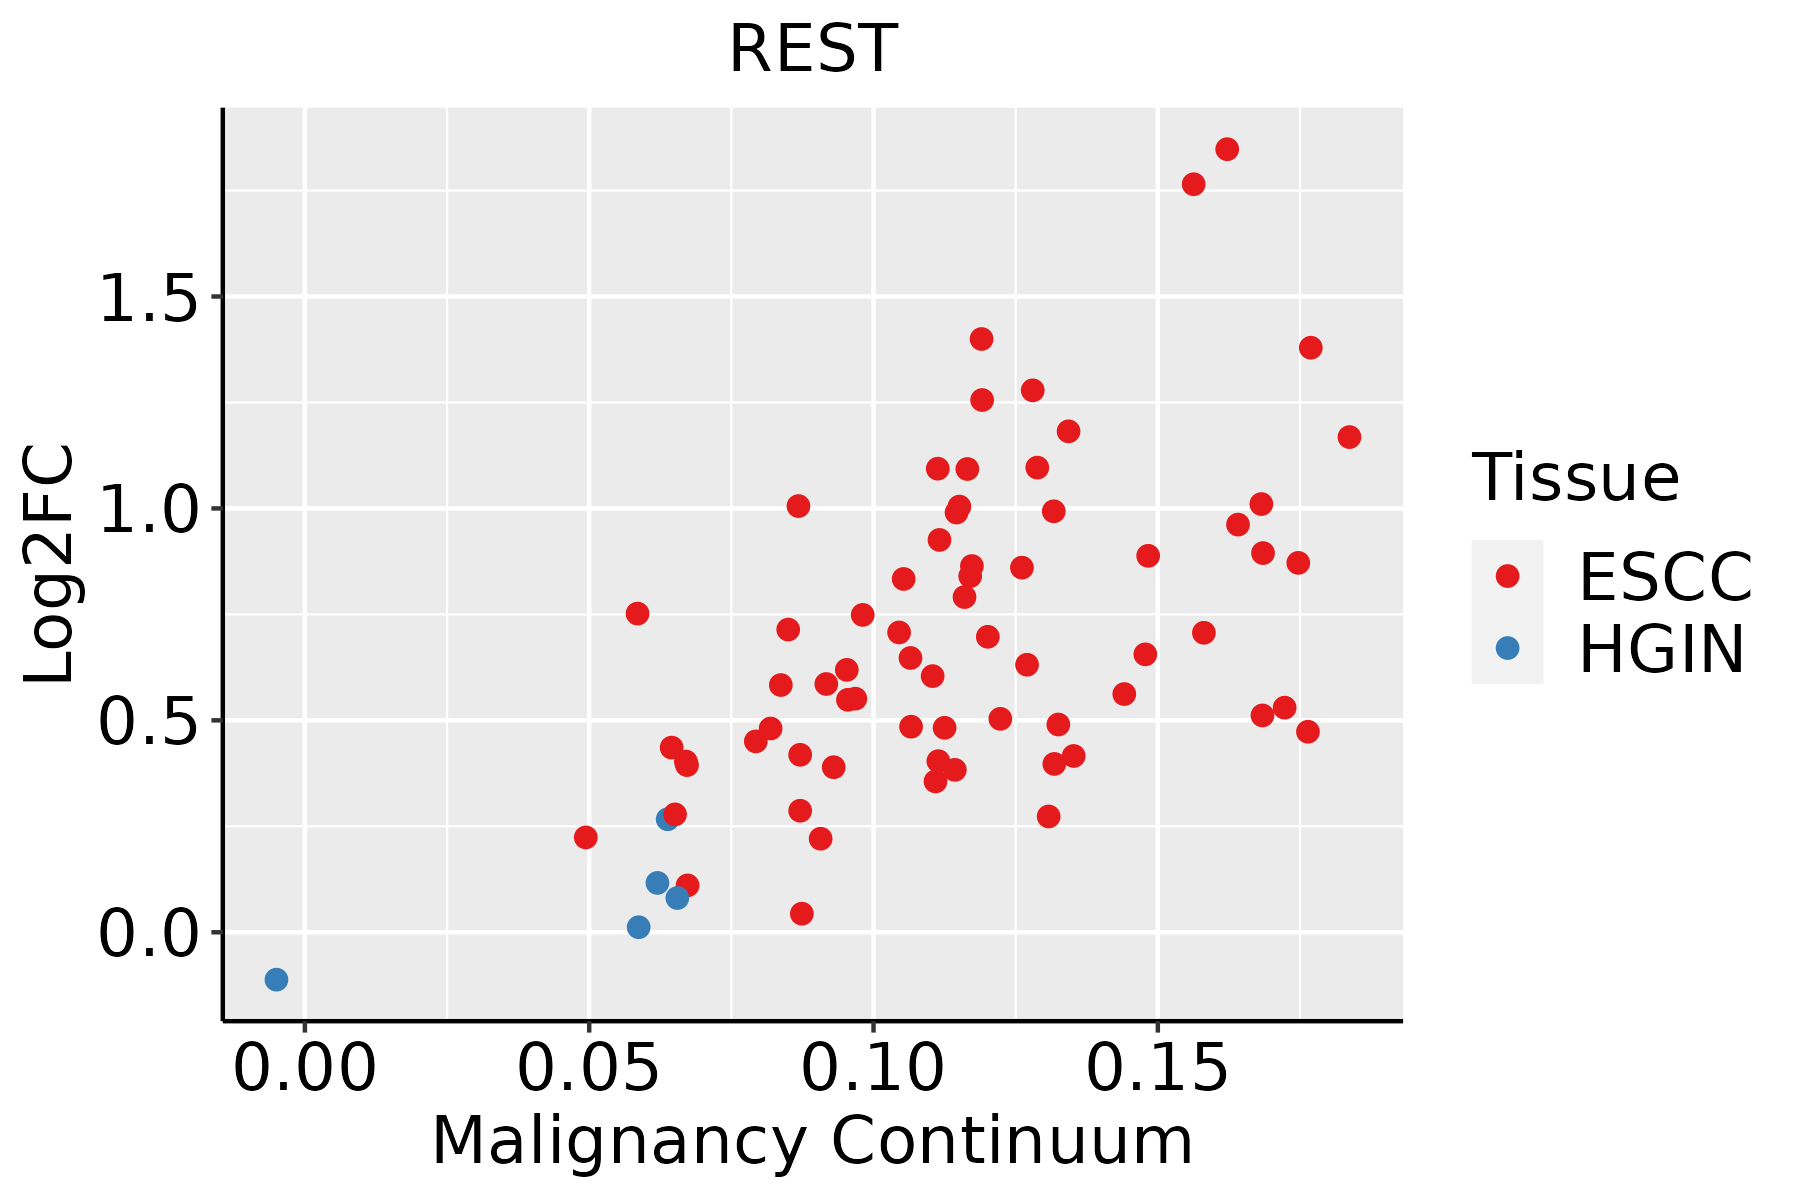 | ESCC: Esophageal squamous cell carcinoma |
| HGIN: High-grade intraepithelial neoplasias | ||
| LGIN: Low-grade intraepithelial neoplasias | ||
| Liver |  | HCC: Hepatocellular carcinoma |
| NAFLD: Non-alcoholic fatty liver disease | ||
| Oral Cavity |  | EOLP: Erosive Oral lichen planus |
| LP: leukoplakia | ||
| NEOLP: Non-erosive oral lichen planus | ||
| OSCC: Oral squamous cell carcinoma | ||
| Prostate |  | BPH: Benign Prostatic Hyperplasia |
| Skin | 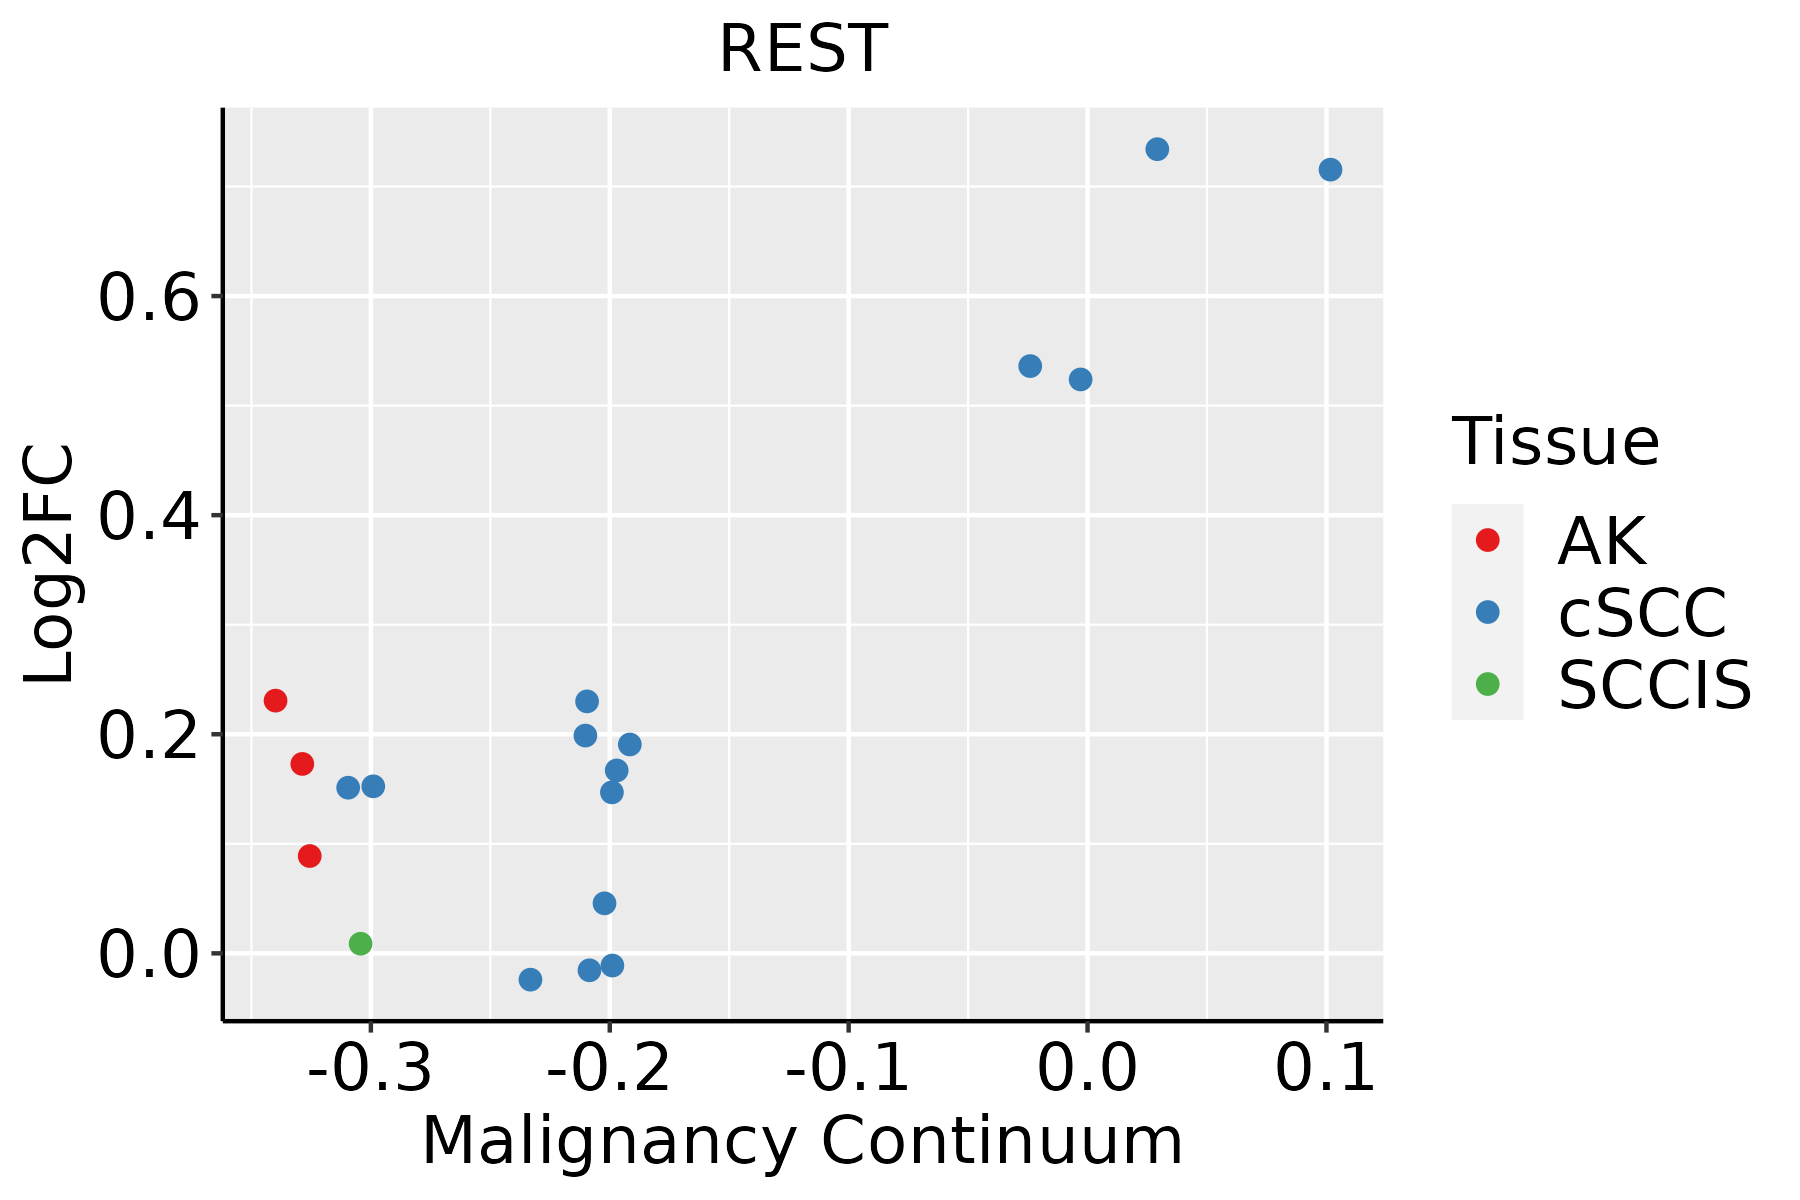 | AK: Actinic keratosis |
| cSCC: Cutaneous squamous cell carcinoma | ||
| SCCIS:squamous cell carcinoma in situ | ||
| Thyroid |  | ATC: Anaplastic thyroid cancer |
| HT: Hashimoto's thyroiditis | ||
| PTC: Papillary thyroid cancer |
| ∗log2FC in expression of this searched gene in stem-like cells from each diseased tissue sample relative to stem-like cells in normal samples in each tissue plotted against the malignancy continuum. Samples are colored based on if they are from different disease stage. |
Top |
Malignant transformation related pathway analysis |
| Find out the enriched GO biological processes and KEGG pathways involved in transition from healthy to precancer to cancer |
| Tissue | Disease Stage | Enriched GO biological Processes |
| Breast | Precancer |  |
| Breast | IDC |  |
| Breast | DCIS |  |
| Cervix | CC |  |
| Cervix | HSIL_HPV |  |
| ∗Top 15 enriched GO BP terms are showed in the bar plot of each disease state in each tissue. Each row represents a significant GO biological process which is colored according to the -log10(p.adjust). |
| Page: 1 2 3 4 5 6 7 8 9 |
| GO ID | Tissue | Disease Stage | Description | Gene Ratio | Bg Ratio | pvalue | p.adjust | Count |
| GO:000838026 | Esophagus | HGIN | RNA splicing | 160/2587 | 434/18723 | 3.74e-34 | 1.12e-30 | 160 |
| GO:000037520 | Esophagus | HGIN | RNA splicing, via transesterification reactions | 115/2587 | 324/18723 | 3.16e-23 | 3.80e-20 | 115 |
| GO:000037720 | Esophagus | HGIN | RNA splicing, via transesterification reactions with bulged adenosine as nucleophile | 113/2587 | 320/18723 | 1.24e-22 | 9.26e-20 | 113 |
| GO:000039820 | Esophagus | HGIN | mRNA splicing, via spliceosome | 113/2587 | 320/18723 | 1.24e-22 | 9.26e-20 | 113 |
| GO:001603227 | Esophagus | HGIN | viral process | 118/2587 | 415/18723 | 3.01e-15 | 6.22e-13 | 118 |
| GO:004348427 | Esophagus | HGIN | regulation of RNA splicing | 59/2587 | 148/18723 | 3.61e-15 | 7.22e-13 | 59 |
| GO:190331120 | Esophagus | HGIN | regulation of mRNA metabolic process | 91/2587 | 288/18723 | 5.06e-15 | 9.78e-13 | 91 |
| GO:005068419 | Esophagus | HGIN | regulation of mRNA processing | 55/2587 | 137/18723 | 2.17e-14 | 3.94e-12 | 55 |
| GO:004586227 | Esophagus | HGIN | positive regulation of proteolysis | 107/2587 | 372/18723 | 2.61e-14 | 4.60e-12 | 107 |
| GO:004802426 | Esophagus | HGIN | regulation of mRNA splicing, via spliceosome | 42/2587 | 101/18723 | 6.35e-12 | 7.78e-10 | 42 |
| GO:000038018 | Esophagus | HGIN | alternative mRNA splicing, via spliceosome | 32/2587 | 77/18723 | 2.06e-09 | 1.54e-07 | 32 |
| GO:000697927 | Esophagus | HGIN | response to oxidative stress | 107/2587 | 446/18723 | 3.91e-09 | 2.76e-07 | 107 |
| GO:004328126 | Esophagus | HGIN | regulation of cysteine-type endopeptidase activity involved in apoptotic process | 59/2587 | 209/18723 | 3.39e-08 | 1.97e-06 | 59 |
| GO:200011626 | Esophagus | HGIN | regulation of cysteine-type endopeptidase activity | 63/2587 | 235/18723 | 9.71e-08 | 5.02e-06 | 63 |
| GO:005254726 | Esophagus | HGIN | regulation of peptidase activity | 102/2587 | 461/18723 | 6.29e-07 | 2.72e-05 | 102 |
| GO:004440326 | Esophagus | HGIN | biological process involved in symbiotic interaction | 71/2587 | 290/18723 | 7.09e-07 | 3.00e-05 | 71 |
| GO:001095225 | Esophagus | HGIN | positive regulation of peptidase activity | 53/2587 | 197/18723 | 8.70e-07 | 3.59e-05 | 53 |
| GO:005254826 | Esophagus | HGIN | regulation of endopeptidase activity | 96/2587 | 432/18723 | 1.09e-06 | 4.30e-05 | 96 |
| GO:00198277 | Esophagus | HGIN | stem cell population maintenance | 39/2587 | 131/18723 | 1.63e-06 | 6.14e-05 | 39 |
| GO:004328020 | Esophagus | HGIN | positive regulation of cysteine-type endopeptidase activity involved in apoptotic process | 38/2587 | 129/18723 | 2.92e-06 | 1.01e-04 | 38 |
| Page: 1 2 3 4 5 6 7 8 9 10 11 12 13 14 15 16 17 18 19 20 21 22 23 24 25 26 27 28 29 30 31 32 33 34 35 36 37 38 39 40 41 42 43 44 |
| Pathway ID | Tissue | Disease Stage | Description | Gene Ratio | Bg Ratio | pvalue | p.adjust | qvalue | Count |
| hsa0501630 | Esophagus | HGIN | Huntington disease | 129/1383 | 306/8465 | 6.81e-28 | 7.41e-26 | 5.88e-26 | 129 |
| hsa05016113 | Esophagus | HGIN | Huntington disease | 129/1383 | 306/8465 | 6.81e-28 | 7.41e-26 | 5.88e-26 | 129 |
| hsa05016210 | Esophagus | ESCC | Huntington disease | 226/4205 | 306/8465 | 1.38e-18 | 8.72e-17 | 4.46e-17 | 226 |
| hsa0501638 | Esophagus | ESCC | Huntington disease | 226/4205 | 306/8465 | 1.38e-18 | 8.72e-17 | 4.46e-17 | 226 |
| hsa0501614 | Liver | Cirrhotic | Huntington disease | 172/2530 | 306/8465 | 1.65e-22 | 1.10e-20 | 6.77e-21 | 172 |
| hsa0501615 | Liver | Cirrhotic | Huntington disease | 172/2530 | 306/8465 | 1.65e-22 | 1.10e-20 | 6.77e-21 | 172 |
| hsa0501622 | Liver | HCC | Huntington disease | 219/4020 | 306/8465 | 3.06e-18 | 3.42e-16 | 1.90e-16 | 219 |
| hsa0501632 | Liver | HCC | Huntington disease | 219/4020 | 306/8465 | 3.06e-18 | 3.42e-16 | 1.90e-16 | 219 |
| hsa0501628 | Oral cavity | OSCC | Huntington disease | 204/3704 | 306/8465 | 1.70e-16 | 7.13e-15 | 3.63e-15 | 204 |
| hsa05016112 | Oral cavity | OSCC | Huntington disease | 204/3704 | 306/8465 | 1.70e-16 | 7.13e-15 | 3.63e-15 | 204 |
| hsa0501626 | Prostate | BPH | Huntington disease | 149/1718 | 306/8465 | 8.82e-30 | 7.27e-28 | 4.50e-28 | 149 |
| hsa05016111 | Prostate | BPH | Huntington disease | 149/1718 | 306/8465 | 8.82e-30 | 7.27e-28 | 4.50e-28 | 149 |
| hsa0501627 | Prostate | Tumor | Huntington disease | 150/1791 | 306/8465 | 2.72e-28 | 2.25e-26 | 1.40e-26 | 150 |
| hsa0501636 | Prostate | Tumor | Huntington disease | 150/1791 | 306/8465 | 2.72e-28 | 2.25e-26 | 1.40e-26 | 150 |
| Page: 1 |
Top |
Cell-cell communication analysis |
| Identification of potential cell-cell interactions between two cell types and their ligand-receptor pairs for different disease states |
| Ligand | Receptor | LRpair | Pathway | Tissue | Disease Stage |
| Page: 1 |
Top |
Single-cell gene regulatory network inference analysis |
| Find out the significant the regulons (TFs) and the target genes of each regulon across cell types for different disease states |
| TF | Cell Type | Tissue | Disease Stage | Target Gene | RSS | Regulon Activity |
| REST | MAIT | Colorectum | SER | MTHFR,PSD3,SPECC1, etc. | 2.66e-02 |  |
| REST | STM | Oral cavity | LP | GABRP,FAM111B,RP11-983G14.1, etc. | 5.24e-01 |  |
| ∗The dot plots of a searched regulon are shown for all cell subpopulations in each disease state of each tissue based on the regulon specific score inferred using pySCENIC and by calculating the average expression. |
| Page: 1 |
Top |
Somatic mutation of malignant transformation related genes |
| Annotation of somatic variants for genes involved in malignant transformation |
| Hugo Symbol | Variant Class | Variant Classification | dbSNP RS | HGVSc | HGVSp | HGVSp Short | SWISSPROT | BIOTYPE | SIFT | PolyPhen | Tumor Sample Barcode | Tissue | Histology | Sex | Age | Stage | Therapy Types | Drugs | Outcome |
| REST | SNV | Missense_Mutation | c.3189N>G | p.Ile1063Met | p.I1063M | Q13127 | protein_coding | deleterious(0) | probably_damaging(0.946) | TCGA-AO-A03T-01 | Breast | breast invasive carcinoma | Female | <65 | I/II | Chemotherapy | cyclophosphamide | SD | |
| REST | SNV | Missense_Mutation | novel | c.622N>A | p.Glu208Lys | p.E208K | Q13127 | protein_coding | tolerated(0.19) | probably_damaging(0.993) | TCGA-BH-A0HF-01 | Breast | breast invasive carcinoma | Female | >=65 | I/II | Hormone Therapy | arimidex | SD |
| REST | SNV | Missense_Mutation | c.1114G>C | p.Asp372His | p.D372H | Q13127 | protein_coding | deleterious(0.04) | probably_damaging(1) | TCGA-D8-A1JA-01 | Breast | breast invasive carcinoma | Female | <65 | III/IV | Chemotherapy | adriamycin | PD | |
| REST | SNV | Missense_Mutation | c.2746N>A | p.Ser916Thr | p.S916T | Q13127 | protein_coding | tolerated(0.13) | benign(0.257) | TCGA-E9-A1R7-01 | Breast | breast invasive carcinoma | Female | <65 | I/II | Hormone Therapy | fareston | SD | |
| REST | insertion | Nonsense_Mutation | novel | c.662_663insAGCACCCTTCCCCTCC | p.Cys221Ter | p.C221* | Q13127 | protein_coding | TCGA-A7-A0CE-01 | Breast | breast invasive carcinoma | Female | <65 | I/II | Chemotherapy | adriamycin | SD | ||
| REST | insertion | Frame_Shift_Ins | novel | c.664_665insCAGATGATCCTGGAGT | p.Gly222AlafsTer10 | p.G222Afs*10 | Q13127 | protein_coding | TCGA-A7-A0CE-01 | Breast | breast invasive carcinoma | Female | <65 | I/II | Chemotherapy | adriamycin | SD | ||
| REST | insertion | Frame_Shift_Ins | novel | c.3029_3030insAGCCTGCT | p.Ile1011AlafsTer12 | p.I1011Afs*12 | Q13127 | protein_coding | TCGA-A8-A07R-01 | Breast | breast invasive carcinoma | Female | >=65 | III/IV | Ancillary | zoledronic | SD | ||
| REST | insertion | In_Frame_Ins | novel | c.3031_3032insGAGGGAGCCACCTCC | p.Ile1011delinsArgGlySerHisLeuLeu | p.I1011delinsRGSHLL | Q13127 | protein_coding | TCGA-A8-A07R-01 | Breast | breast invasive carcinoma | Female | >=65 | III/IV | Ancillary | zoledronic | SD | ||
| REST | insertion | Nonsense_Mutation | novel | c.3204_3205insGAAATTTAGGGTGGAGGGAGTATGGGAATTTTA | p.Ser1068_Phe1069insGluIleTerGlyGlyGlySerMetGlyIleLeu | p.S1068_F1069insEI*GGGSMGIL | Q13127 | protein_coding | TCGA-AR-A0TY-01 | Breast | breast invasive carcinoma | Female | <65 | I/II | Unspecific | Paclitaxel | PD | ||
| REST | insertion | Nonsense_Mutation | novel | c.960_961insTTGGGAGGCCAATATAGGCGGATTGCTTGAGCCC | p.Arg321LeufsTer10 | p.R321Lfs*10 | Q13127 | protein_coding | TCGA-B6-A0I8-01 | Breast | breast invasive carcinoma | Female | <65 | I/II | Unknown | Unknown | PD |
| Page: 1 2 3 4 5 6 7 8 9 10 11 12 13 |
Top |
Related drugs of malignant transformation related genes |
| Identification of chemicals and drugs interact with genes involved in malignant transfromation |
| (DGIdb 4.0) |
| Entrez ID | Symbol | Category | Interaction Types | Drug Claim Name | Drug Name | PMIDs |
| Page: 1 |

Copyright 2023-Present -The University of Texas Health Science Center at Houston |