
|
|||||
|
 | |
| |
| |
| |
| |
| |
|
Gene: NR2F1 |
Gene summary for NR2F1 |
| Gene information | Species | Human | Gene symbol | NR2F1 | Gene ID | 7025 |
| Gene name | nuclear receptor subfamily 2 group F member 1 | |
| Gene Alias | BBOAS | |
| Cytomap | 5q15 | |
| Gene Type | protein-coding | GO ID | GO:0000122 | UniProtAcc | P10589 |
Top |
Malignant transformation analysis |
| Identification of the aberrant gene expression in precancerous and cancerous lesions by comparing the gene expression of stem-like cells in diseased tissues with normal stem cells |
| Entrez ID | Symbol | Replicates | Species | Organ | Tissue | Adj P-value | Log2FC | Malignancy |
| 7025 | NR2F1 | GSM4909290 | Human | Breast | IDC | 1.74e-06 | 1.57e-01 | 0.2096 |
| 7025 | NR2F1 | GSM4909293 | Human | Breast | IDC | 4.63e-04 | 2.05e-01 | 0.1581 |
| 7025 | NR2F1 | GSM4909294 | Human | Breast | IDC | 4.23e-19 | 4.78e-01 | 0.2022 |
| 7025 | NR2F1 | GSM4909315 | Human | Breast | IDC | 1.90e-24 | 5.72e-01 | 0.21 |
| 7025 | NR2F1 | GSM4909316 | Human | Breast | IDC | 1.21e-12 | 5.83e-01 | 0.21 |
| 7025 | NR2F1 | P2 | Human | Breast | IDC | 3.75e-10 | 3.89e-01 | 0.21 |
| 7025 | NR2F1 | HCC1_Meng | Human | Liver | HCC | 1.58e-95 | 3.73e-01 | 0.0246 |
| 7025 | NR2F1 | cirrhotic3 | Human | Liver | Cirrhotic | 3.41e-09 | 3.37e-01 | 0.0215 |
| 7025 | NR2F1 | HCC1 | Human | Liver | HCC | 2.69e-08 | 3.07e+00 | 0.5336 |
| 7025 | NR2F1 | Pt14.a | Human | Liver | HCC | 1.07e-02 | 2.41e-01 | 0.0169 |
| 7025 | NR2F1 | S014 | Human | Liver | HCC | 1.16e-21 | 9.75e-01 | 0.2254 |
| 7025 | NR2F1 | S015 | Human | Liver | HCC | 8.69e-16 | 9.63e-01 | 0.2375 |
| 7025 | NR2F1 | S016 | Human | Liver | HCC | 3.09e-33 | 1.23e+00 | 0.2243 |
| 7025 | NR2F1 | S027 | Human | Liver | HCC | 4.54e-03 | 5.20e-01 | 0.2446 |
| 7025 | NR2F1 | S028 | Human | Liver | HCC | 5.72e-13 | 6.03e-01 | 0.2503 |
| 7025 | NR2F1 | S029 | Human | Liver | HCC | 1.09e-10 | 5.41e-01 | 0.2581 |
| 7025 | NR2F1 | male-WTA | Human | Thyroid | PTC | 4.82e-02 | 6.81e-02 | 0.1037 |
| 7025 | NR2F1 | PTC04 | Human | Thyroid | PTC | 5.14e-03 | 1.28e-01 | 0.1927 |
| 7025 | NR2F1 | PTC05 | Human | Thyroid | PTC | 3.67e-16 | 6.37e-01 | 0.2065 |
| 7025 | NR2F1 | PTC06 | Human | Thyroid | PTC | 2.26e-06 | 2.64e-01 | 0.2057 |
| Page: 1 2 |
| Tissue | Expression Dynamics | Abbreviation |
| Breast | 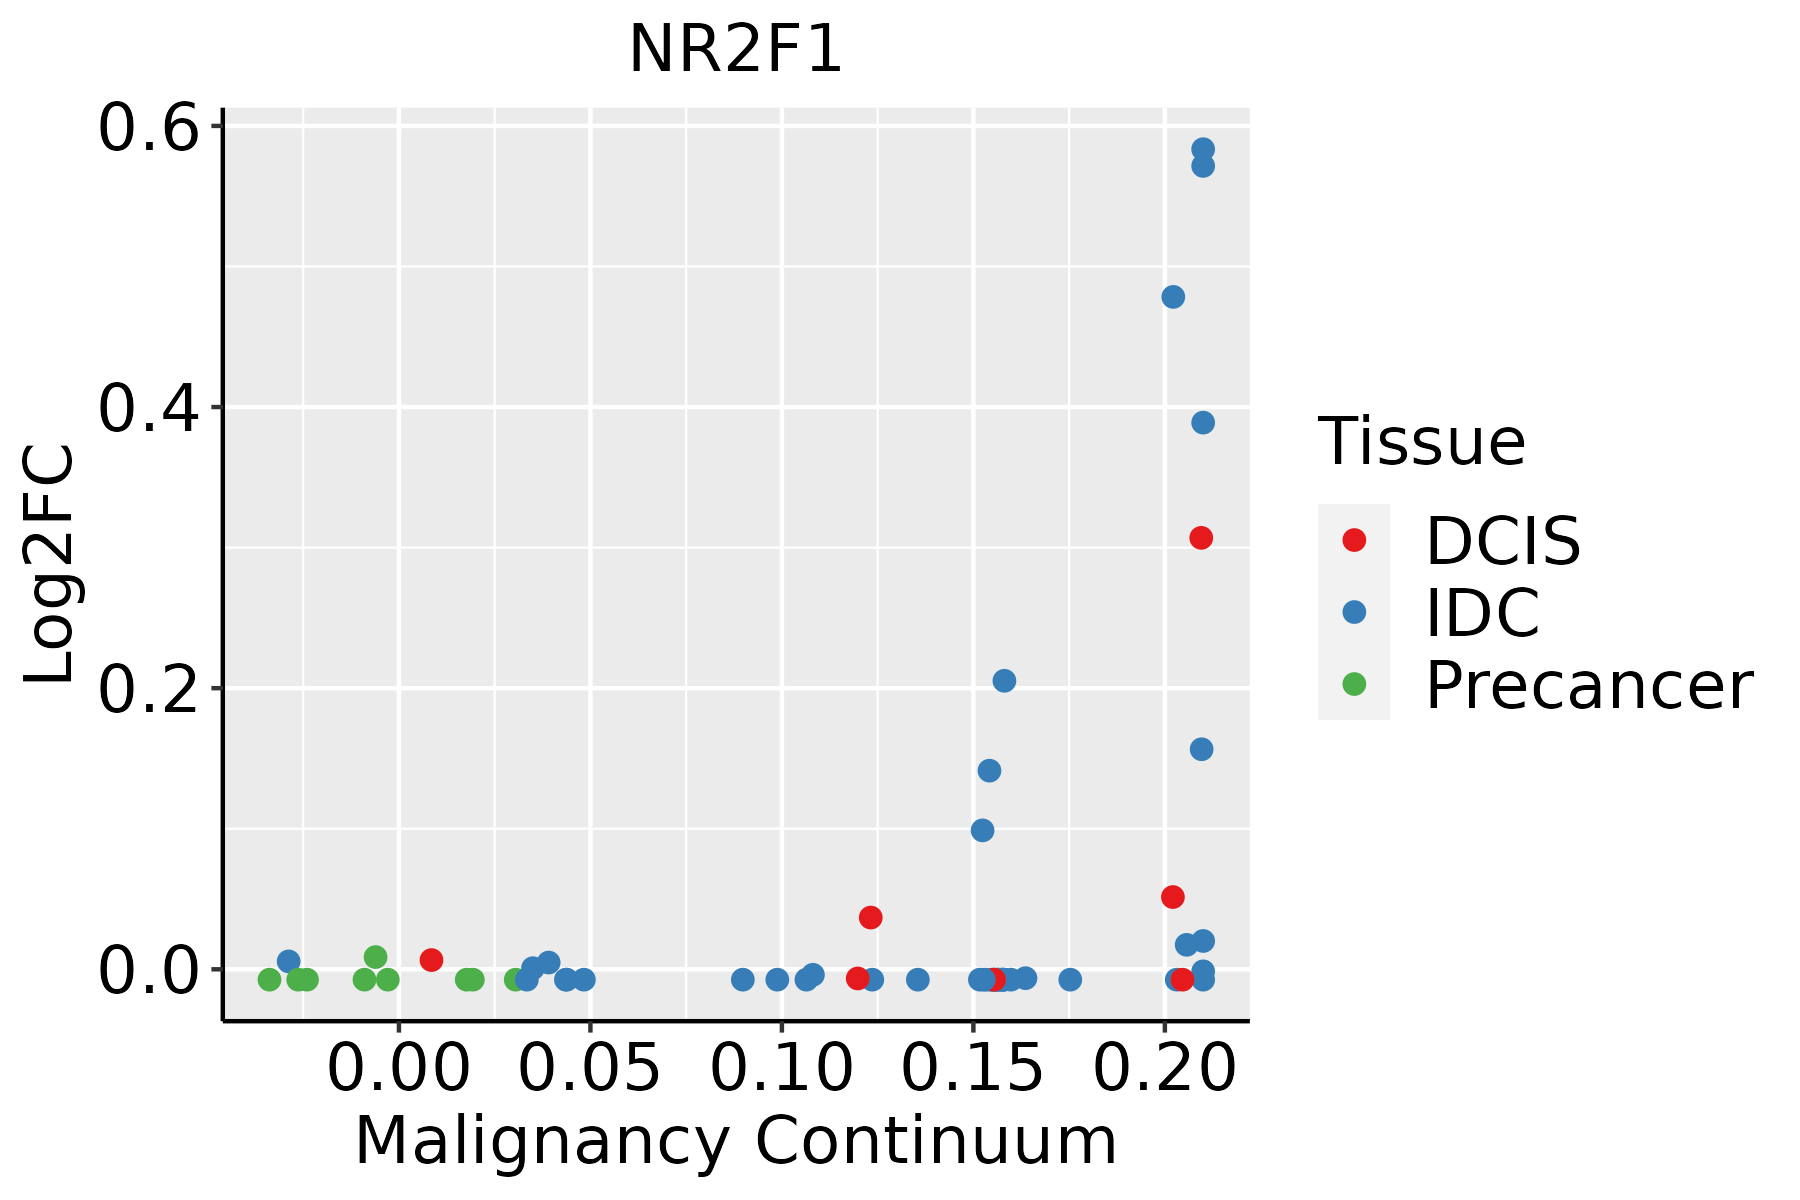 | IDC: Invasive ductal carcinoma |
| DCIS: Ductal carcinoma in situ | ||
| Precancer(BRCA1-mut): Precancerous lesion from BRCA1 mutation carriers | ||
| Liver | 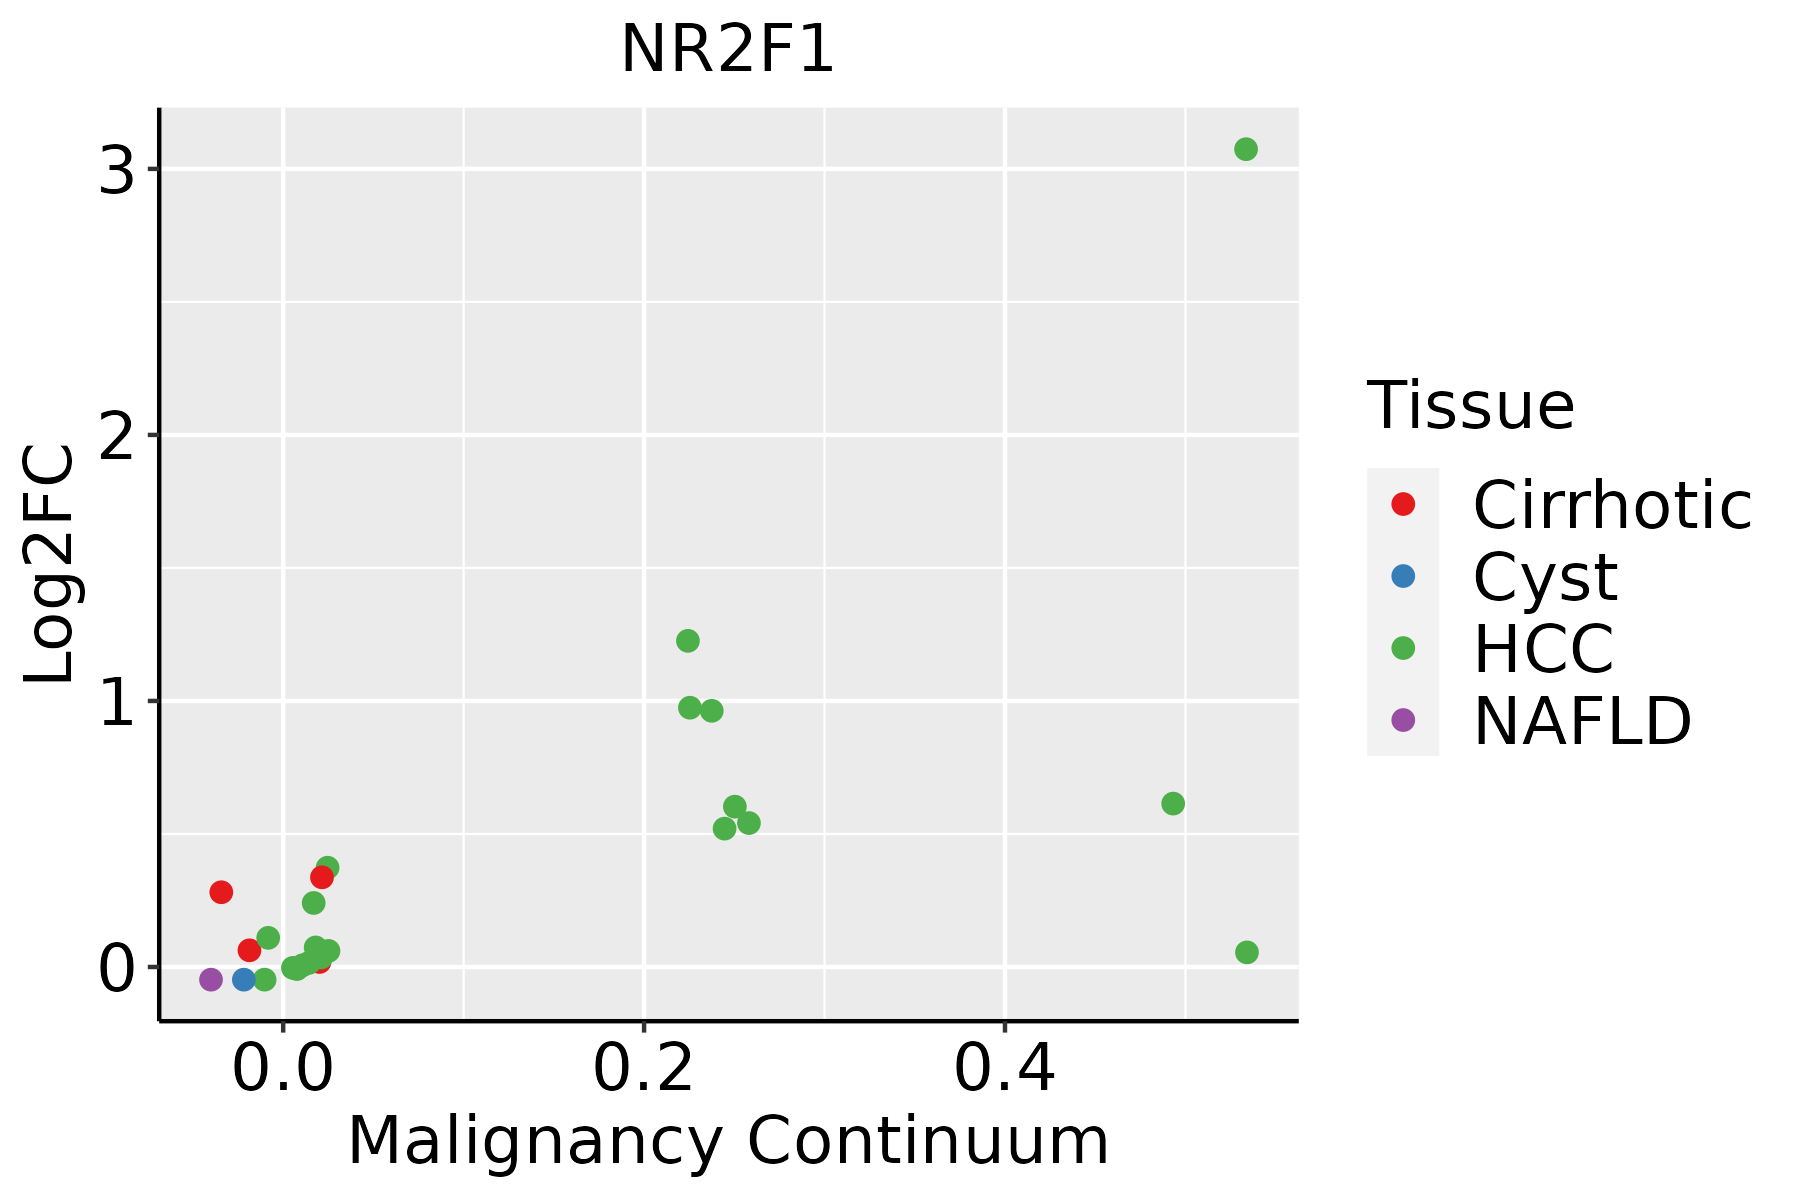 | HCC: Hepatocellular carcinoma |
| NAFLD: Non-alcoholic fatty liver disease | ||
| Thyroid | 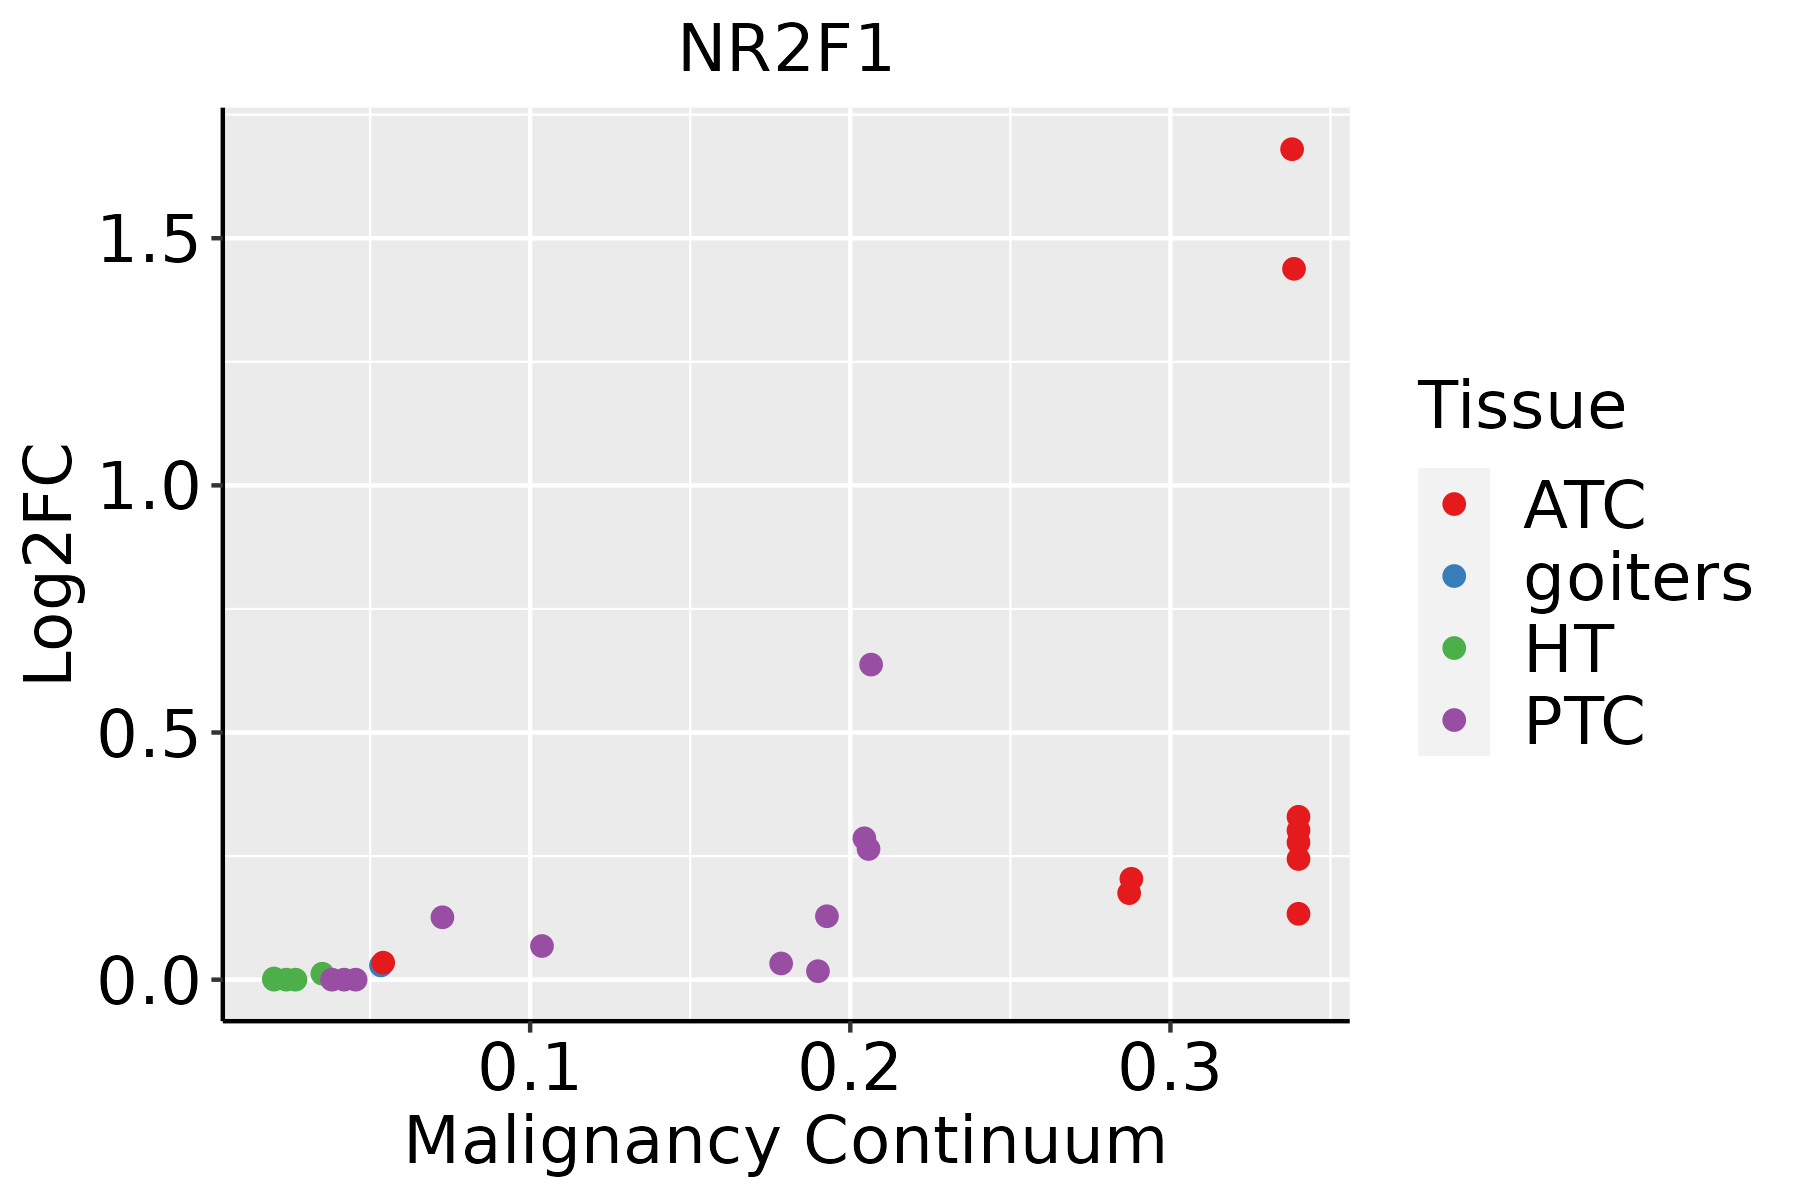 | ATC: Anaplastic thyroid cancer |
| HT: Hashimoto's thyroiditis | ||
| PTC: Papillary thyroid cancer |
| ∗log2FC in expression of this searched gene in stem-like cells from each diseased tissue sample relative to stem-like cells in normal samples in each tissue plotted against the malignancy continuum. Samples are colored based on if they are from different disease stage. |
Top |
Malignant transformation related pathway analysis |
| Find out the enriched GO biological processes and KEGG pathways involved in transition from healthy to precancer to cancer |
| Tissue | Disease Stage | Enriched GO biological Processes |
| Breast | Precancer |  |
| Breast | IDC |  |
| Breast | DCIS |  |
| Cervix | CC |  |
| Cervix | HSIL_HPV |  |
| ∗Top 15 enriched GO BP terms are showed in the bar plot of each disease state in each tissue. Each row represents a significant GO biological process which is colored according to the -log10(p.adjust). |
| Page: 1 2 3 4 5 6 7 8 9 |
| GO ID | Tissue | Disease Stage | Description | Gene Ratio | Bg Ratio | pvalue | p.adjust | Count |
| GO:003052214 | Breast | IDC | intracellular receptor signaling pathway | 37/1434 | 265/18723 | 2.77e-04 | 4.26e-03 | 37 |
| GO:003052212 | Liver | Cirrhotic | intracellular receptor signaling pathway | 105/4634 | 265/18723 | 5.44e-08 | 1.69e-06 | 105 |
| GO:003052222 | Liver | HCC | intracellular receptor signaling pathway | 171/7958 | 265/18723 | 3.00e-13 | 1.61e-11 | 171 |
| GO:001097511 | Liver | HCC | regulation of neuron projection development | 220/7958 | 445/18723 | 1.68e-03 | 8.78e-03 | 220 |
| GO:003052228 | Thyroid | PTC | intracellular receptor signaling pathway | 126/5968 | 265/18723 | 6.31e-08 | 1.31e-06 | 126 |
| GO:0010975110 | Thyroid | PTC | regulation of neuron projection development | 194/5968 | 445/18723 | 1.05e-07 | 2.08e-06 | 194 |
| GO:00313459 | Thyroid | PTC | negative regulation of cell projection organization | 83/5968 | 186/18723 | 1.72e-04 | 1.32e-03 | 83 |
| GO:00109778 | Thyroid | PTC | negative regulation of neuron projection development | 63/5968 | 137/18723 | 3.70e-04 | 2.50e-03 | 63 |
| GO:001097523 | Thyroid | ATC | regulation of neuron projection development | 212/6293 | 445/18723 | 4.16e-10 | 1.14e-08 | 212 |
| GO:0030522112 | Thyroid | ATC | intracellular receptor signaling pathway | 134/6293 | 265/18723 | 7.58e-09 | 1.63e-07 | 134 |
| GO:003134514 | Thyroid | ATC | negative regulation of cell projection organization | 86/6293 | 186/18723 | 2.25e-04 | 1.46e-03 | 86 |
| GO:001097712 | Thyroid | ATC | negative regulation of neuron projection development | 66/6293 | 137/18723 | 2.82e-04 | 1.80e-03 | 66 |
| Page: 1 |
| Pathway ID | Tissue | Disease Stage | Description | Gene Ratio | Bg Ratio | pvalue | p.adjust | qvalue | Count |
| Page: 1 |
Top |
Cell-cell communication analysis |
| Identification of potential cell-cell interactions between two cell types and their ligand-receptor pairs for different disease states |
| Ligand | Receptor | LRpair | Pathway | Tissue | Disease Stage |
| Page: 1 |
Top |
Single-cell gene regulatory network inference analysis |
| Find out the significant the regulons (TFs) and the target genes of each regulon across cell types for different disease states |
| TF | Cell Type | Tissue | Disease Stage | Target Gene | RSS | Regulon Activity |
| NR2F1 | ECM | Breast | ADJ | MDK,MIR99AHG,SELENOP, etc. | 8.12e-03 |  |
| NR2F1 | ECM | Breast | DCIS | MDK,MIR99AHG,SELENOP, etc. | 3.67e-01 |  |
| NR2F1 | FIB | Breast | Healthy | MDK,MIR99AHG,SELENOP, etc. | 2.43e-02 |  |
| NR2F1 | LYMEND | Breast | Healthy | MDK,MIR99AHG,SELENOP, etc. | 1.63e-02 | |
| NR2F1 | INCAF | Breast | Healthy | MDK,MIR99AHG,SELENOP, etc. | 1.39e-01 | |
| NR2F1 | ECM | Breast | IDC | MDK,MIR99AHG,SELENOP, etc. | 2.75e-01 |  |
| NR2F1 | LYMEND | Breast | Precancer | MDK,MIR99AHG,SELENOP, etc. | 3.31e-02 |  |
| NR2F1 | INCAF | Breast | Precancer | MDK,MIR99AHG,SELENOP, etc. | 1.37e-01 | |
| NR2F1 | ECM | Breast | Precancer | MDK,MIR99AHG,SELENOP, etc. | 3.38e-02 | |
| NR2F1 | BAS | Cervix | HSIL_HPV | ZDHHC23,COL1A1,UTP3, etc. | 6.39e-02 |  |
| ∗The dot plots of a searched regulon are shown for all cell subpopulations in each disease state of each tissue based on the regulon specific score inferred using pySCENIC and by calculating the average expression. |
| Page: 1 2 3 |
Top |
Somatic mutation of malignant transformation related genes |
| Annotation of somatic variants for genes involved in malignant transformation |
| Hugo Symbol | Variant Class | Variant Classification | dbSNP RS | HGVSc | HGVSp | HGVSp Short | SWISSPROT | BIOTYPE | SIFT | PolyPhen | Tumor Sample Barcode | Tissue | Histology | Sex | Age | Stage | Therapy Types | Drugs | Outcome |
| NR2F1 | SNV | Missense_Mutation | rs776020140 | c.1051N>A | p.Ala351Thr | p.A351T | P10589 | protein_coding | tolerated(0.1) | probably_damaging(1) | TCGA-3C-AALI-01 | Breast | breast invasive carcinoma | Female | <65 | I/II | Unspecific | Poly E | Complete Response |
| NR2F1 | SNV | Missense_Mutation | novel | c.713N>A | p.Pro238His | p.P238H | P10589 | protein_coding | deleterious(0.01) | probably_damaging(1) | TCGA-AC-A6IW-01 | Breast | breast invasive carcinoma | Female | >=65 | I/II | Unknown | Unknown | SD |
| NR2F1 | SNV | Missense_Mutation | c.526N>A | p.Gly176Arg | p.G176R | P10589 | protein_coding | tolerated(0.08) | benign(0.325) | TCGA-E2-A1LH-01 | Breast | breast invasive carcinoma | Female | <65 | I/II | Chemotherapy | adriamycin | SD | |
| NR2F1 | SNV | Missense_Mutation | novel | c.838G>A | p.Ala280Thr | p.A280T | P10589 | protein_coding | tolerated(0.08) | possibly_damaging(0.754) | TCGA-2W-A8YY-01 | Cervix | cervical & endocervical cancer | Female | <65 | I/II | Chemotherapy | cisplatin | CR |
| NR2F1 | SNV | Missense_Mutation | c.1112N>G | p.Leu371Arg | p.L371R | P10589 | protein_coding | deleterious(0) | probably_damaging(1) | TCGA-A6-6780-01 | Colorectum | colon adenocarcinoma | Male | >=65 | I/II | Unknown | Unknown | SD | |
| NR2F1 | SNV | Missense_Mutation | c.673N>T | p.Arg225Cys | p.R225C | P10589 | protein_coding | deleterious(0) | probably_damaging(1) | TCGA-AA-3672-01 | Colorectum | colon adenocarcinoma | Female | >=65 | III/IV | Unknown | Unknown | SD | |
| NR2F1 | SNV | Missense_Mutation | novel | c.464N>T | p.Ala155Val | p.A155V | P10589 | protein_coding | deleterious(0.01) | benign(0.282) | TCGA-CA-6717-01 | Colorectum | colon adenocarcinoma | Male | <65 | I/II | Chemotherapy | oxaliplatin | CR |
| NR2F1 | SNV | Missense_Mutation | novel | c.569N>T | p.Ser190Leu | p.S190L | P10589 | protein_coding | deleterious(0.01) | benign(0.436) | TCGA-CA-6717-01 | Colorectum | colon adenocarcinoma | Male | <65 | I/II | Chemotherapy | oxaliplatin | CR |
| NR2F1 | SNV | Missense_Mutation | c.463N>A | p.Ala155Thr | p.A155T | P10589 | protein_coding | deleterious(0) | benign(0.031) | TCGA-D5-6928-01 | Colorectum | colon adenocarcinoma | Male | >=65 | I/II | Unknown | Unknown | SD | |
| NR2F1 | SNV | Missense_Mutation | c.904T>G | p.Phe302Val | p.F302V | P10589 | protein_coding | deleterious(0) | possibly_damaging(0.742) | TCGA-AG-A002-01 | Colorectum | rectum adenocarcinoma | Male | <65 | I/II | Unknown | Unknown | SD |
| Page: 1 2 3 4 5 6 |
Top |
Related drugs of malignant transformation related genes |
| Identification of chemicals and drugs interact with genes involved in malignant transfromation |
| (DGIdb 4.0) |
| Entrez ID | Symbol | Category | Interaction Types | Drug Claim Name | Drug Name | PMIDs |
| Page: 1 |

Copyright 2023-Present -The University of Texas Health Science Center at Houston |