
|
|||||
|
 | |
| |
| |
| |
| |
| |
|
Gene: NGFRAP1 |
Gene summary for NGFRAP1 |
| Gene information | Species | Human | Gene symbol | NGFRAP1 | Gene ID | 27018 |
| Gene name | brain expressed X-linked 3 | |
| Gene Alias | Bex | |
| Cytomap | Xq22.2 | |
| Gene Type | protein-coding | GO ID | GO:0006508 | UniProtAcc | Q00994 |
Top |
Malignant transformation analysis |
| Identification of the aberrant gene expression in precancerous and cancerous lesions by comparing the gene expression of stem-like cells in diseased tissues with normal stem cells |
| Entrez ID | Symbol | Replicates | Species | Organ | Tissue | Adj P-value | Log2FC | Malignancy |
| 27018 | NGFRAP1 | P1T-E | Human | Esophagus | ESCC | 5.33e-46 | 2.68e+00 | 0.0875 |
| 27018 | NGFRAP1 | P2T-E | Human | Esophagus | ESCC | 2.78e-144 | 2.78e+00 | 0.1177 |
| 27018 | NGFRAP1 | P4T-E | Human | Esophagus | ESCC | 1.01e-112 | 2.74e+00 | 0.1323 |
| 27018 | NGFRAP1 | P5T-E | Human | Esophagus | ESCC | 2.68e-128 | 2.57e+00 | 0.1327 |
| 27018 | NGFRAP1 | P8T-E | Human | Esophagus | ESCC | 6.40e-148 | 2.92e+00 | 0.0889 |
| 27018 | NGFRAP1 | P9T-E | Human | Esophagus | ESCC | 3.59e-100 | 2.41e+00 | 0.1131 |
| 27018 | NGFRAP1 | P10T-E | Human | Esophagus | ESCC | 1.09e-146 | 3.07e+00 | 0.116 |
| 27018 | NGFRAP1 | P11T-E | Human | Esophagus | ESCC | 1.00e-62 | 2.13e+00 | 0.1426 |
| 27018 | NGFRAP1 | P12T-E | Human | Esophagus | ESCC | 4.82e-100 | 2.02e+00 | 0.1122 |
| 27018 | NGFRAP1 | P15T-E | Human | Esophagus | ESCC | 2.55e-106 | 2.51e+00 | 0.1149 |
| 27018 | NGFRAP1 | P16T-E | Human | Esophagus | ESCC | 2.22e-126 | 2.35e+00 | 0.1153 |
| 27018 | NGFRAP1 | P17T-E | Human | Esophagus | ESCC | 1.28e-43 | 1.76e+00 | 0.1278 |
| 27018 | NGFRAP1 | P19T-E | Human | Esophagus | ESCC | 1.48e-28 | 2.18e+00 | 0.1662 |
| 27018 | NGFRAP1 | P20T-E | Human | Esophagus | ESCC | 3.62e-76 | 1.56e+00 | 0.1124 |
| 27018 | NGFRAP1 | P21T-E | Human | Esophagus | ESCC | 3.10e-105 | 1.70e+00 | 0.1617 |
| 27018 | NGFRAP1 | P22T-E | Human | Esophagus | ESCC | 3.05e-160 | 3.47e+00 | 0.1236 |
| 27018 | NGFRAP1 | P23T-E | Human | Esophagus | ESCC | 1.60e-91 | 2.71e+00 | 0.108 |
| 27018 | NGFRAP1 | P24T-E | Human | Esophagus | ESCC | 1.03e-89 | 1.66e+00 | 0.1287 |
| 27018 | NGFRAP1 | P26T-E | Human | Esophagus | ESCC | 2.54e-134 | 2.89e+00 | 0.1276 |
| 27018 | NGFRAP1 | P27T-E | Human | Esophagus | ESCC | 4.26e-95 | 1.73e+00 | 0.1055 |
| Page: 1 2 3 4 5 6 7 8 |
| Tissue | Expression Dynamics | Abbreviation |
| Esophagus | 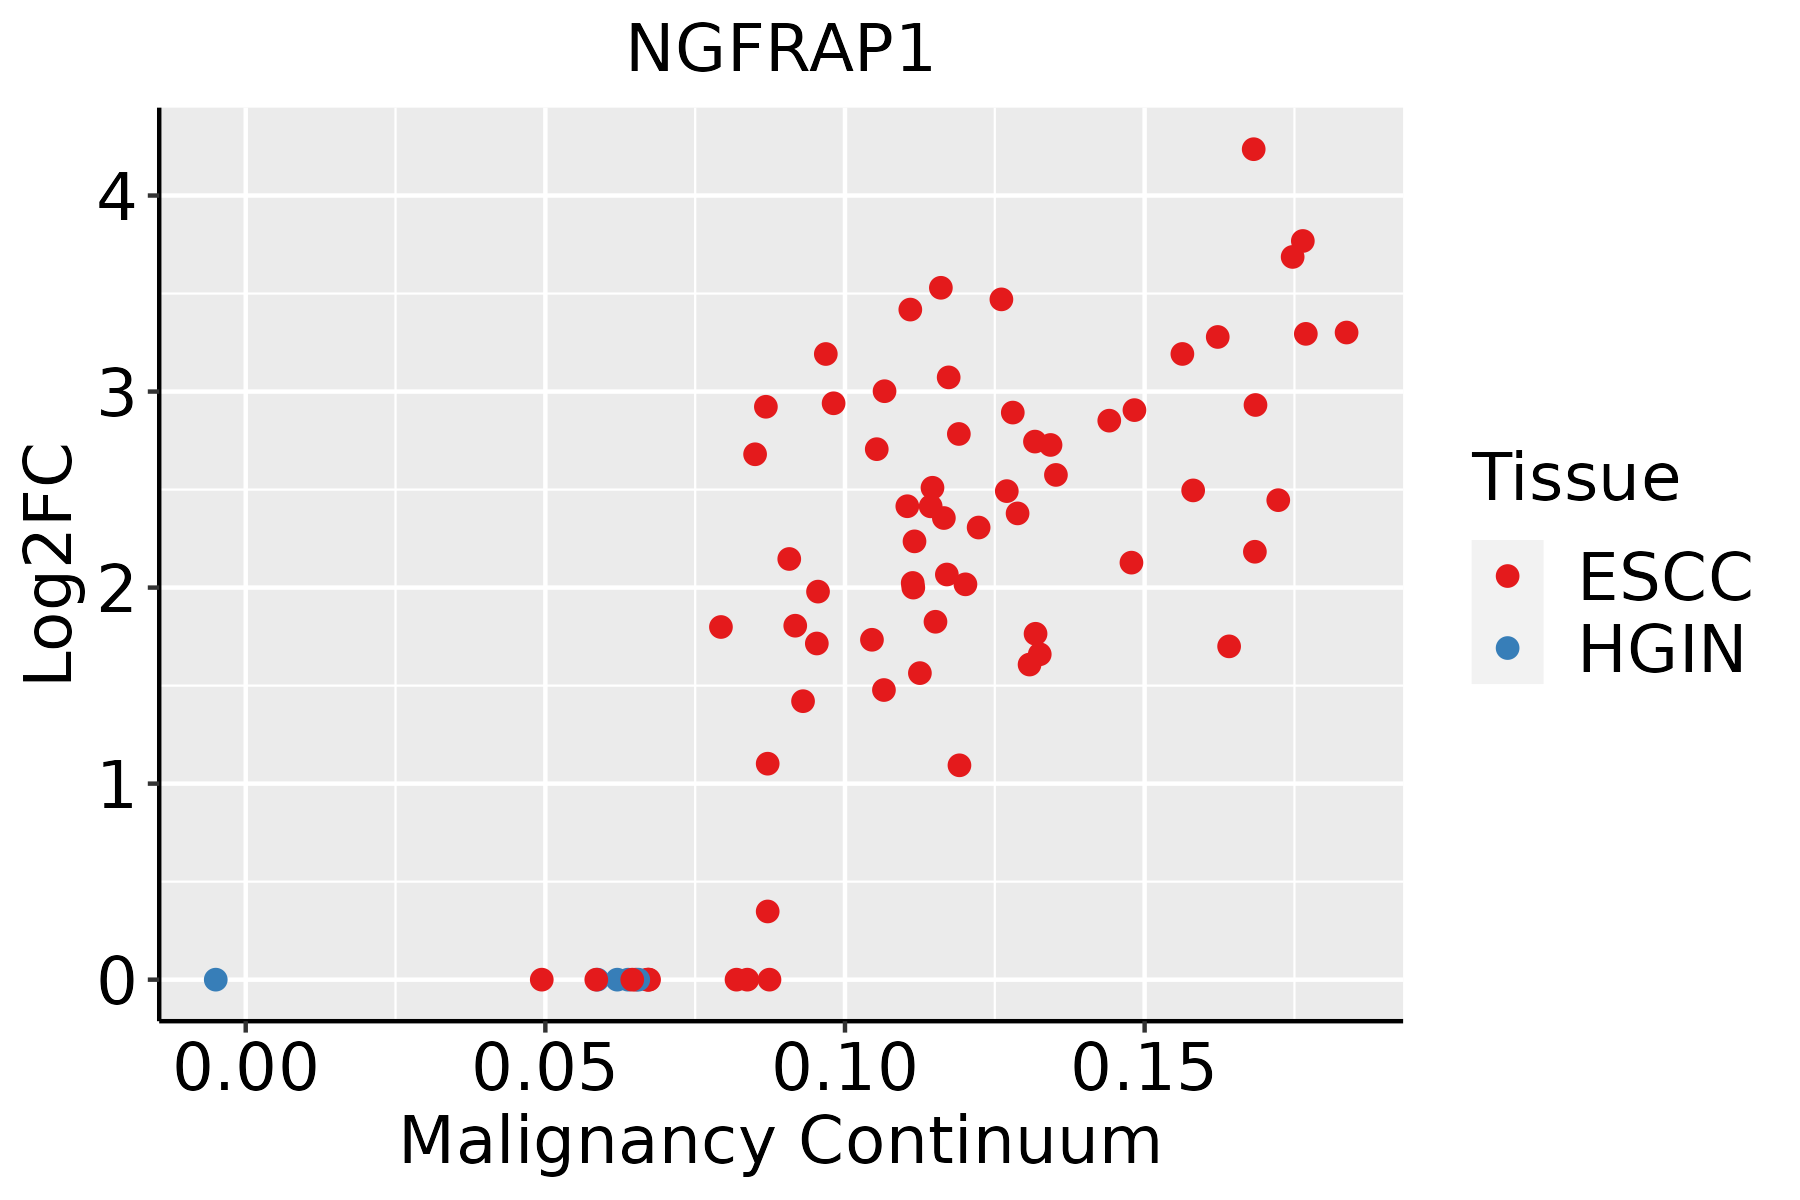 | ESCC: Esophageal squamous cell carcinoma |
| HGIN: High-grade intraepithelial neoplasias | ||
| LGIN: Low-grade intraepithelial neoplasias | ||
| Liver |  | HCC: Hepatocellular carcinoma |
| NAFLD: Non-alcoholic fatty liver disease | ||
| Oral Cavity | 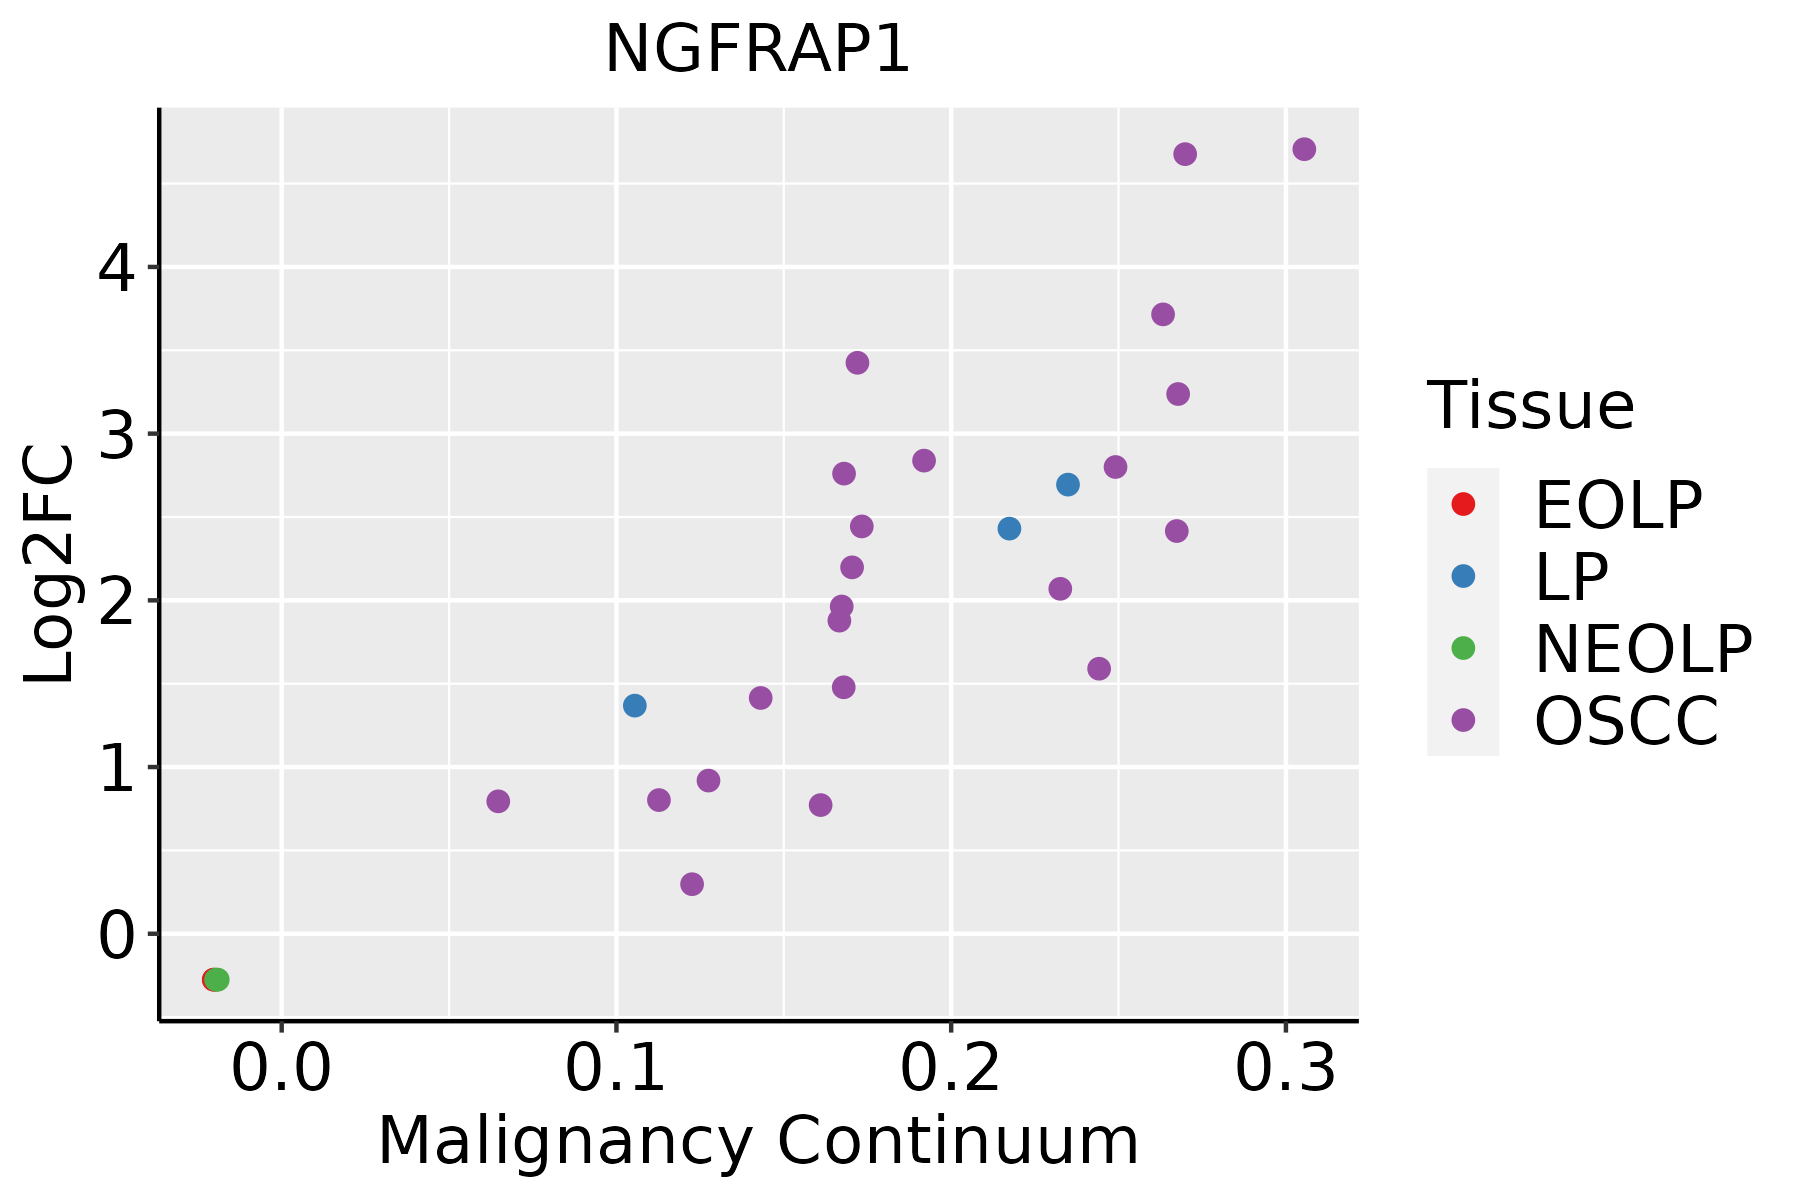 | EOLP: Erosive Oral lichen planus |
| LP: leukoplakia | ||
| NEOLP: Non-erosive oral lichen planus | ||
| OSCC: Oral squamous cell carcinoma | ||
| Prostate | 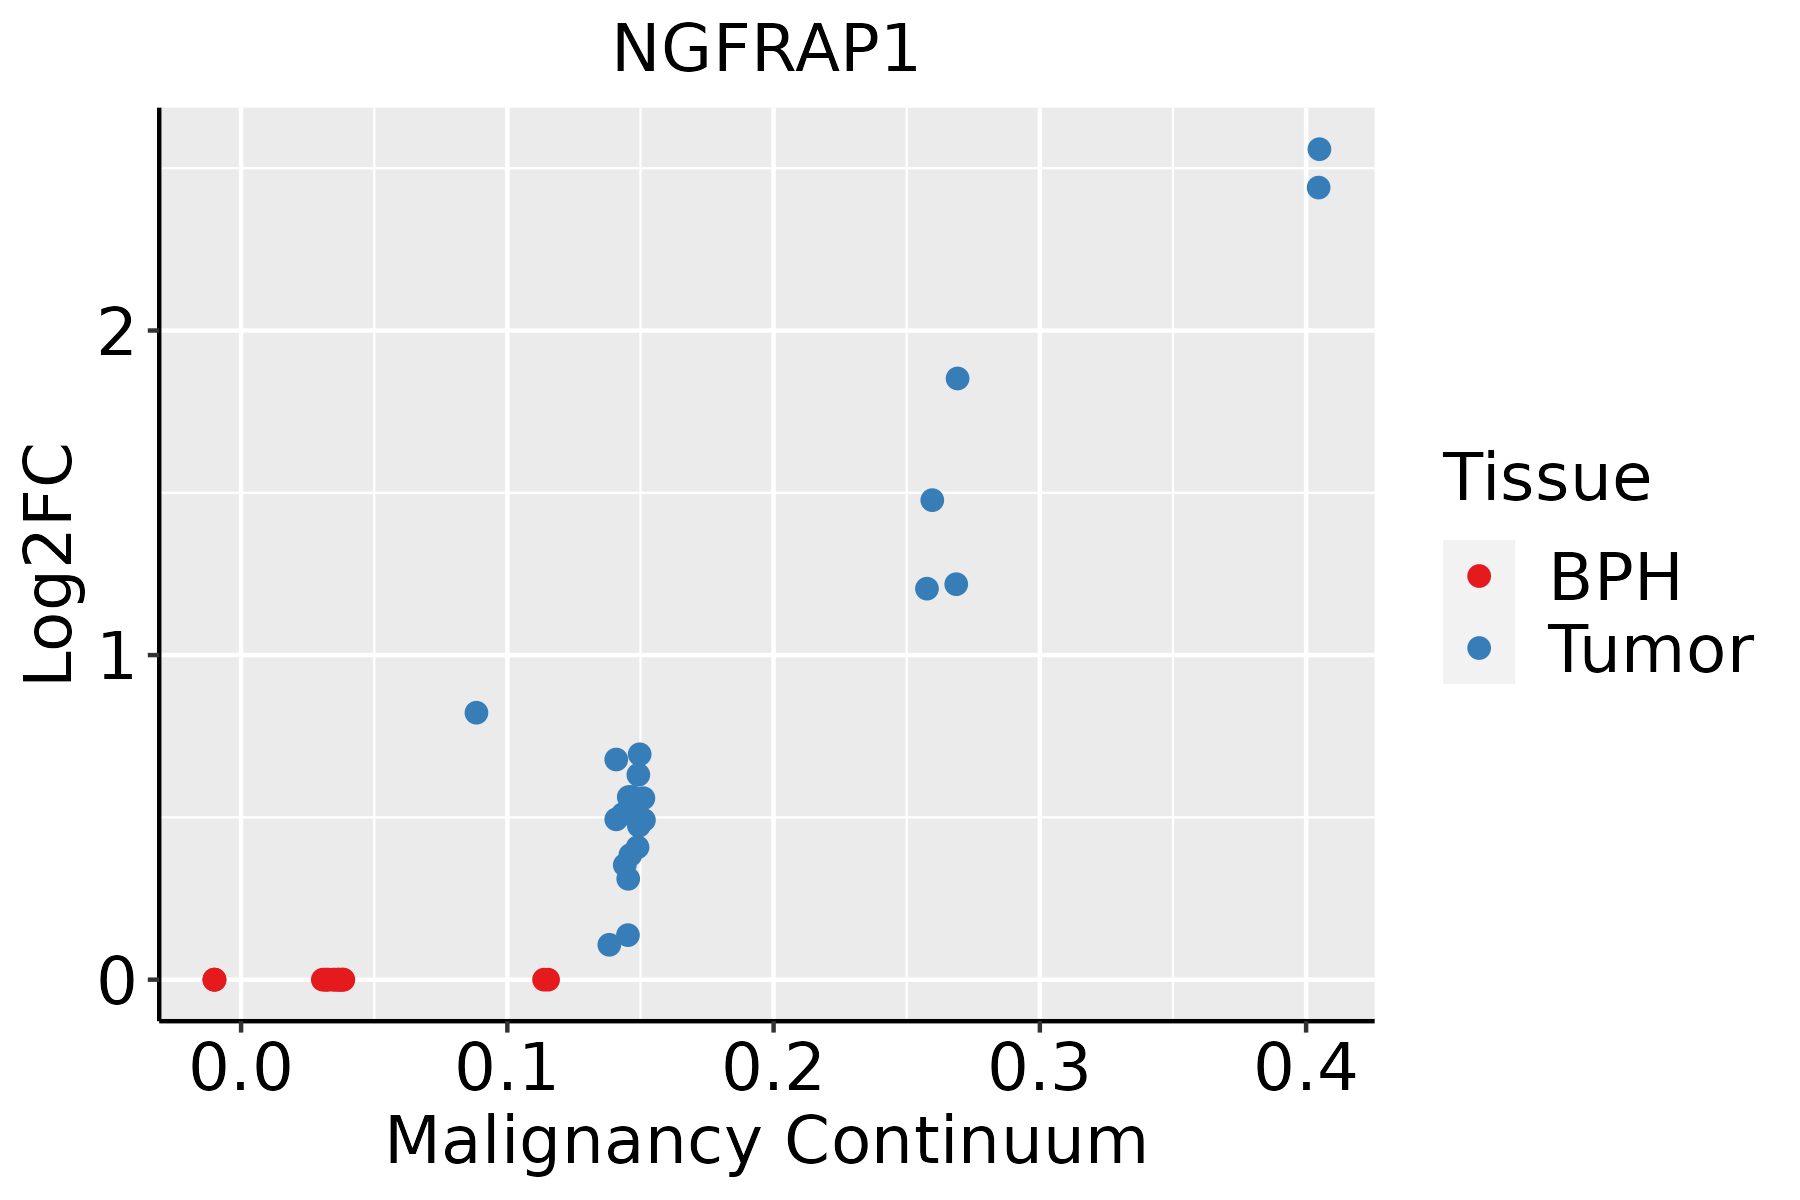 | BPH: Benign Prostatic Hyperplasia |
| Skin | 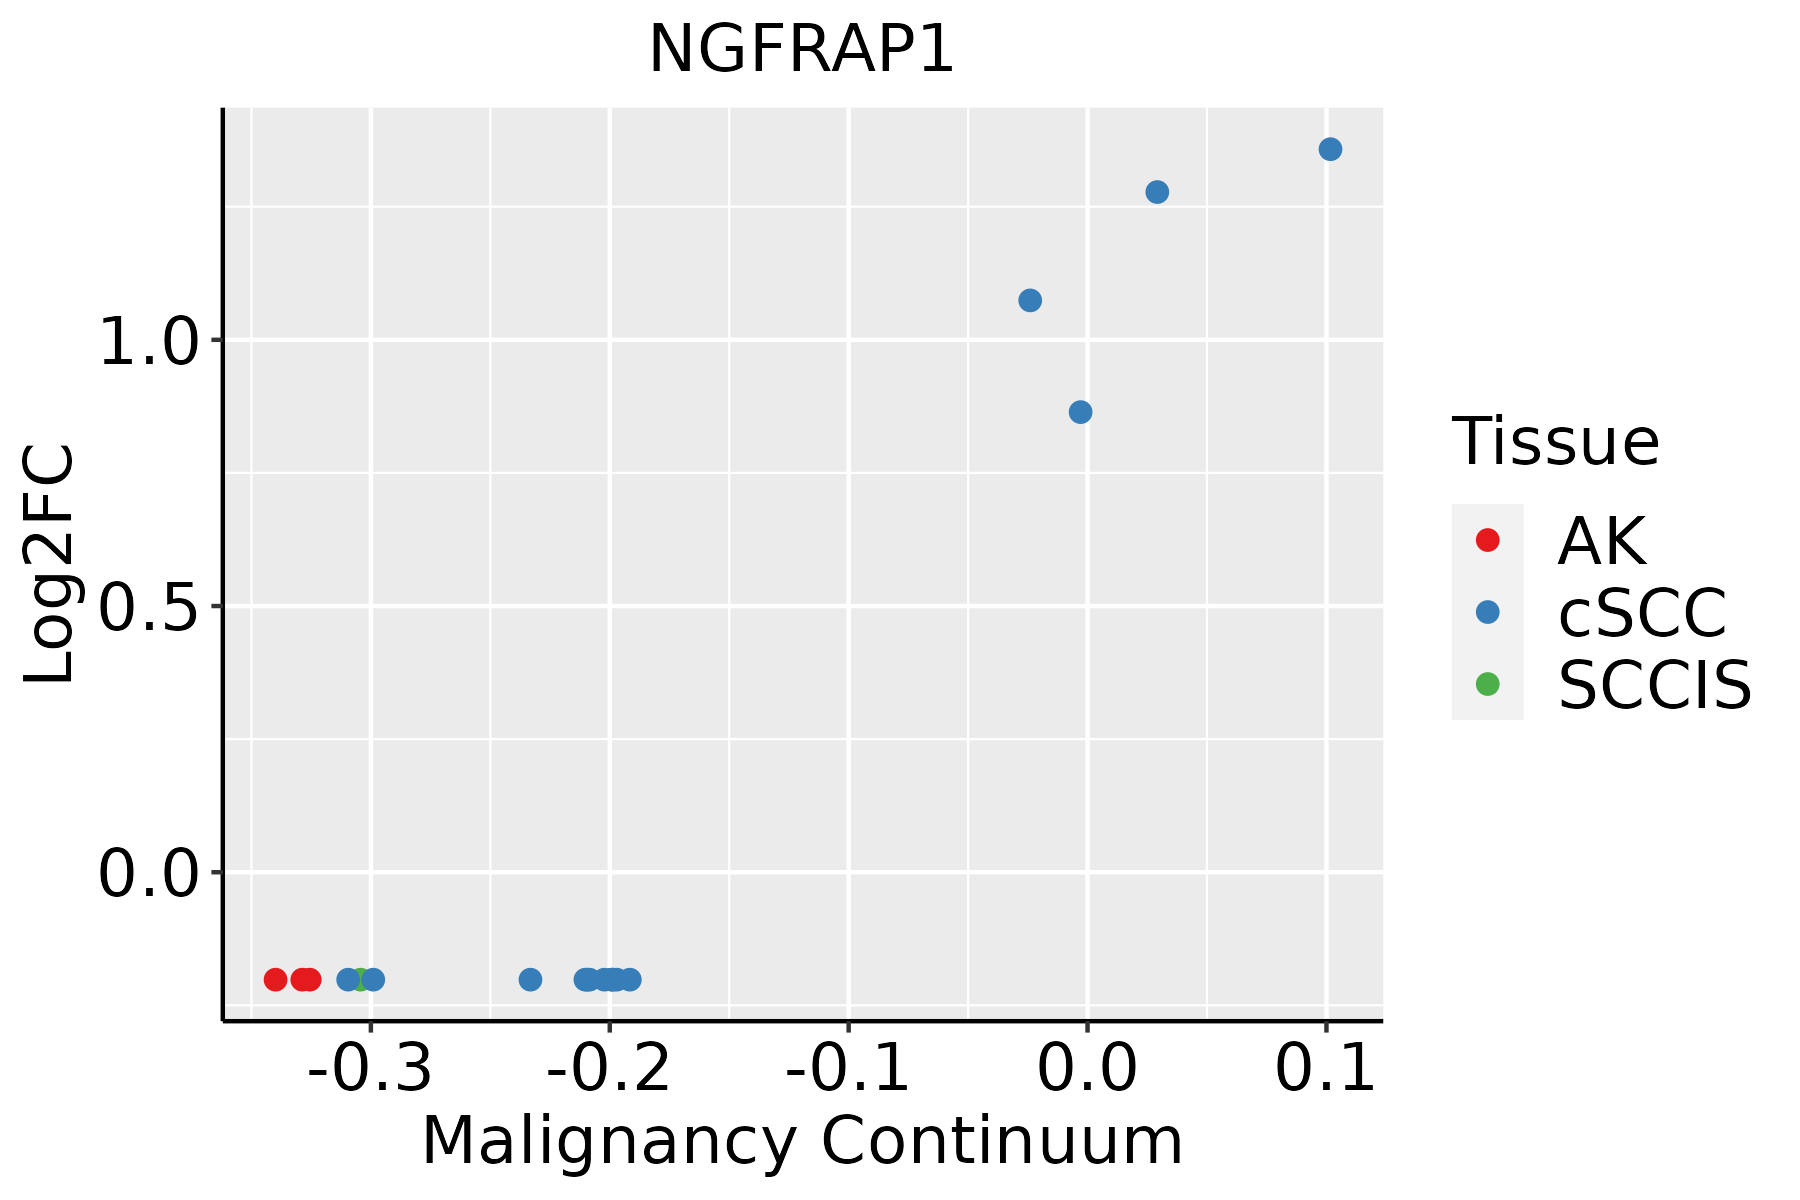 | AK: Actinic keratosis |
| cSCC: Cutaneous squamous cell carcinoma | ||
| SCCIS:squamous cell carcinoma in situ |
| ∗log2FC in expression of this searched gene in stem-like cells from each diseased tissue sample relative to stem-like cells in normal samples in each tissue plotted against the malignancy continuum. Samples are colored based on if they are from different disease stage. |
Top |
Malignant transformation related pathway analysis |
| Find out the enriched GO biological processes and KEGG pathways involved in transition from healthy to precancer to cancer |
| Tissue | Disease Stage | Enriched GO biological Processes |
| Breast | Precancer |  |
| Breast | IDC |  |
| Breast | DCIS |  |
| Cervix | CC |  |
| Cervix | HSIL_HPV |  |
| ∗Top 15 enriched GO BP terms are showed in the bar plot of each disease state in each tissue. Each row represents a significant GO biological process which is colored according to the -log10(p.adjust). |
| Page: 1 2 3 4 5 6 7 8 9 |
| GO ID | Tissue | Disease Stage | Description | Gene Ratio | Bg Ratio | pvalue | p.adjust | Count |
| Page: 1 |
| Pathway ID | Tissue | Disease Stage | Description | Gene Ratio | Bg Ratio | pvalue | p.adjust | qvalue | Count |
| hsa04722 | Colorectum | AD | Neurotrophin signaling pathway | 50/2092 | 119/8465 | 2.28e-05 | 2.24e-04 | 1.43e-04 | 50 |
| hsa047221 | Colorectum | AD | Neurotrophin signaling pathway | 50/2092 | 119/8465 | 2.28e-05 | 2.24e-04 | 1.43e-04 | 50 |
| hsa047222 | Colorectum | SER | Neurotrophin signaling pathway | 35/1580 | 119/8465 | 2.80e-03 | 2.02e-02 | 1.47e-02 | 35 |
| hsa047223 | Colorectum | SER | Neurotrophin signaling pathway | 35/1580 | 119/8465 | 2.80e-03 | 2.02e-02 | 1.47e-02 | 35 |
| hsa047224 | Colorectum | MSS | Neurotrophin signaling pathway | 45/1875 | 119/8465 | 7.04e-05 | 6.55e-04 | 4.02e-04 | 45 |
| hsa047225 | Colorectum | MSS | Neurotrophin signaling pathway | 45/1875 | 119/8465 | 7.04e-05 | 6.55e-04 | 4.02e-04 | 45 |
| hsa0472216 | Endometrium | AEH | Neurotrophin signaling pathway | 31/1197 | 119/8465 | 4.07e-04 | 3.07e-03 | 2.25e-03 | 31 |
| hsa0472217 | Endometrium | AEH | Neurotrophin signaling pathway | 31/1197 | 119/8465 | 4.07e-04 | 3.07e-03 | 2.25e-03 | 31 |
| hsa0472222 | Endometrium | EEC | Neurotrophin signaling pathway | 30/1237 | 119/8465 | 1.54e-03 | 9.55e-03 | 7.12e-03 | 30 |
| hsa0472232 | Endometrium | EEC | Neurotrophin signaling pathway | 30/1237 | 119/8465 | 1.54e-03 | 9.55e-03 | 7.12e-03 | 30 |
| hsa0472225 | Esophagus | ESCC | Neurotrophin signaling pathway | 80/4205 | 119/8465 | 7.33e-05 | 3.07e-04 | 1.57e-04 | 80 |
| hsa04722111 | Esophagus | ESCC | Neurotrophin signaling pathway | 80/4205 | 119/8465 | 7.33e-05 | 3.07e-04 | 1.57e-04 | 80 |
| hsa0472210 | Liver | HCC | Neurotrophin signaling pathway | 74/4020 | 119/8465 | 8.27e-04 | 3.26e-03 | 1.81e-03 | 74 |
| hsa0472211 | Liver | HCC | Neurotrophin signaling pathway | 74/4020 | 119/8465 | 8.27e-04 | 3.26e-03 | 1.81e-03 | 74 |
| hsa0472218 | Prostate | BPH | Neurotrophin signaling pathway | 38/1718 | 119/8465 | 1.76e-03 | 7.16e-03 | 4.43e-03 | 38 |
| hsa0472219 | Prostate | BPH | Neurotrophin signaling pathway | 38/1718 | 119/8465 | 1.76e-03 | 7.16e-03 | 4.43e-03 | 38 |
| hsa0472223 | Prostate | Tumor | Neurotrophin signaling pathway | 39/1791 | 119/8465 | 2.01e-03 | 8.10e-03 | 5.02e-03 | 39 |
| hsa0472233 | Prostate | Tumor | Neurotrophin signaling pathway | 39/1791 | 119/8465 | 2.01e-03 | 8.10e-03 | 5.02e-03 | 39 |
| Page: 1 |
Top |
Cell-cell communication analysis |
| Identification of potential cell-cell interactions between two cell types and their ligand-receptor pairs for different disease states |
| Ligand | Receptor | LRpair | Pathway | Tissue | Disease Stage |
| Page: 1 |
Top |
Single-cell gene regulatory network inference analysis |
| Find out the significant the regulons (TFs) and the target genes of each regulon across cell types for different disease states |
| TF | Cell Type | Tissue | Disease Stage | Target Gene | RSS | Regulon Activity |
| ∗The dot plots of a searched regulon are shown for all cell subpopulations in each disease state of each tissue based on the regulon specific score inferred using pySCENIC and by calculating the average expression. |
| Page: 1 |
Top |
Somatic mutation of malignant transformation related genes |
| Annotation of somatic variants for genes involved in malignant transformation |
| Hugo Symbol | Variant Class | Variant Classification | dbSNP RS | HGVSc | HGVSp | HGVSp Short | SWISSPROT | BIOTYPE | SIFT | PolyPhen | Tumor Sample Barcode | Tissue | Histology | Sex | Age | Stage | Therapy Types | Drugs | Outcome |
| Page: 1 |
Top |
Related drugs of malignant transformation related genes |
| Identification of chemicals and drugs interact with genes involved in malignant transfromation |
| (DGIdb 4.0) |
| Entrez ID | Symbol | Category | Interaction Types | Drug Claim Name | Drug Name | PMIDs |
| Page: 1 |

Copyright 2023-Present -The University of Texas Health Science Center at Houston |