
|
|||||
|
 | |
| |
| |
| |
| |
| |
|
Gene: MUC12 |
Gene summary for MUC12 |
| Gene information | Species | Human | Gene symbol | MUC12 | Gene ID | 10071 |
| Gene name | mucin 12, cell surface associated | |
| Gene Alias | MUC-11 | |
| Cytomap | 7q22.1 | |
| Gene Type | protein-coding | GO ID | GO:0001558 | UniProtAcc | Q9UKN1 |
Top |
Malignant transformation analysis |
| Identification of the aberrant gene expression in precancerous and cancerous lesions by comparing the gene expression of stem-like cells in diseased tissues with normal stem cells |
| Entrez ID | Symbol | Replicates | Species | Organ | Tissue | Adj P-value | Log2FC | Malignancy |
| 10071 | MUC12 | HTA11_3410_2000001011 | Human | Colorectum | AD | 3.87e-10 | -5.39e-01 | 0.0155 |
| 10071 | MUC12 | HTA11_1938_2000001011 | Human | Colorectum | AD | 5.10e-13 | -8.10e-01 | -0.0811 |
| 10071 | MUC12 | HTA11_78_2000001011 | Human | Colorectum | AD | 9.03e-18 | -7.92e-01 | -0.1088 |
| 10071 | MUC12 | HTA11_347_2000001011 | Human | Colorectum | AD | 7.08e-13 | 9.59e-01 | -0.1954 |
| 10071 | MUC12 | HTA11_411_2000001011 | Human | Colorectum | SER | 3.27e-23 | 2.30e+00 | -0.2602 |
| 10071 | MUC12 | HTA11_2112_2000001011 | Human | Colorectum | SER | 2.93e-23 | 2.14e+00 | -0.2196 |
| 10071 | MUC12 | HTA11_696_2000001011 | Human | Colorectum | AD | 1.02e-37 | 1.80e+00 | -0.1464 |
| 10071 | MUC12 | HTA11_2992_2000001011 | Human | Colorectum | SER | 8.10e-21 | 1.96e+00 | -0.1706 |
| 10071 | MUC12 | HTA11_5212_2000001011 | Human | Colorectum | AD | 1.82e-26 | 1.96e+00 | -0.2061 |
| 10071 | MUC12 | HTA11_7862_2000001011 | Human | Colorectum | AD | 3.57e-02 | 5.51e-01 | -0.0179 |
| 10071 | MUC12 | HTA11_10711_2000001011 | Human | Colorectum | AD | 1.71e-10 | -6.83e-01 | 0.0338 |
| 10071 | MUC12 | HTA11_6818_2000001021 | Human | Colorectum | AD | 1.10e-02 | -4.63e-01 | 0.0588 |
| 10071 | MUC12 | HTA11_99999970781_79442 | Human | Colorectum | MSS | 1.07e-24 | -8.09e-01 | 0.294 |
| 10071 | MUC12 | HTA11_99999971662_82457 | Human | Colorectum | MSS | 1.55e-26 | -8.24e-01 | 0.3859 |
| 10071 | MUC12 | HTA11_99999973899_84307 | Human | Colorectum | MSS | 2.29e-03 | 7.64e-01 | 0.2585 |
| 10071 | MUC12 | HTA11_99999974143_84620 | Human | Colorectum | MSS | 4.11e-26 | -8.26e-01 | 0.3005 |
| 10071 | MUC12 | F007 | Human | Colorectum | FAP | 3.54e-08 | -5.49e-01 | 0.1176 |
| 10071 | MUC12 | A002-C-010 | Human | Colorectum | FAP | 4.25e-08 | -4.63e-01 | 0.242 |
| 10071 | MUC12 | A001-C-207 | Human | Colorectum | FAP | 4.52e-17 | -6.17e-01 | 0.1278 |
| 10071 | MUC12 | A015-C-203 | Human | Colorectum | FAP | 2.87e-26 | -4.64e-01 | -0.1294 |
| Page: 1 2 3 4 5 |
| Tissue | Expression Dynamics | Abbreviation |
| Colorectum (GSE201348) |  | FAP: Familial adenomatous polyposis |
| CRC: Colorectal cancer | ||
| Colorectum (HTA11) |  | AD: Adenomas |
| SER: Sessile serrated lesions | ||
| MSI-H: Microsatellite-high colorectal cancer | ||
| MSS: Microsatellite stable colorectal cancer | ||
| Esophagus | 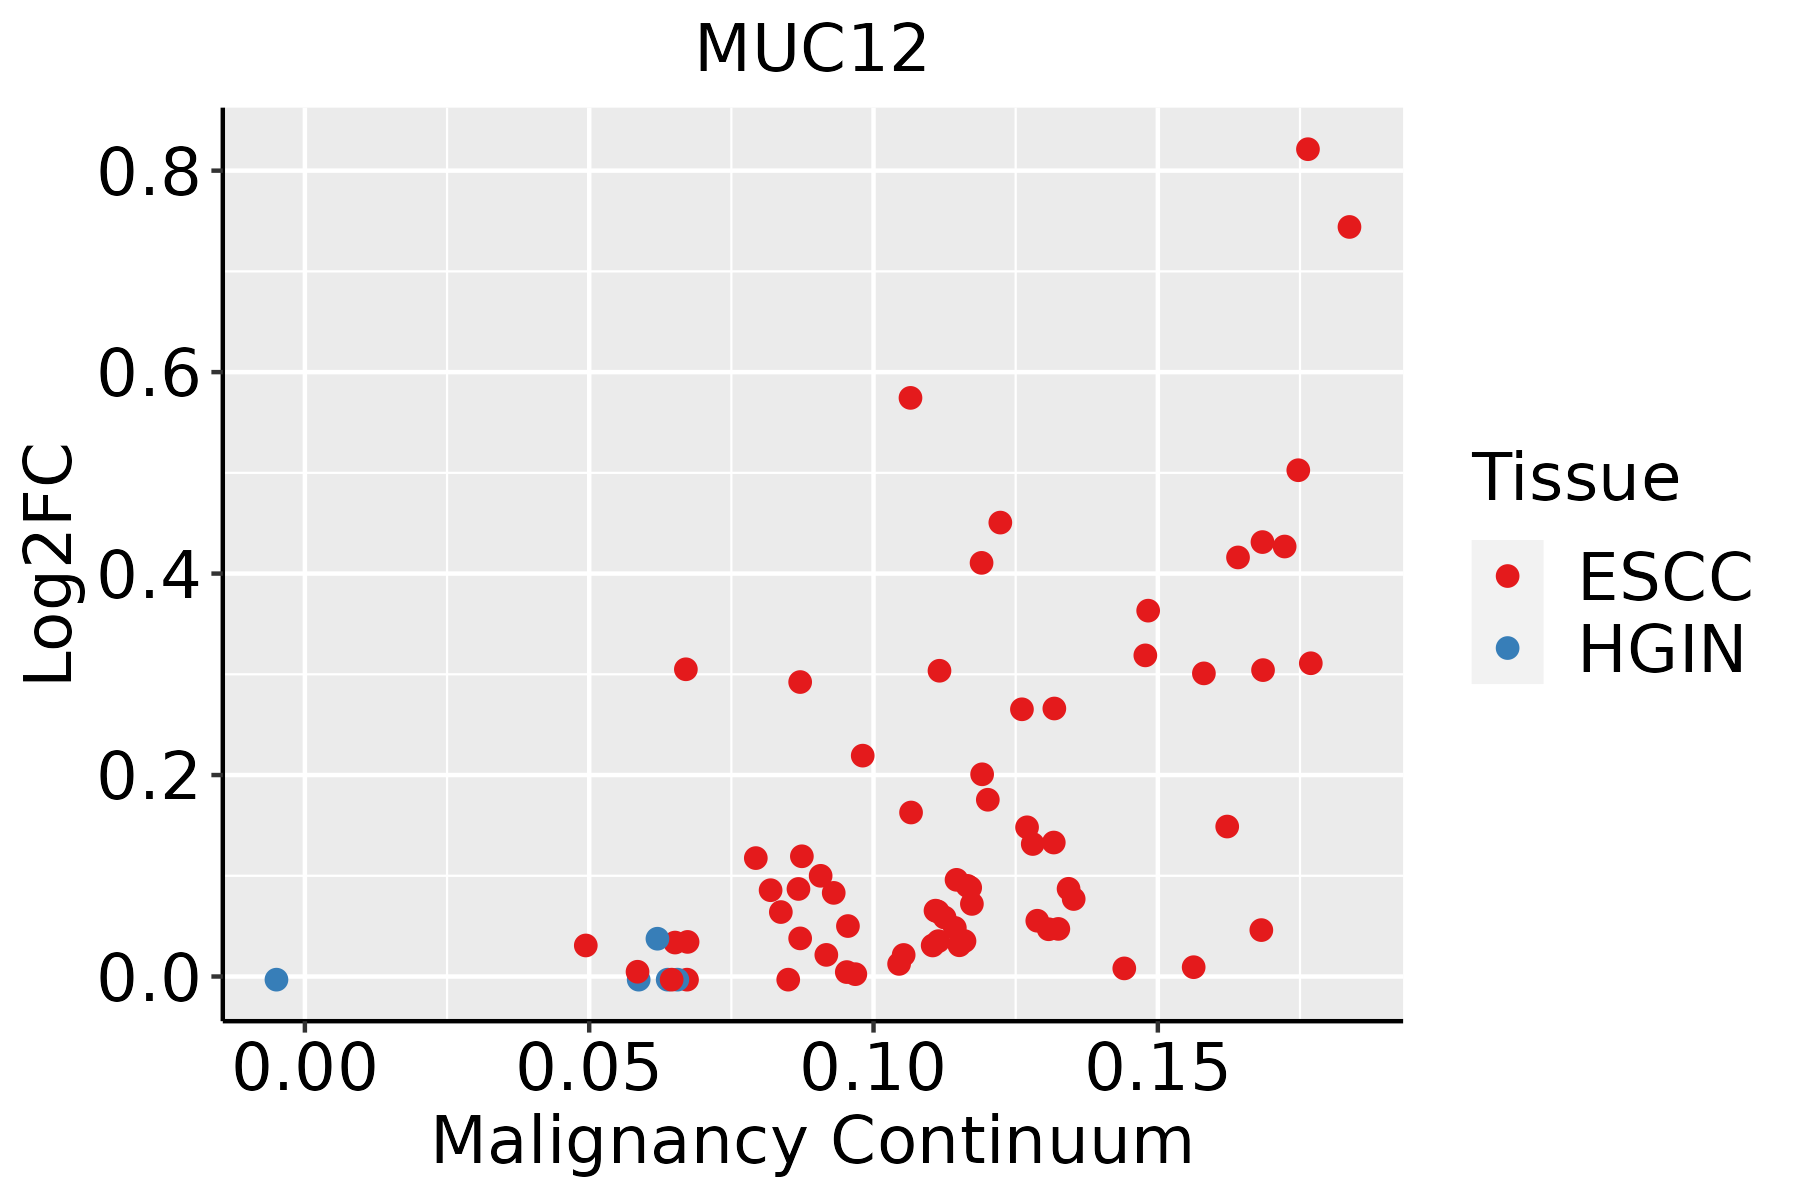 | ESCC: Esophageal squamous cell carcinoma |
| HGIN: High-grade intraepithelial neoplasias | ||
| LGIN: Low-grade intraepithelial neoplasias | ||
| Liver | 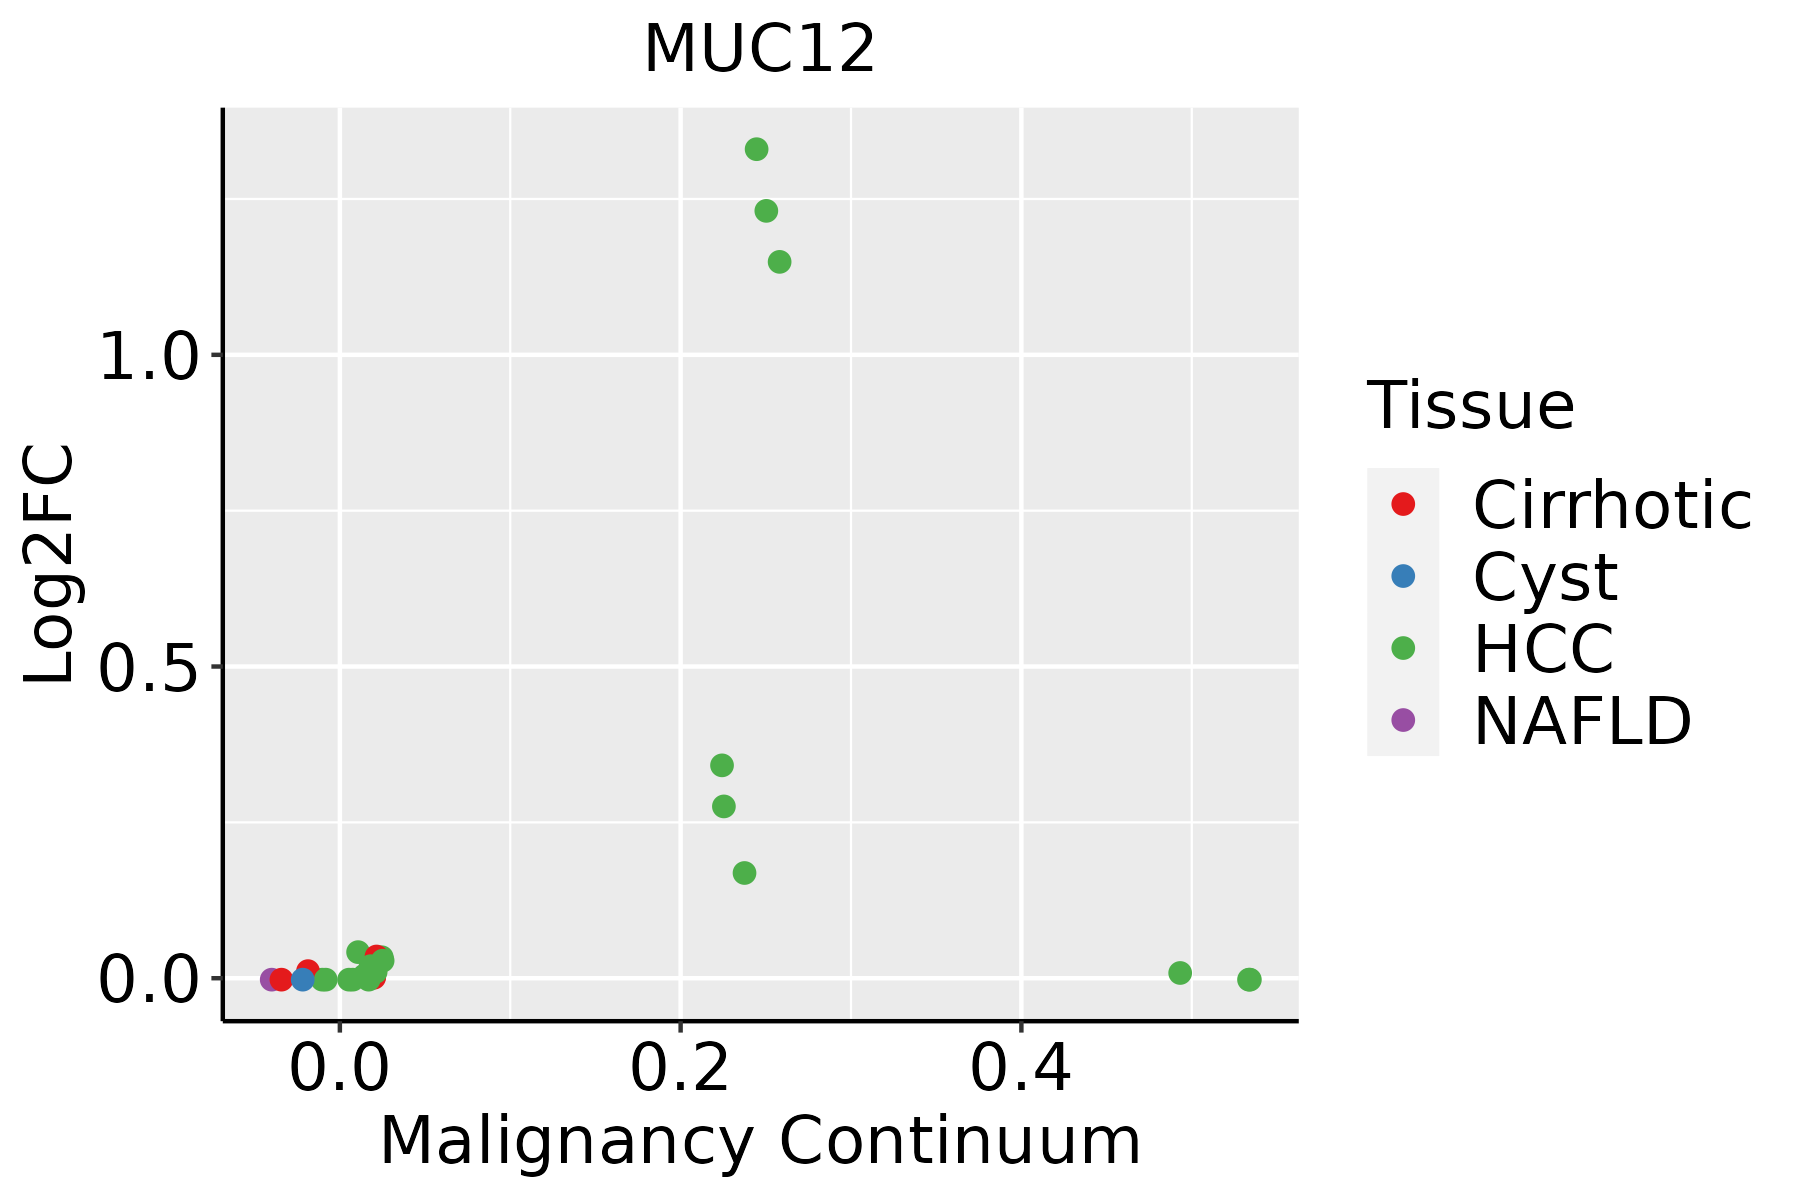 | HCC: Hepatocellular carcinoma |
| NAFLD: Non-alcoholic fatty liver disease | ||
| Oral Cavity |  | EOLP: Erosive Oral lichen planus |
| LP: leukoplakia | ||
| NEOLP: Non-erosive oral lichen planus | ||
| OSCC: Oral squamous cell carcinoma |
| ∗log2FC in expression of this searched gene in stem-like cells from each diseased tissue sample relative to stem-like cells in normal samples in each tissue plotted against the malignancy continuum. Samples are colored based on if they are from different disease stage. |
Top |
Malignant transformation related pathway analysis |
| Find out the enriched GO biological processes and KEGG pathways involved in transition from healthy to precancer to cancer |
| Tissue | Disease Stage | Enriched GO biological Processes |
| Breast | Precancer |  |
| Breast | IDC |  |
| Breast | DCIS |  |
| Cervix | CC |  |
| Cervix | HSIL_HPV |  |
| ∗Top 15 enriched GO BP terms are showed in the bar plot of each disease state in each tissue. Each row represents a significant GO biological process which is colored according to the -log10(p.adjust). |
| Page: 1 2 3 4 5 6 7 8 9 |
| GO ID | Tissue | Disease Stage | Description | Gene Ratio | Bg Ratio | pvalue | p.adjust | Count |
| GO:0016049 | Colorectum | AD | cell growth | 143/3918 | 482/18723 | 2.83e-06 | 8.09e-05 | 143 |
| GO:0001558 | Colorectum | AD | regulation of cell growth | 124/3918 | 414/18723 | 7.67e-06 | 1.86e-04 | 124 |
| GO:00015581 | Colorectum | SER | regulation of cell growth | 90/2897 | 414/18723 | 4.00e-04 | 6.02e-03 | 90 |
| GO:00160491 | Colorectum | SER | cell growth | 100/2897 | 482/18723 | 1.07e-03 | 1.24e-02 | 100 |
| GO:00160492 | Colorectum | MSS | cell growth | 123/3467 | 482/18723 | 7.15e-05 | 1.21e-03 | 123 |
| GO:00015582 | Colorectum | MSS | regulation of cell growth | 105/3467 | 414/18723 | 2.97e-04 | 3.90e-03 | 105 |
| GO:00160493 | Colorectum | FAP | cell growth | 112/2622 | 482/18723 | 2.40e-08 | 2.30e-06 | 112 |
| GO:00015583 | Colorectum | FAP | regulation of cell growth | 95/2622 | 414/18723 | 5.02e-07 | 2.61e-05 | 95 |
| GO:00160494 | Colorectum | CRC | cell growth | 95/2078 | 482/18723 | 1.51e-08 | 2.75e-06 | 95 |
| GO:00015584 | Colorectum | CRC | regulation of cell growth | 78/2078 | 414/18723 | 1.84e-06 | 9.11e-05 | 78 |
| GO:0016049110 | Esophagus | ESCC | cell growth | 289/8552 | 482/18723 | 1.29e-10 | 3.77e-09 | 289 |
| GO:000155819 | Esophagus | ESCC | regulation of cell growth | 248/8552 | 414/18723 | 2.97e-09 | 6.45e-08 | 248 |
| GO:001604921 | Liver | HCC | cell growth | 269/7958 | 482/18723 | 1.84e-09 | 5.35e-08 | 269 |
| GO:000155821 | Liver | HCC | regulation of cell growth | 228/7958 | 414/18723 | 1.34e-07 | 2.55e-06 | 228 |
| GO:001604917 | Oral cavity | OSCC | cell growth | 268/7305 | 482/18723 | 6.55e-14 | 3.51e-12 | 268 |
| GO:000155816 | Oral cavity | OSCC | regulation of cell growth | 228/7305 | 414/18723 | 1.74e-11 | 6.09e-10 | 228 |
| GO:001604918 | Oral cavity | LP | cell growth | 155/4623 | 482/18723 | 1.08e-04 | 1.31e-03 | 155 |
| GO:000155817 | Oral cavity | LP | regulation of cell growth | 134/4623 | 414/18723 | 2.25e-04 | 2.41e-03 | 134 |
| Page: 1 |
| Pathway ID | Tissue | Disease Stage | Description | Gene Ratio | Bg Ratio | pvalue | p.adjust | qvalue | Count |
| Page: 1 |
Top |
Cell-cell communication analysis |
| Identification of potential cell-cell interactions between two cell types and their ligand-receptor pairs for different disease states |
| Ligand | Receptor | LRpair | Pathway | Tissue | Disease Stage |
| Page: 1 |
Top |
Single-cell gene regulatory network inference analysis |
| Find out the significant the regulons (TFs) and the target genes of each regulon across cell types for different disease states |
| TF | Cell Type | Tissue | Disease Stage | Target Gene | RSS | Regulon Activity |
| ∗The dot plots of a searched regulon are shown for all cell subpopulations in each disease state of each tissue based on the regulon specific score inferred using pySCENIC and by calculating the average expression. |
| Page: 1 |
Top |
Somatic mutation of malignant transformation related genes |
| Annotation of somatic variants for genes involved in malignant transformation |
| Hugo Symbol | Variant Class | Variant Classification | dbSNP RS | HGVSc | HGVSp | HGVSp Short | SWISSPROT | BIOTYPE | SIFT | PolyPhen | Tumor Sample Barcode | Tissue | Histology | Sex | Age | Stage | Therapy Types | Drugs | Outcome |
| MUC12 | SNV | Missense_Mutation | novel | c.3673N>G | p.Gln1225Glu | p.Q1225E | Q9UKN1 | protein_coding | tolerated(0.24) | unknown(0) | TCGA-5L-AAT1-01 | Breast | breast invasive carcinoma | Female | <65 | III/IV | Hormone Therapy | letrozol | SD |
| MUC12 | SNV | Missense_Mutation | novel | c.11960N>T | p.Ser3987Leu | p.S3987L | Q9UKN1 | protein_coding | deleterious(0.04) | benign(0.195) | TCGA-5L-AAT1-01 | Breast | breast invasive carcinoma | Female | <65 | III/IV | Hormone Therapy | letrozol | SD |
| MUC12 | SNV | Missense_Mutation | c.1741N>T | p.His581Tyr | p.H581Y | Q9UKN1 | protein_coding | tolerated(0.41) | benign(0.26) | TCGA-A2-A04P-01 | Breast | breast invasive carcinoma | Female | <65 | III/IV | Chemotherapy | taxol | PD | |
| MUC12 | SNV | Missense_Mutation | novel | c.5447N>T | p.Ser1816Phe | p.S1816F | Q9UKN1 | protein_coding | deleterious(0.01) | possibly_damaging(0.742) | TCGA-A2-A0CW-01 | Breast | breast invasive carcinoma | Female | >=65 | I/II | Hormone Therapy | anastrozole | SD |
| MUC12 | SNV | Missense_Mutation | c.13946N>T | p.Ser4649Phe | p.S4649F | Q9UKN1 | protein_coding | deleterious(0) | benign(0.27) | TCGA-A2-A0CW-01 | Breast | breast invasive carcinoma | Female | >=65 | I/II | Hormone Therapy | anastrozole | SD | |
| MUC12 | SNV | Missense_Mutation | novel | c.9203C>T | p.Ser3068Phe | p.S3068F | Q9UKN1 | protein_coding | tolerated(0.08) | unknown(0) | TCGA-A2-A0EQ-01 | Breast | breast invasive carcinoma | Female | <65 | I/II | Chemotherapy | adriamycin | SD |
| MUC12 | SNV | Missense_Mutation | rs779617955 | c.8355N>C | p.Leu2785Phe | p.L2785F | Q9UKN1 | protein_coding | tolerated(0.06) | unknown(0) | TCGA-A2-A1G4-01 | Breast | breast invasive carcinoma | Female | >=65 | III/IV | Chemotherapy | adriamycin | SD |
| MUC12 | SNV | Missense_Mutation | c.1536N>T | p.Met512Ile | p.M512I | Q9UKN1 | protein_coding | deleterious(0.01) | benign(0.151) | TCGA-A2-A25A-01 | Breast | breast invasive carcinoma | Female | <65 | I/II | Unspecific | Cytoxan | SD | |
| MUC12 | SNV | Missense_Mutation | novel | c.6076N>T | p.Gly2026Cys | p.G2026C | Q9UKN1 | protein_coding | deleterious(0) | unknown(0) | TCGA-A2-A25A-01 | Breast | breast invasive carcinoma | Female | <65 | I/II | Unspecific | Cytoxan | SD |
| MUC12 | SNV | Missense_Mutation | novel | c.7498N>T | p.Gly2500Cys | p.G2500C | Q9UKN1 | protein_coding | deleterious(0) | unknown(0) | TCGA-A2-A25A-01 | Breast | breast invasive carcinoma | Female | <65 | I/II | Unspecific | Cytoxan | SD |
| Page: 1 2 3 4 5 6 7 8 9 10 11 12 13 14 15 16 17 18 19 20 21 22 23 24 25 26 27 28 29 30 31 |
Top |
Related drugs of malignant transformation related genes |
| Identification of chemicals and drugs interact with genes involved in malignant transfromation |
| (DGIdb 4.0) |
| Entrez ID | Symbol | Category | Interaction Types | Drug Claim Name | Drug Name | PMIDs |
| Page: 1 |

Copyright 2023-Present -The University of Texas Health Science Center at Houston |