
|
|||||
|
 | |
| |
| |
| |
| |
| |
|
Gene: MIR22HG |
Gene summary for MIR22HG |
| Gene information | Species | Human | Gene symbol | MIR22HG | Gene ID | 84981 |
| Gene name | MIR22 host gene | |
| Gene Alias | C17orf91 | |
| Cytomap | 17p13.3 | |
| Gene Type | ncRNA | GO ID | GO:0008150 | UniProtAcc | NA |
Top |
Malignant transformation analysis |
| Identification of the aberrant gene expression in precancerous and cancerous lesions by comparing the gene expression of stem-like cells in diseased tissues with normal stem cells |
| Entrez ID | Symbol | Replicates | Species | Organ | Tissue | Adj P-value | Log2FC | Malignancy |
| 84981 | MIR22HG | Tumor | Human | Cervix | CC | 9.00e-07 | 1.45e-01 | 0.1241 |
| 84981 | MIR22HG | sample1 | Human | Cervix | CC | 1.17e-02 | 1.66e-01 | 0.0959 |
| 84981 | MIR22HG | sample3 | Human | Cervix | CC | 1.95e-08 | 1.45e-01 | 0.1387 |
| 84981 | MIR22HG | H2 | Human | Cervix | HSIL_HPV | 1.81e-04 | 1.40e-01 | 0.0632 |
| 84981 | MIR22HG | T1 | Human | Cervix | CC | 2.31e-11 | 2.59e-01 | 0.0918 |
| 84981 | MIR22HG | T2 | Human | Cervix | CC | 1.32e-11 | 4.20e-01 | 0.0709 |
| 84981 | MIR22HG | T3 | Human | Cervix | CC | 4.13e-06 | 1.28e-01 | 0.1389 |
| 84981 | MIR22HG | LZE7T | Human | Esophagus | ESCC | 3.38e-04 | 3.57e-02 | 0.0667 |
| 84981 | MIR22HG | LZE8T | Human | Esophagus | ESCC | 3.91e-03 | 2.39e-01 | 0.067 |
| 84981 | MIR22HG | LZE24T | Human | Esophagus | ESCC | 3.50e-24 | 1.21e+00 | 0.0596 |
| 84981 | MIR22HG | P2T-E | Human | Esophagus | ESCC | 2.70e-13 | -1.41e-01 | 0.1177 |
| 84981 | MIR22HG | P4T-E | Human | Esophagus | ESCC | 4.33e-12 | -2.18e-02 | 0.1323 |
| 84981 | MIR22HG | P5T-E | Human | Esophagus | ESCC | 9.69e-14 | -2.30e-01 | 0.1327 |
| 84981 | MIR22HG | P8T-E | Human | Esophagus | ESCC | 3.42e-17 | 6.05e-01 | 0.0889 |
| 84981 | MIR22HG | P9T-E | Human | Esophagus | ESCC | 5.48e-08 | 1.10e-01 | 0.1131 |
| 84981 | MIR22HG | P10T-E | Human | Esophagus | ESCC | 2.62e-09 | -6.70e-02 | 0.116 |
| 84981 | MIR22HG | P11T-E | Human | Esophagus | ESCC | 6.28e-05 | 5.41e-01 | 0.1426 |
| 84981 | MIR22HG | P12T-E | Human | Esophagus | ESCC | 2.66e-05 | 1.60e-01 | 0.1122 |
| 84981 | MIR22HG | P16T-E | Human | Esophagus | ESCC | 2.44e-11 | -2.45e-01 | 0.1153 |
| 84981 | MIR22HG | P20T-E | Human | Esophagus | ESCC | 9.74e-06 | -1.00e-01 | 0.1124 |
| Page: 1 2 3 4 5 6 |
| Tissue | Expression Dynamics | Abbreviation |
| Cervix | 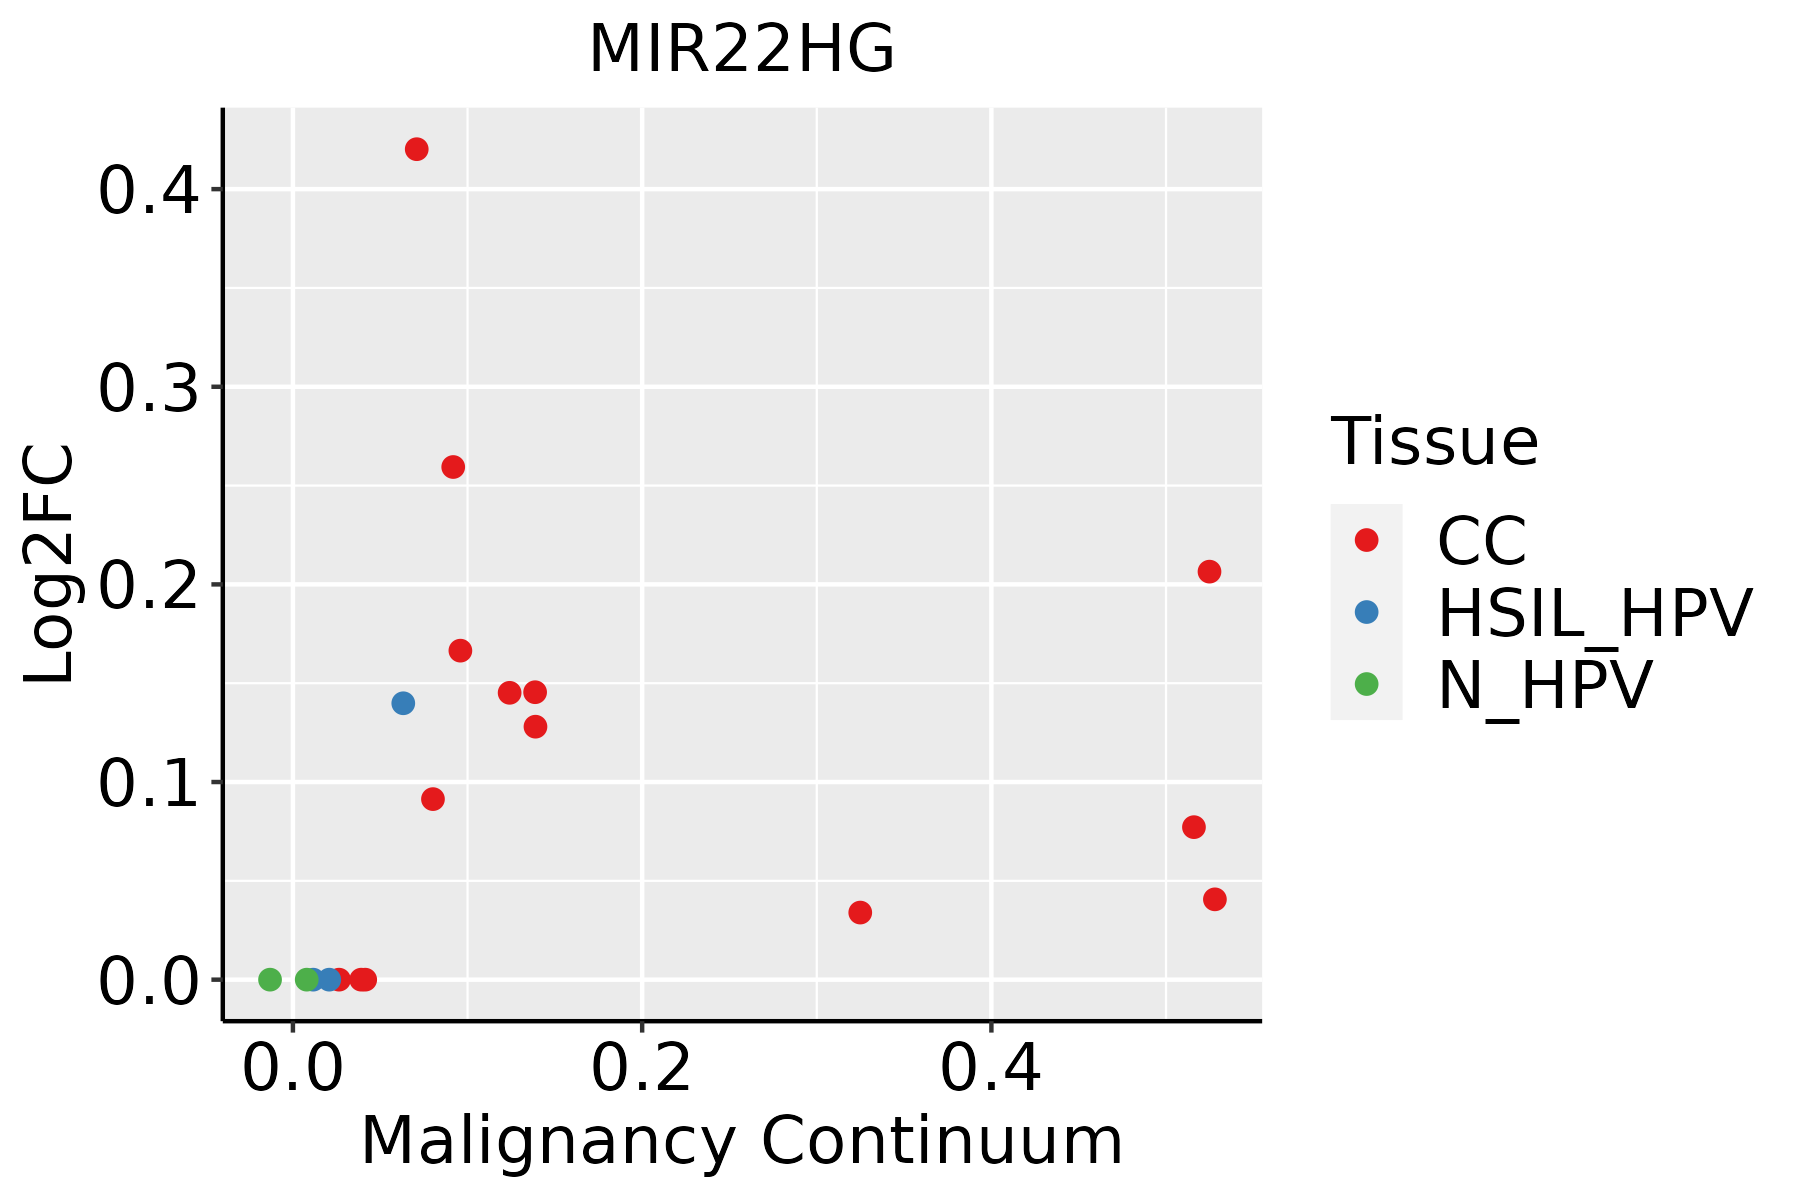 | CC: Cervix cancer |
| HSIL_HPV: HPV-infected high-grade squamous intraepithelial lesions | ||
| N_HPV: HPV-infected normal cervix | ||
| Esophagus | 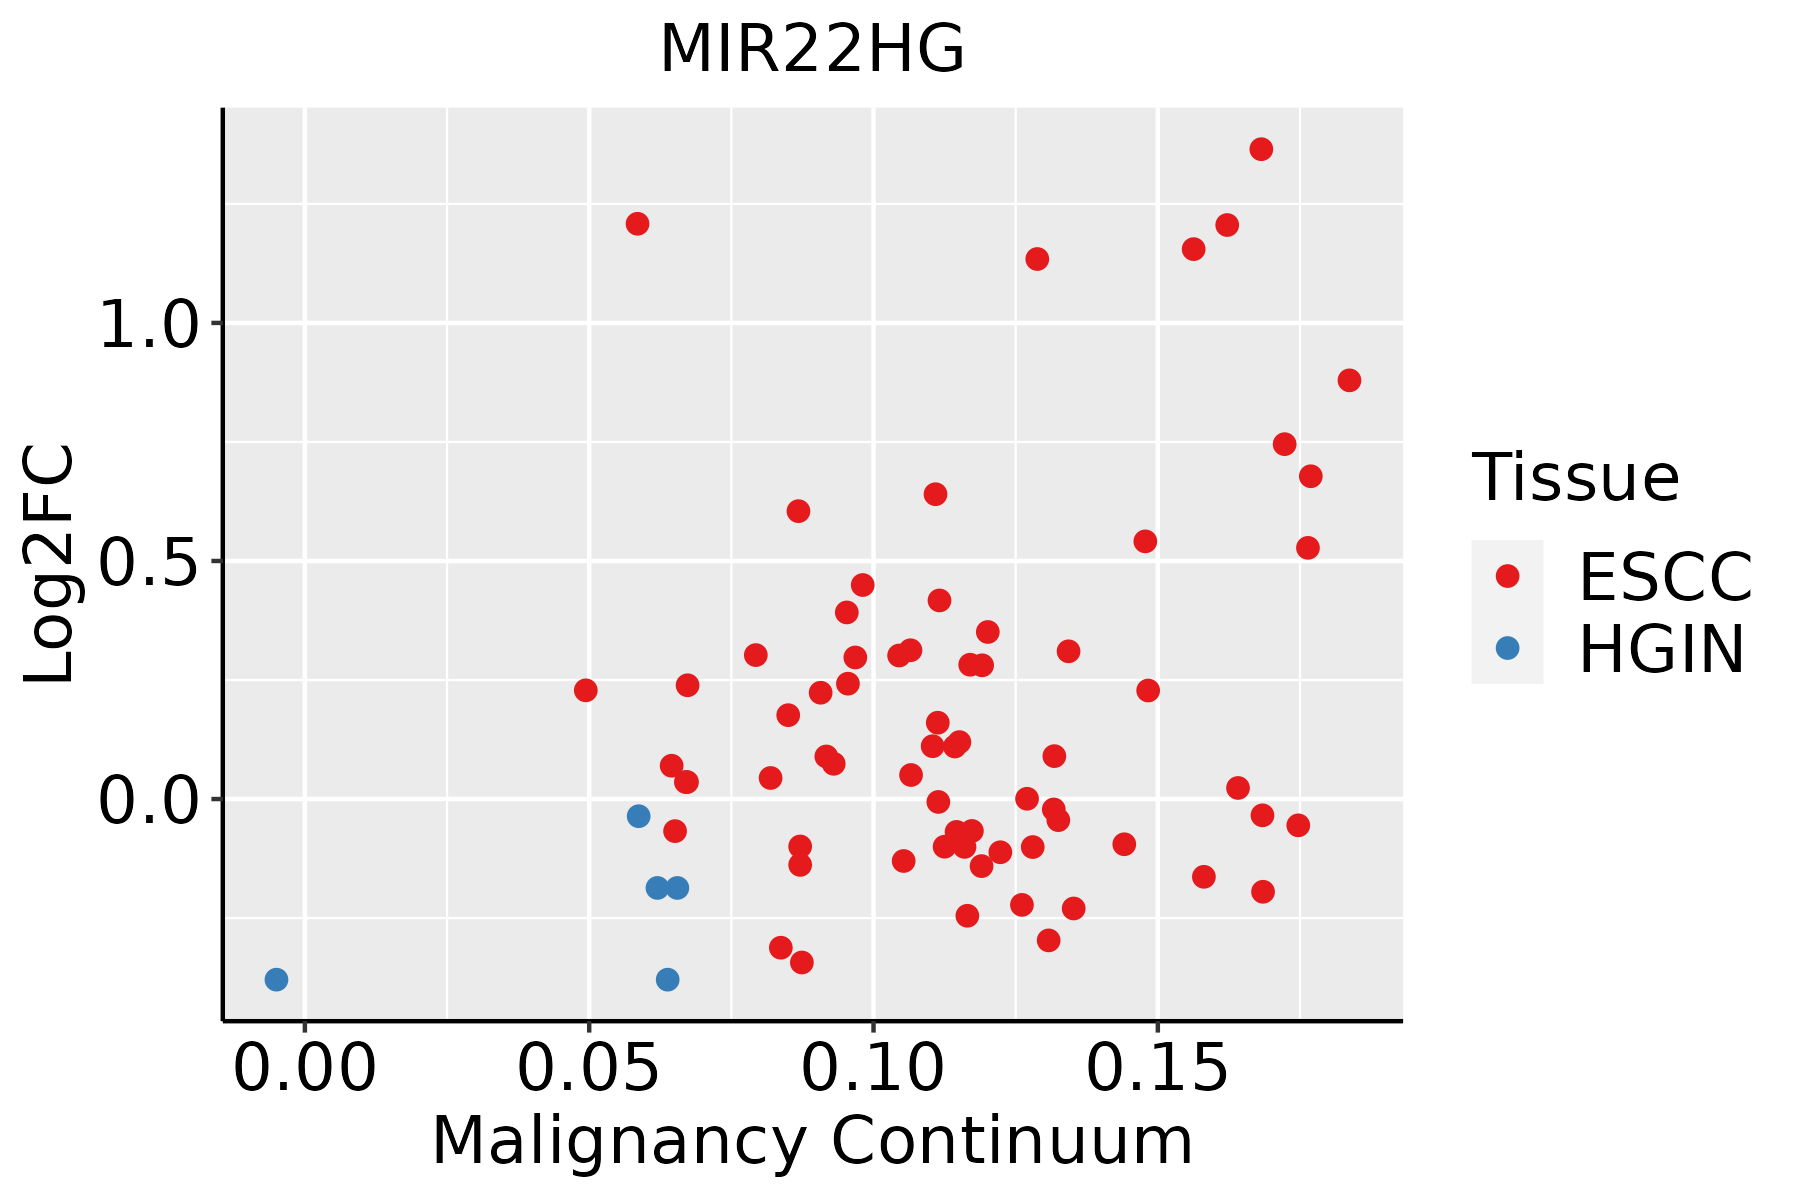 | ESCC: Esophageal squamous cell carcinoma |
| HGIN: High-grade intraepithelial neoplasias | ||
| LGIN: Low-grade intraepithelial neoplasias | ||
| GC | 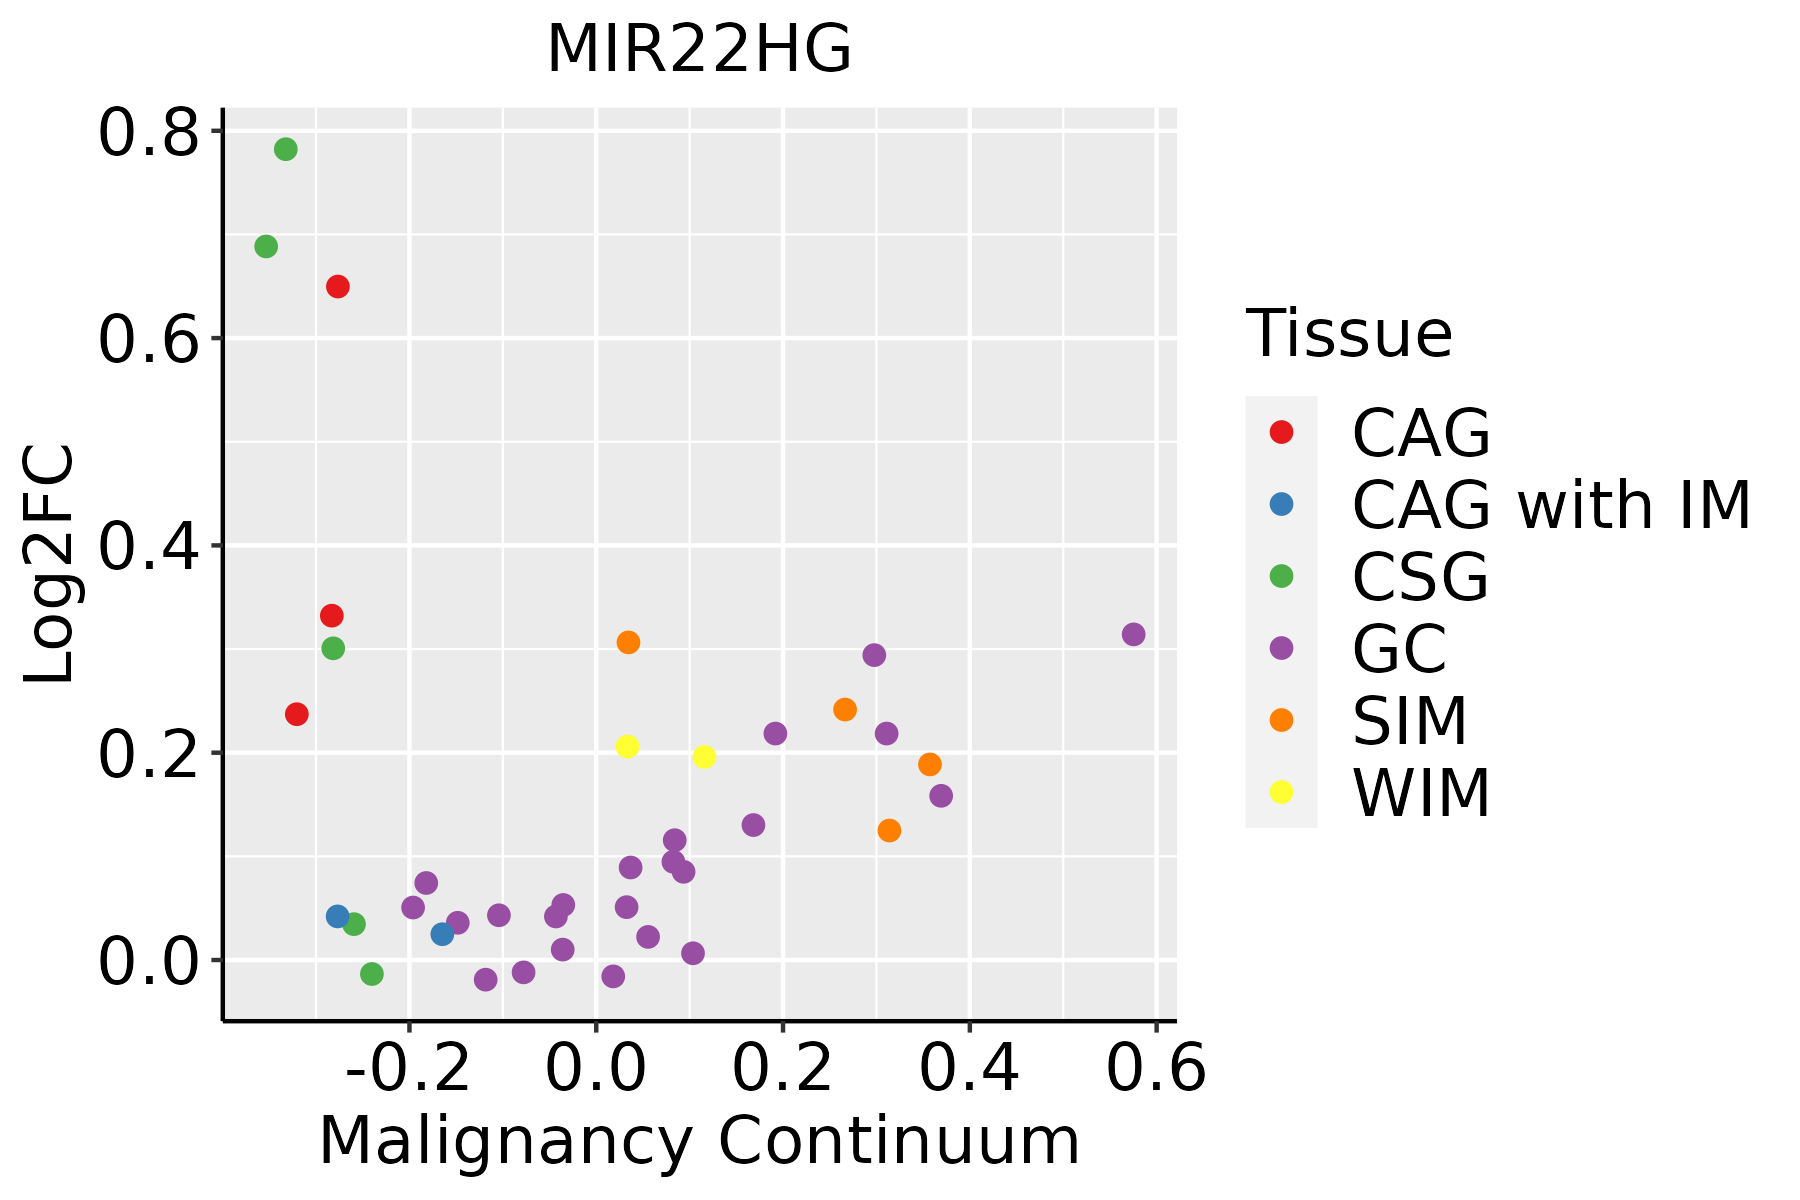 | CAG: Chronic atrophic gastritis |
| CAG with IM: Chronic atrophic gastritis with intestinal metaplasia | ||
| CSG: Chronic superficial gastritis | ||
| GC: Gastric cancer | ||
| SIM: Severe intestinal metaplasia | ||
| WIM: Wild intestinal metaplasia | ||
| Oral Cavity | 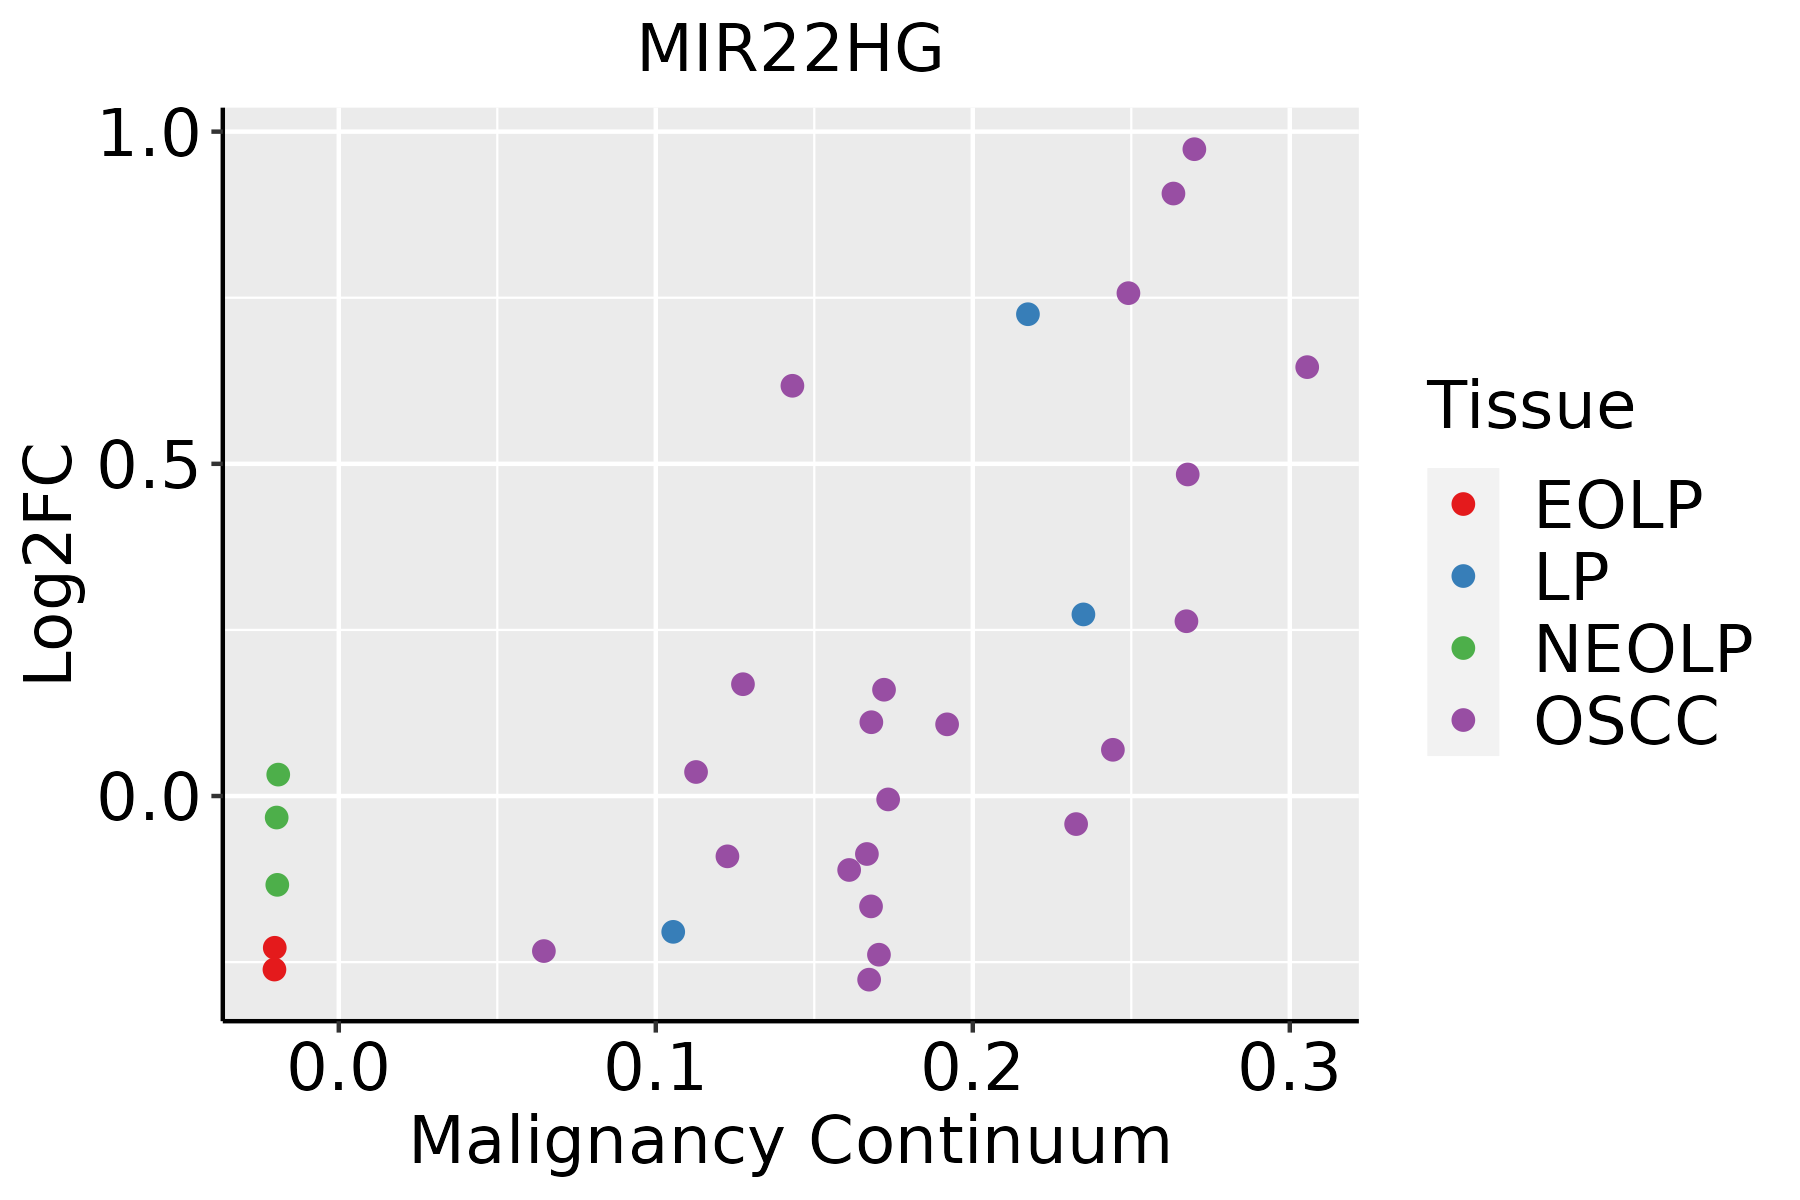 | EOLP: Erosive Oral lichen planus |
| LP: leukoplakia | ||
| NEOLP: Non-erosive oral lichen planus | ||
| OSCC: Oral squamous cell carcinoma | ||
| Prostate | 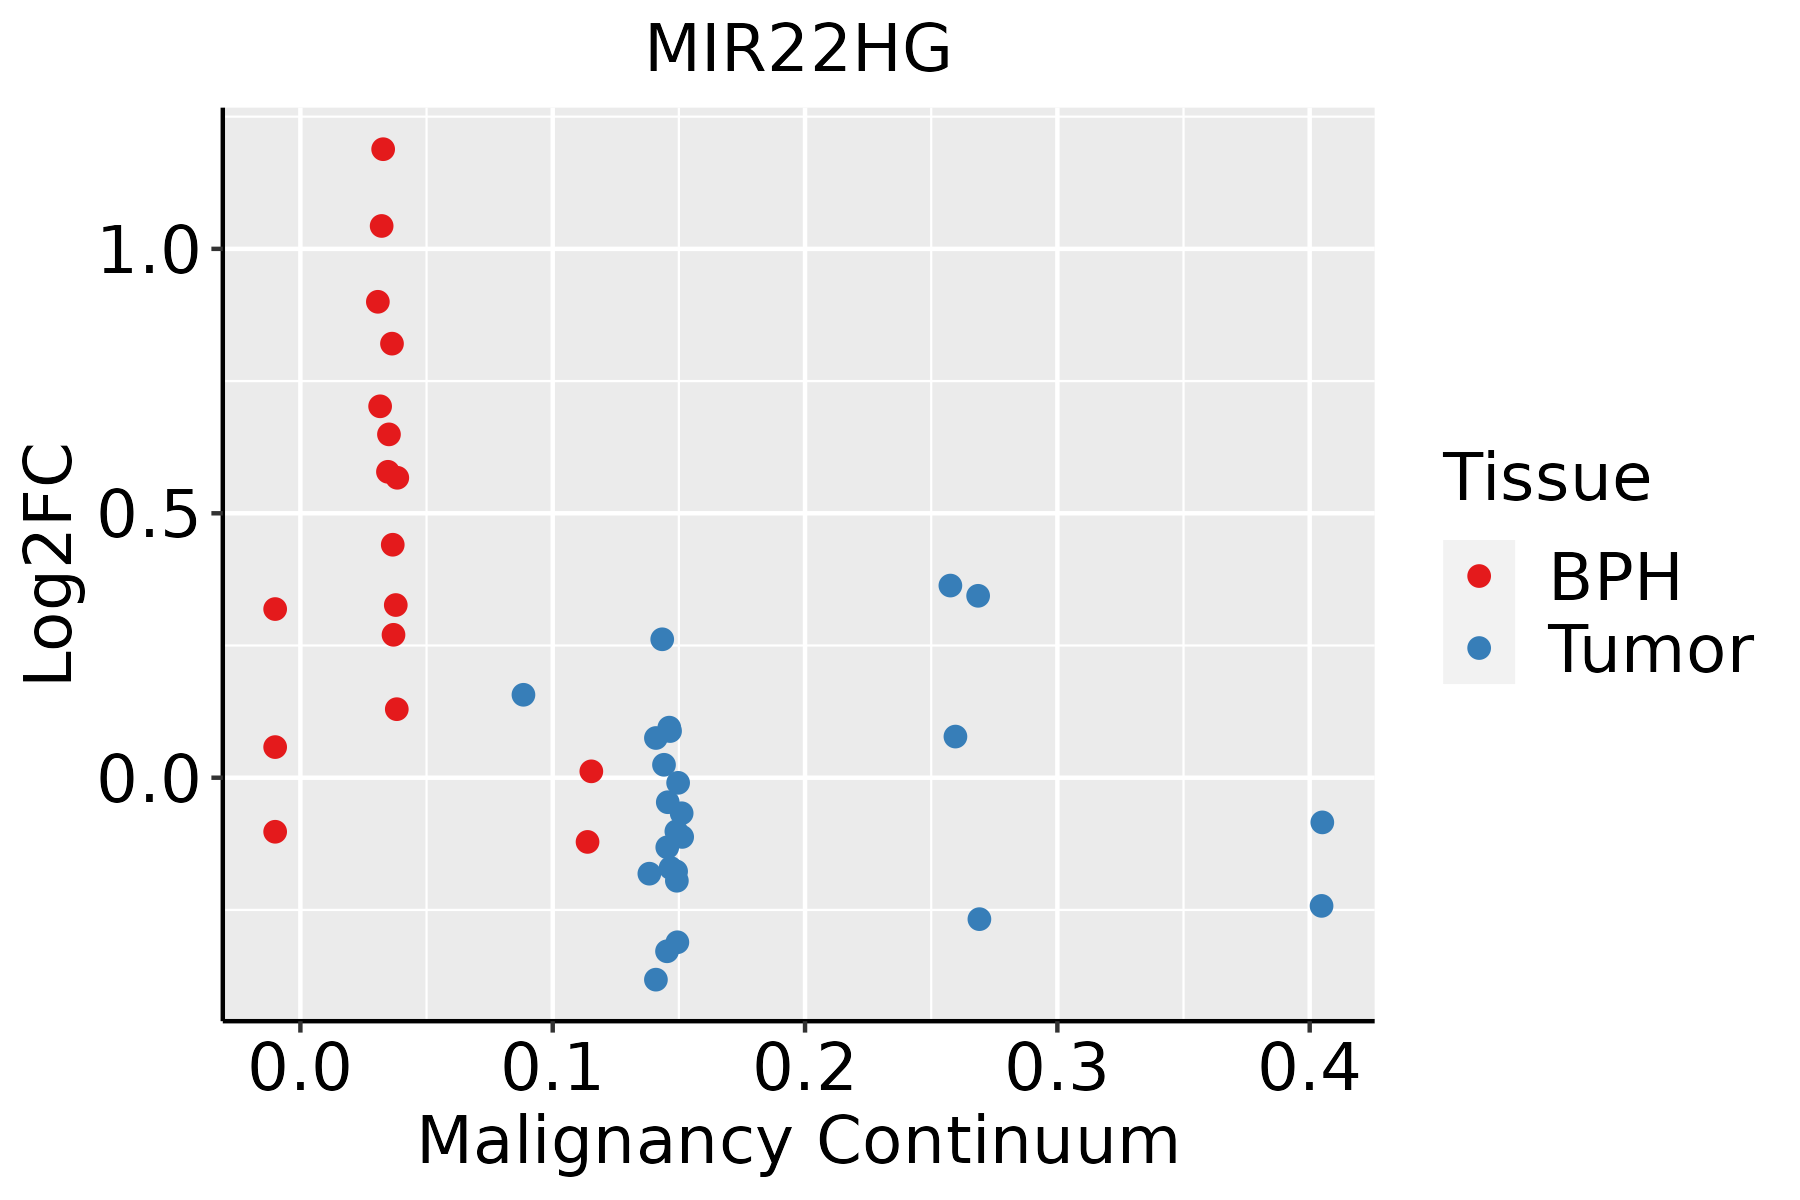 | BPH: Benign Prostatic Hyperplasia |
| Thyroid |  | ATC: Anaplastic thyroid cancer |
| HT: Hashimoto's thyroiditis | ||
| PTC: Papillary thyroid cancer |
| ∗log2FC in expression of this searched gene in stem-like cells from each diseased tissue sample relative to stem-like cells in normal samples in each tissue plotted against the malignancy continuum. Samples are colored based on if they are from different disease stage. |
Top |
Malignant transformation related pathway analysis |
| Find out the enriched GO biological processes and KEGG pathways involved in transition from healthy to precancer to cancer |
| Tissue | Disease Stage | Enriched GO biological Processes |
| Breast | Precancer |  |
| Breast | IDC |  |
| Breast | DCIS |  |
| Cervix | CC |  |
| Cervix | HSIL_HPV |  |
| ∗Top 15 enriched GO BP terms are showed in the bar plot of each disease state in each tissue. Each row represents a significant GO biological process which is colored according to the -log10(p.adjust). |
| Page: 1 2 3 4 5 6 7 8 9 |
| GO ID | Tissue | Disease Stage | Description | Gene Ratio | Bg Ratio | pvalue | p.adjust | Count |
| Page: 1 |
| Pathway ID | Tissue | Disease Stage | Description | Gene Ratio | Bg Ratio | pvalue | p.adjust | qvalue | Count |
| Page: 1 |
Top |
Cell-cell communication analysis |
| Identification of potential cell-cell interactions between two cell types and their ligand-receptor pairs for different disease states |
| Ligand | Receptor | LRpair | Pathway | Tissue | Disease Stage |
| Page: 1 |
Top |
Single-cell gene regulatory network inference analysis |
| Find out the significant the regulons (TFs) and the target genes of each regulon across cell types for different disease states |
| TF | Cell Type | Tissue | Disease Stage | Target Gene | RSS | Regulon Activity |
| ∗The dot plots of a searched regulon are shown for all cell subpopulations in each disease state of each tissue based on the regulon specific score inferred using pySCENIC and by calculating the average expression. |
| Page: 1 |
Top |
Somatic mutation of malignant transformation related genes |
| Annotation of somatic variants for genes involved in malignant transformation |
| Hugo Symbol | Variant Class | Variant Classification | dbSNP RS | HGVSc | HGVSp | HGVSp Short | SWISSPROT | BIOTYPE | SIFT | PolyPhen | Tumor Sample Barcode | Tissue | Histology | Sex | Age | Stage | Therapy Types | Drugs | Outcome |
| Page: 1 |
Top |
Related drugs of malignant transformation related genes |
| Identification of chemicals and drugs interact with genes involved in malignant transfromation |
| (DGIdb 4.0) |
| Entrez ID | Symbol | Category | Interaction Types | Drug Claim Name | Drug Name | PMIDs |
| Page: 1 |

Copyright 2023-Present -The University of Texas Health Science Center at Houston |