
|
|||||
|
 | |
| |
| |
| |
| |
| |
|
Gene: MEAK7 |
Gene summary for MEAK7 |
| Gene information | Species | Human | Gene symbol | MEAK7 | Gene ID | 57707 |
| Gene name | MTOR associated protein, eak-7 homolog | |
| Gene Alias | EAK7 | |
| Cytomap | 16q24.1 | |
| Gene Type | protein-coding | GO ID | GO:0001101 | UniProtAcc | A8K5C2 |
Top |
Malignant transformation analysis |
| Identification of the aberrant gene expression in precancerous and cancerous lesions by comparing the gene expression of stem-like cells in diseased tissues with normal stem cells |
| Entrez ID | Symbol | Replicates | Species | Organ | Tissue | Adj P-value | Log2FC | Malignancy |
| 57707 | MEAK7 | HTA11_2487_2000001011 | Human | Colorectum | SER | 8.42e-05 | 1.89e-01 | -0.1808 |
| 57707 | MEAK7 | HTA11_78_2000001011 | Human | Colorectum | AD | 6.11e-04 | 1.53e-01 | -0.1088 |
| 57707 | MEAK7 | HTA11_347_2000001011 | Human | Colorectum | AD | 7.64e-06 | 1.55e-01 | -0.1954 |
| 57707 | MEAK7 | HTA11_411_2000001011 | Human | Colorectum | SER | 2.78e-05 | 5.38e-01 | -0.2602 |
| 57707 | MEAK7 | HTA11_83_2000001011 | Human | Colorectum | SER | 8.73e-04 | 1.63e-01 | -0.1526 |
| 57707 | MEAK7 | HTA11_696_2000001011 | Human | Colorectum | AD | 9.36e-06 | 1.43e-01 | -0.1464 |
| 57707 | MEAK7 | HTA11_866_2000001011 | Human | Colorectum | AD | 8.62e-04 | 1.19e-01 | -0.1001 |
| 57707 | MEAK7 | HTA11_1391_2000001011 | Human | Colorectum | AD | 3.47e-06 | 1.82e-01 | -0.059 |
| 57707 | MEAK7 | HTA11_866_3004761011 | Human | Colorectum | AD | 2.51e-02 | 1.00e-01 | 0.096 |
| 57707 | MEAK7 | HTA11_7696_3000711011 | Human | Colorectum | AD | 1.82e-03 | 1.37e-01 | 0.0674 |
| Page: 1 |
| Tissue | Expression Dynamics | Abbreviation |
| Colorectum (GSE201348) | 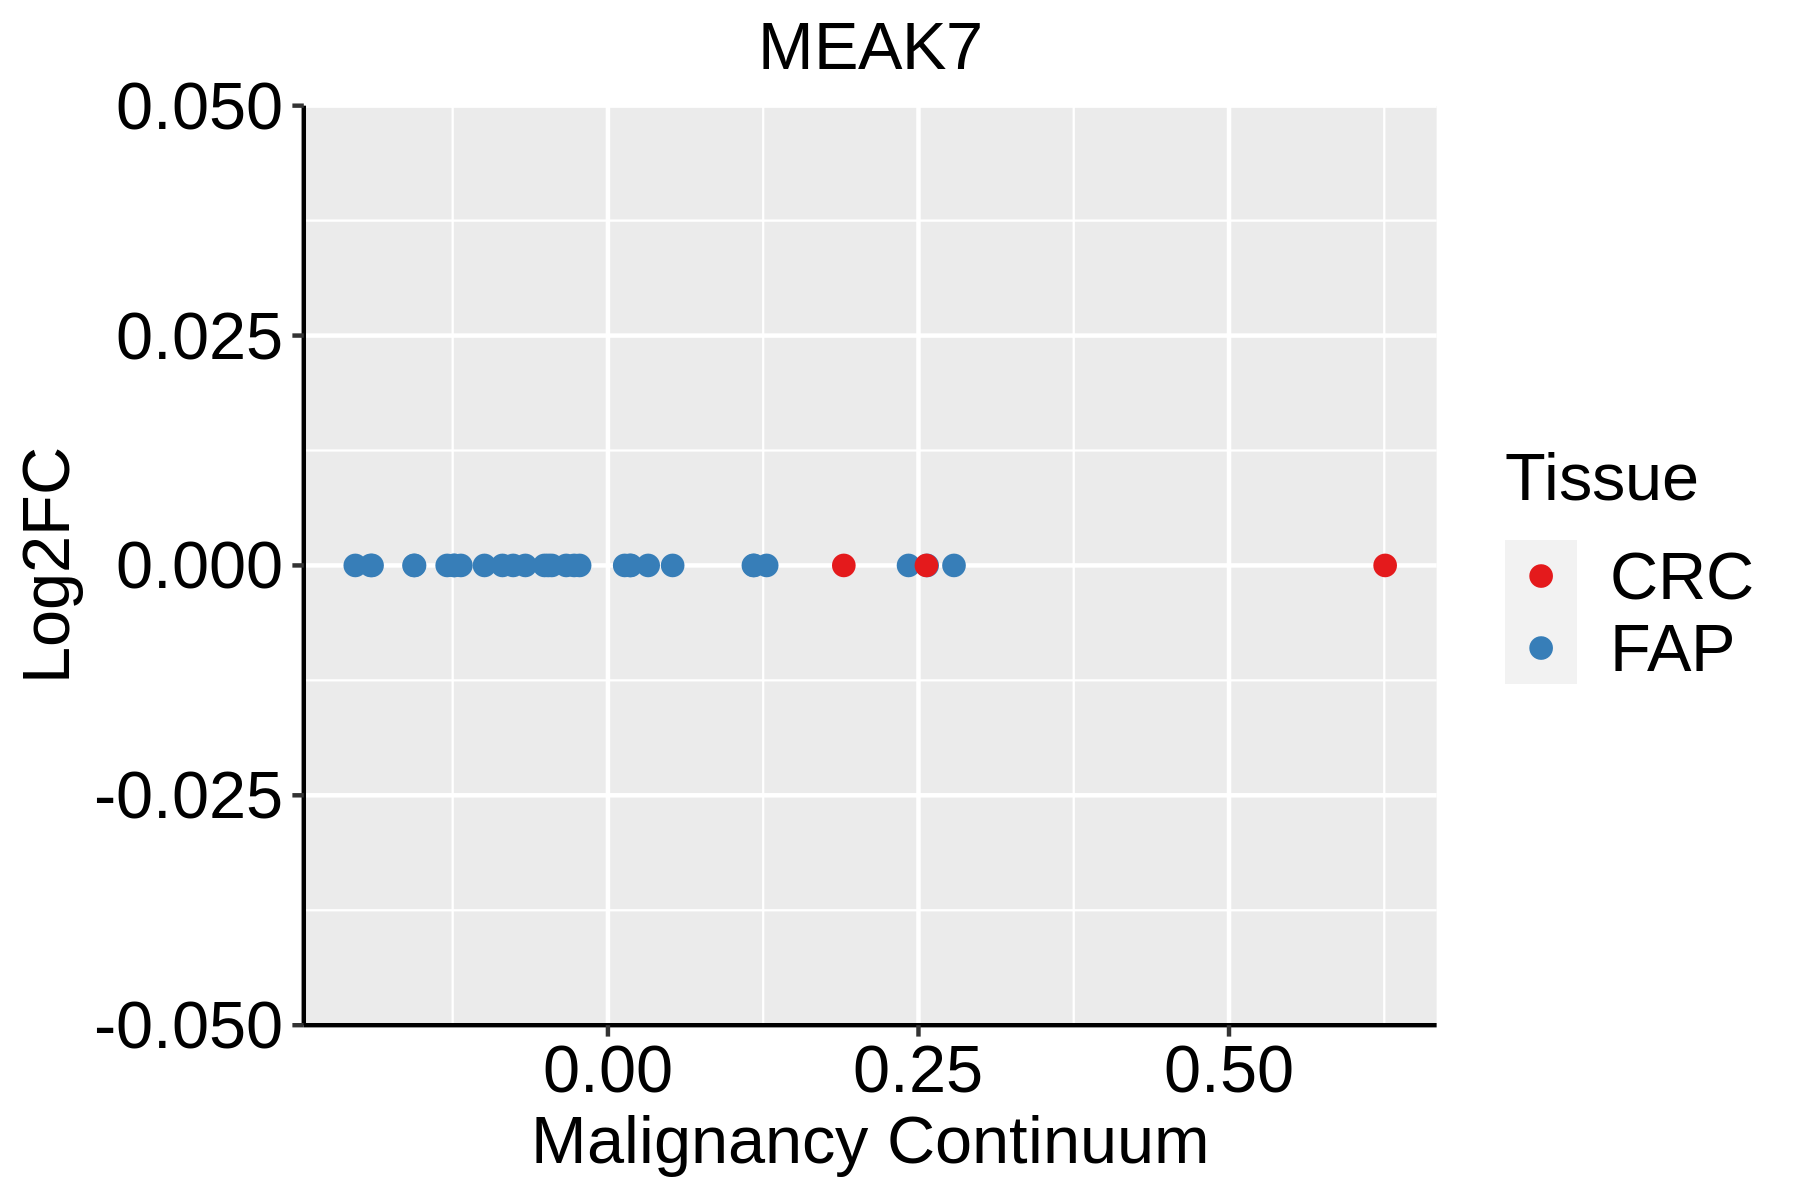 | FAP: Familial adenomatous polyposis |
| CRC: Colorectal cancer | ||
| Colorectum (HTA11) |  | AD: Adenomas |
| SER: Sessile serrated lesions | ||
| MSI-H: Microsatellite-high colorectal cancer | ||
| MSS: Microsatellite stable colorectal cancer |
| ∗log2FC in expression of this searched gene in stem-like cells from each diseased tissue sample relative to stem-like cells in normal samples in each tissue plotted against the malignancy continuum. Samples are colored based on if they are from different disease stage. |
Top |
Malignant transformation related pathway analysis |
| Find out the enriched GO biological processes and KEGG pathways involved in transition from healthy to precancer to cancer |
| Tissue | Disease Stage | Enriched GO biological Processes |
| Breast | Precancer |  |
| Breast | IDC |  |
| Breast | DCIS |  |
| Cervix | CC |  |
| Cervix | HSIL_HPV |  |
| ∗Top 15 enriched GO BP terms are showed in the bar plot of each disease state in each tissue. Each row represents a significant GO biological process which is colored according to the -log10(p.adjust). |
| Page: 1 2 3 4 5 6 7 8 9 |
| GO ID | Tissue | Disease Stage | Description | Gene Ratio | Bg Ratio | pvalue | p.adjust | Count |
| GO:1903829 | Colorectum | AD | positive regulation of cellular protein localization | 110/3918 | 276/18723 | 4.58e-13 | 8.44e-11 | 110 |
| GO:0006979 | Colorectum | AD | response to oxidative stress | 145/3918 | 446/18723 | 5.16e-09 | 3.23e-07 | 145 |
| GO:0032868 | Colorectum | AD | response to insulin | 91/3918 | 264/18723 | 2.02e-07 | 8.48e-06 | 91 |
| GO:0062197 | Colorectum | AD | cellular response to chemical stress | 109/3918 | 337/18723 | 5.33e-07 | 1.95e-05 | 109 |
| GO:0070997 | Colorectum | AD | neuron death | 114/3918 | 361/18723 | 1.13e-06 | 3.72e-05 | 114 |
| GO:0034599 | Colorectum | AD | cellular response to oxidative stress | 94/3918 | 288/18723 | 2.03e-06 | 6.02e-05 | 94 |
| GO:0043434 | Colorectum | AD | response to peptide hormone | 126/3918 | 414/18723 | 2.70e-06 | 7.86e-05 | 126 |
| GO:0031667 | Colorectum | AD | response to nutrient levels | 138/3918 | 474/18723 | 1.22e-05 | 2.68e-04 | 138 |
| GO:1901214 | Colorectum | AD | regulation of neuron death | 99/3918 | 319/18723 | 1.26e-05 | 2.76e-04 | 99 |
| GO:1901215 | Colorectum | AD | negative regulation of neuron death | 67/3918 | 208/18723 | 8.81e-05 | 1.35e-03 | 67 |
| GO:0072665 | Colorectum | AD | protein localization to vacuole | 27/3918 | 67/18723 | 2.40e-04 | 3.04e-03 | 27 |
| GO:0036473 | Colorectum | AD | cell death in response to oxidative stress | 35/3918 | 95/18723 | 2.58e-04 | 3.24e-03 | 35 |
| GO:1903203 | Colorectum | AD | regulation of oxidative stress-induced neuron death | 14/3918 | 27/18723 | 3.72e-04 | 4.29e-03 | 14 |
| GO:1903204 | Colorectum | AD | negative regulation of oxidative stress-induced neuron death | 11/3918 | 19/18723 | 4.66e-04 | 5.15e-03 | 11 |
| GO:0036475 | Colorectum | AD | neuron death in response to oxidative stress | 15/3918 | 31/18723 | 6.02e-04 | 6.33e-03 | 15 |
| GO:1903201 | Colorectum | AD | regulation of oxidative stress-induced cell death | 28/3918 | 74/18723 | 6.29e-04 | 6.52e-03 | 28 |
| GO:1902882 | Colorectum | AD | regulation of response to oxidative stress | 34/3918 | 98/18723 | 1.09e-03 | 1.01e-02 | 34 |
| GO:0061462 | Colorectum | AD | protein localization to lysosome | 19/3918 | 46/18723 | 1.36e-03 | 1.19e-02 | 19 |
| GO:1900407 | Colorectum | AD | regulation of cellular response to oxidative stress | 31/3918 | 89/18723 | 1.65e-03 | 1.38e-02 | 31 |
| GO:1903202 | Colorectum | AD | negative regulation of oxidative stress-induced cell death | 20/3918 | 53/18723 | 3.71e-03 | 2.62e-02 | 20 |
| Page: 1 2 |
| Pathway ID | Tissue | Disease Stage | Description | Gene Ratio | Bg Ratio | pvalue | p.adjust | qvalue | Count |
| Page: 1 |
Top |
Cell-cell communication analysis |
| Identification of potential cell-cell interactions between two cell types and their ligand-receptor pairs for different disease states |
| Ligand | Receptor | LRpair | Pathway | Tissue | Disease Stage |
| Page: 1 |
Top |
Single-cell gene regulatory network inference analysis |
| Find out the significant the regulons (TFs) and the target genes of each regulon across cell types for different disease states |
| TF | Cell Type | Tissue | Disease Stage | Target Gene | RSS | Regulon Activity |
| ∗The dot plots of a searched regulon are shown for all cell subpopulations in each disease state of each tissue based on the regulon specific score inferred using pySCENIC and by calculating the average expression. |
| Page: 1 |
Top |
Somatic mutation of malignant transformation related genes |
| Annotation of somatic variants for genes involved in malignant transformation |
| Hugo Symbol | Variant Class | Variant Classification | dbSNP RS | HGVSc | HGVSp | HGVSp Short | SWISSPROT | BIOTYPE | SIFT | PolyPhen | Tumor Sample Barcode | Tissue | Histology | Sex | Age | Stage | Therapy Types | Drugs | Outcome |
| Page: 1 |
Top |
Related drugs of malignant transformation related genes |
| Identification of chemicals and drugs interact with genes involved in malignant transfromation |
| (DGIdb 4.0) |
| Entrez ID | Symbol | Category | Interaction Types | Drug Claim Name | Drug Name | PMIDs |
| Page: 1 |

Copyright 2023-Present -The University of Texas Health Science Center at Houston |