
|
|||||
|
 | |
| |
| |
| |
| |
| |
|
Gene: LINC02163 |
Gene summary for LINC02163 |
| Gene information | Species | Human | Gene symbol | LINC02163 | Gene ID | 107986389 |
| Gene name | long intergenic non-protein coding RNA 2163 | |
| Gene Alias | LINC02163 | |
| Cytomap | 5q21.2 | |
| Gene Type | ncRNA | GO ID | NA | UniProtAcc | NA |
Top |
Malignant transformation analysis |
| Identification of the aberrant gene expression in precancerous and cancerous lesions by comparing the gene expression of stem-like cells in diseased tissues with normal stem cells |
| Entrez ID | Symbol | Replicates | Species | Organ | Tissue | Adj P-value | Log2FC | Malignancy |
| 107986389 | LINC02163 | AEH-subject1 | Human | Endometrium | AEH | 4.06e-07 | 2.13e-01 | -0.3059 |
| 107986389 | LINC02163 | AEH-subject2 | Human | Endometrium | AEH | 3.05e-36 | 8.21e-01 | -0.2525 |
| 107986389 | LINC02163 | AEH-subject3 | Human | Endometrium | AEH | 7.64e-34 | 7.25e-01 | -0.2576 |
| 107986389 | LINC02163 | AEH-subject4 | Human | Endometrium | AEH | 1.32e-04 | 2.57e-01 | -0.2657 |
| 107986389 | LINC02163 | AEH-subject5 | Human | Endometrium | AEH | 9.46e-93 | 1.47e+00 | -0.2953 |
| 107986389 | LINC02163 | EEC-subject2 | Human | Endometrium | EEC | 2.07e-72 | 1.12e+00 | -0.2607 |
| 107986389 | LINC02163 | EEC-subject3 | Human | Endometrium | EEC | 5.97e-26 | 7.76e-01 | -0.2525 |
| 107986389 | LINC02163 | EEC-subject4 | Human | Endometrium | EEC | 1.30e-14 | 4.68e-01 | -0.2571 |
| 107986389 | LINC02163 | EEC-subject5 | Human | Endometrium | EEC | 2.66e-23 | 5.86e-01 | -0.249 |
| 107986389 | LINC02163 | RNA-P17T-P17T-2 | Human | Lung | IAC | 6.80e-05 | 6.42e-01 | 0.3371 |
| 107986389 | LINC02163 | RNA-P17T-P17T-4 | Human | Lung | IAC | 1.48e-03 | 6.76e-01 | 0.343 |
| 107986389 | LINC02163 | RNA-P17T-P17T-6 | Human | Lung | IAC | 1.46e-13 | 1.15e+00 | 0.3385 |
| 107986389 | LINC02163 | RNA-P17T-P17T-8 | Human | Lung | IAC | 1.77e-07 | 8.11e-01 | 0.3329 |
| Page: 1 |
| Tissue | Expression Dynamics | Abbreviation |
| Endometrium | 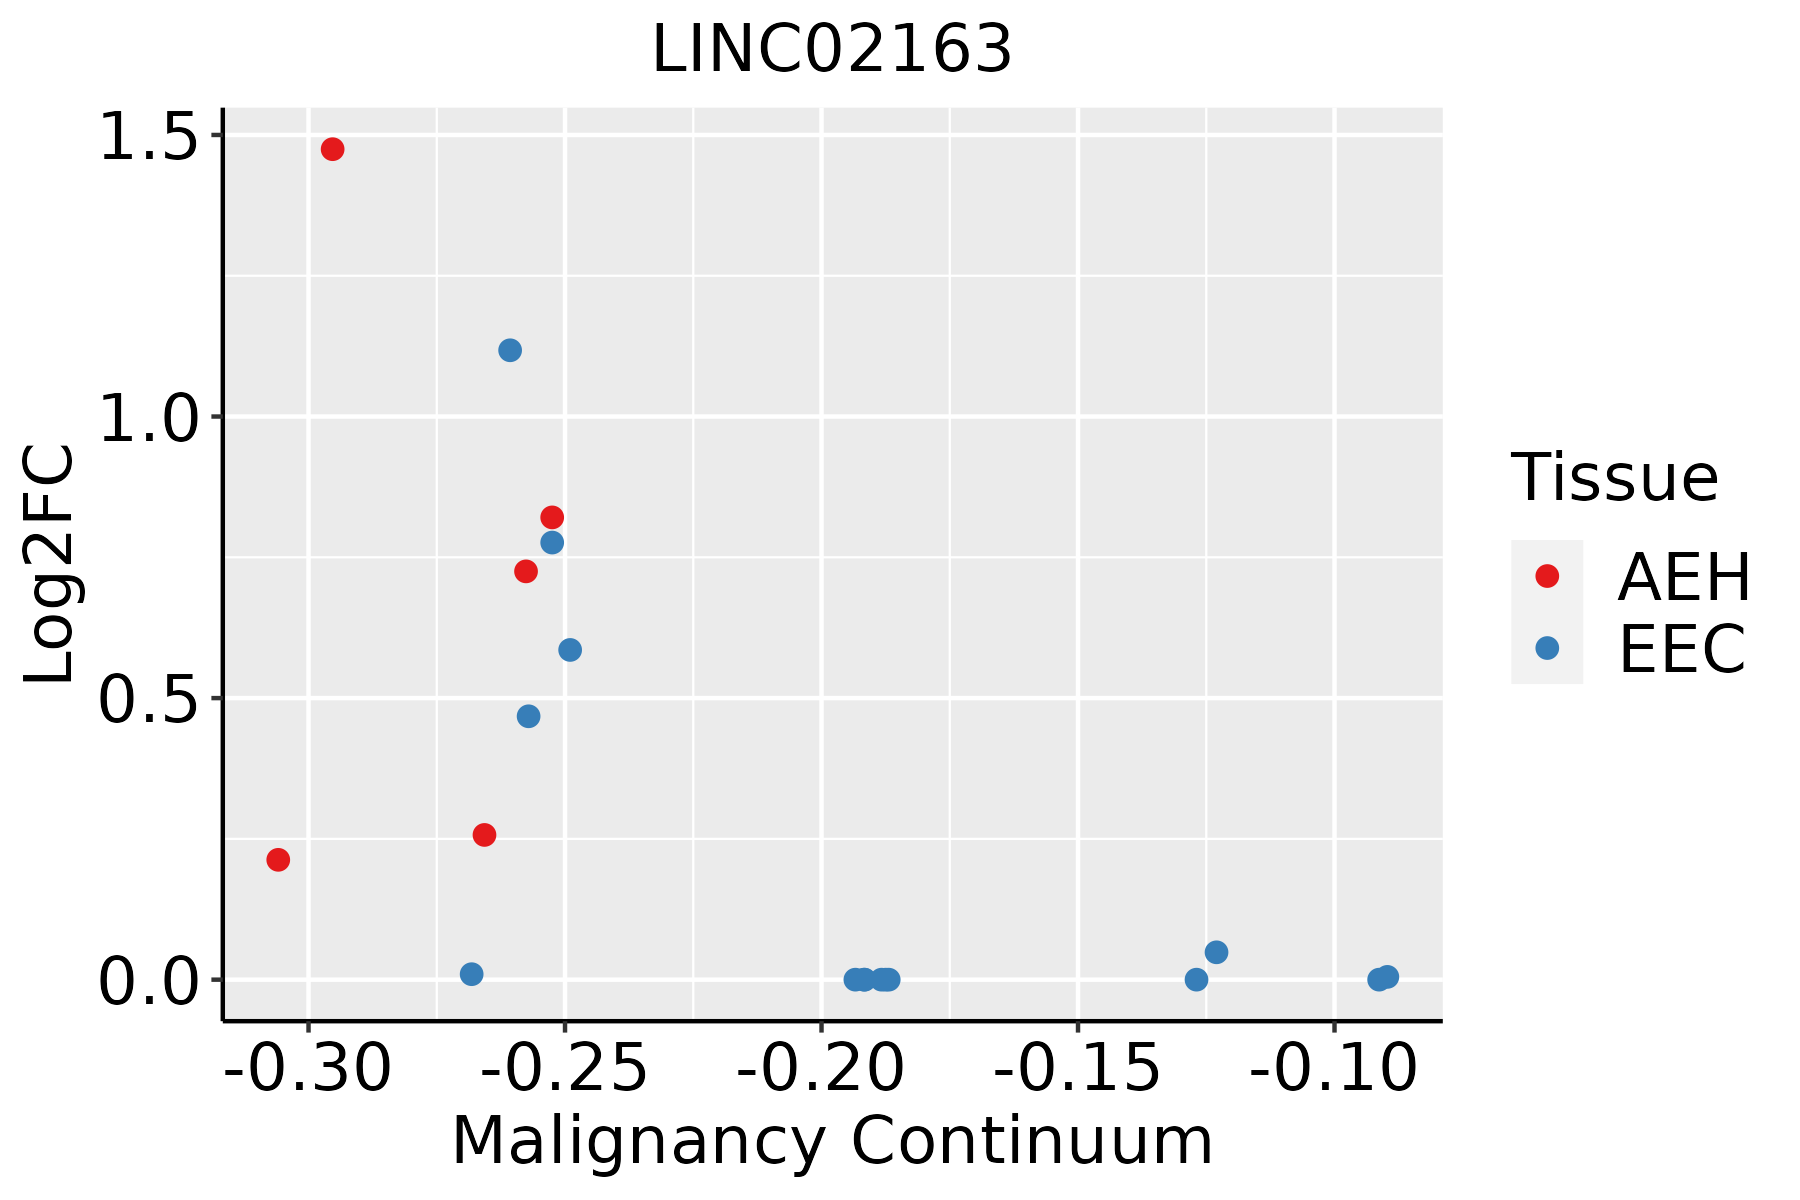 | AEH: Atypical endometrial hyperplasia |
| EEC: Endometrioid Cancer | ||
| Lung | 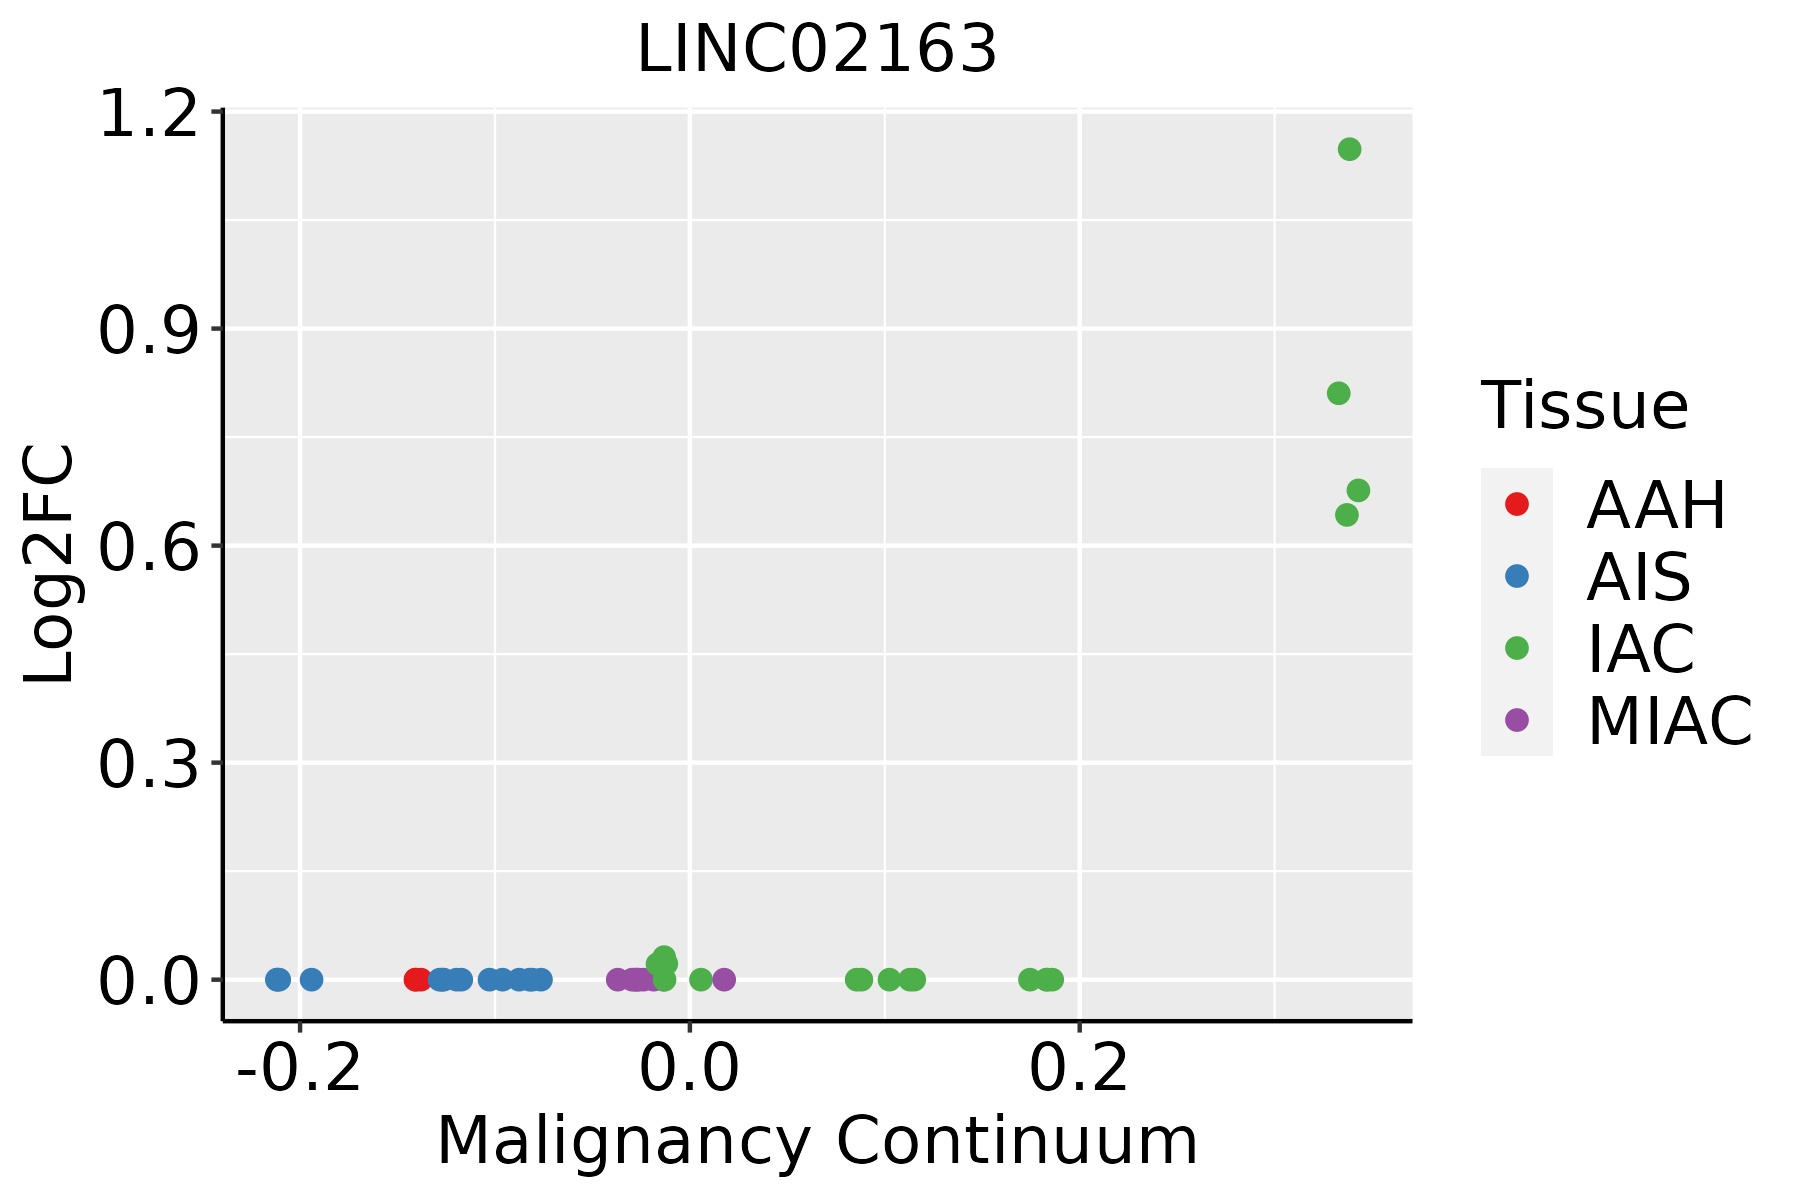 | AAH: Atypical adenomatous hyperplasia |
| AIS: Adenocarcinoma in situ | ||
| IAC: Invasive lung adenocarcinoma | ||
| MIA: Minimally invasive adenocarcinoma |
| ∗log2FC in expression of this searched gene in stem-like cells from each diseased tissue sample relative to stem-like cells in normal samples in each tissue plotted against the malignancy continuum. Samples are colored based on if they are from different disease stage. |
Top |
Malignant transformation related pathway analysis |
| Find out the enriched GO biological processes and KEGG pathways involved in transition from healthy to precancer to cancer |
| Tissue | Disease Stage | Enriched GO biological Processes |
| Breast | Precancer |  |
| Breast | IDC |  |
| Breast | DCIS |  |
| Cervix | CC |  |
| Cervix | HSIL_HPV |  |
| ∗Top 15 enriched GO BP terms are showed in the bar plot of each disease state in each tissue. Each row represents a significant GO biological process which is colored according to the -log10(p.adjust). |
| Page: 1 2 3 4 5 6 7 8 9 |
| GO ID | Tissue | Disease Stage | Description | Gene Ratio | Bg Ratio | pvalue | p.adjust | Count |
| Page: 1 |
| Pathway ID | Tissue | Disease Stage | Description | Gene Ratio | Bg Ratio | pvalue | p.adjust | qvalue | Count |
| Page: 1 |
Top |
Cell-cell communication analysis |
| Identification of potential cell-cell interactions between two cell types and their ligand-receptor pairs for different disease states |
| Ligand | Receptor | LRpair | Pathway | Tissue | Disease Stage |
| Page: 1 |
Top |
Single-cell gene regulatory network inference analysis |
| Find out the significant the regulons (TFs) and the target genes of each regulon across cell types for different disease states |
| TF | Cell Type | Tissue | Disease Stage | Target Gene | RSS | Regulon Activity |
| ∗The dot plots of a searched regulon are shown for all cell subpopulations in each disease state of each tissue based on the regulon specific score inferred using pySCENIC and by calculating the average expression. |
| Page: 1 |
Top |
Somatic mutation of malignant transformation related genes |
| Annotation of somatic variants for genes involved in malignant transformation |
| Hugo Symbol | Variant Class | Variant Classification | dbSNP RS | HGVSc | HGVSp | HGVSp Short | SWISSPROT | BIOTYPE | SIFT | PolyPhen | Tumor Sample Barcode | Tissue | Histology | Sex | Age | Stage | Therapy Types | Drugs | Outcome |
| Page: 1 |
Top |
Related drugs of malignant transformation related genes |
| Identification of chemicals and drugs interact with genes involved in malignant transfromation |
| (DGIdb 4.0) |
| Entrez ID | Symbol | Category | Interaction Types | Drug Claim Name | Drug Name | PMIDs |
| Page: 1 |

Copyright 2023-Present -The University of Texas Health Science Center at Houston |