| Tissue | Expression Dynamics | Abbreviation |
| Esophagus | 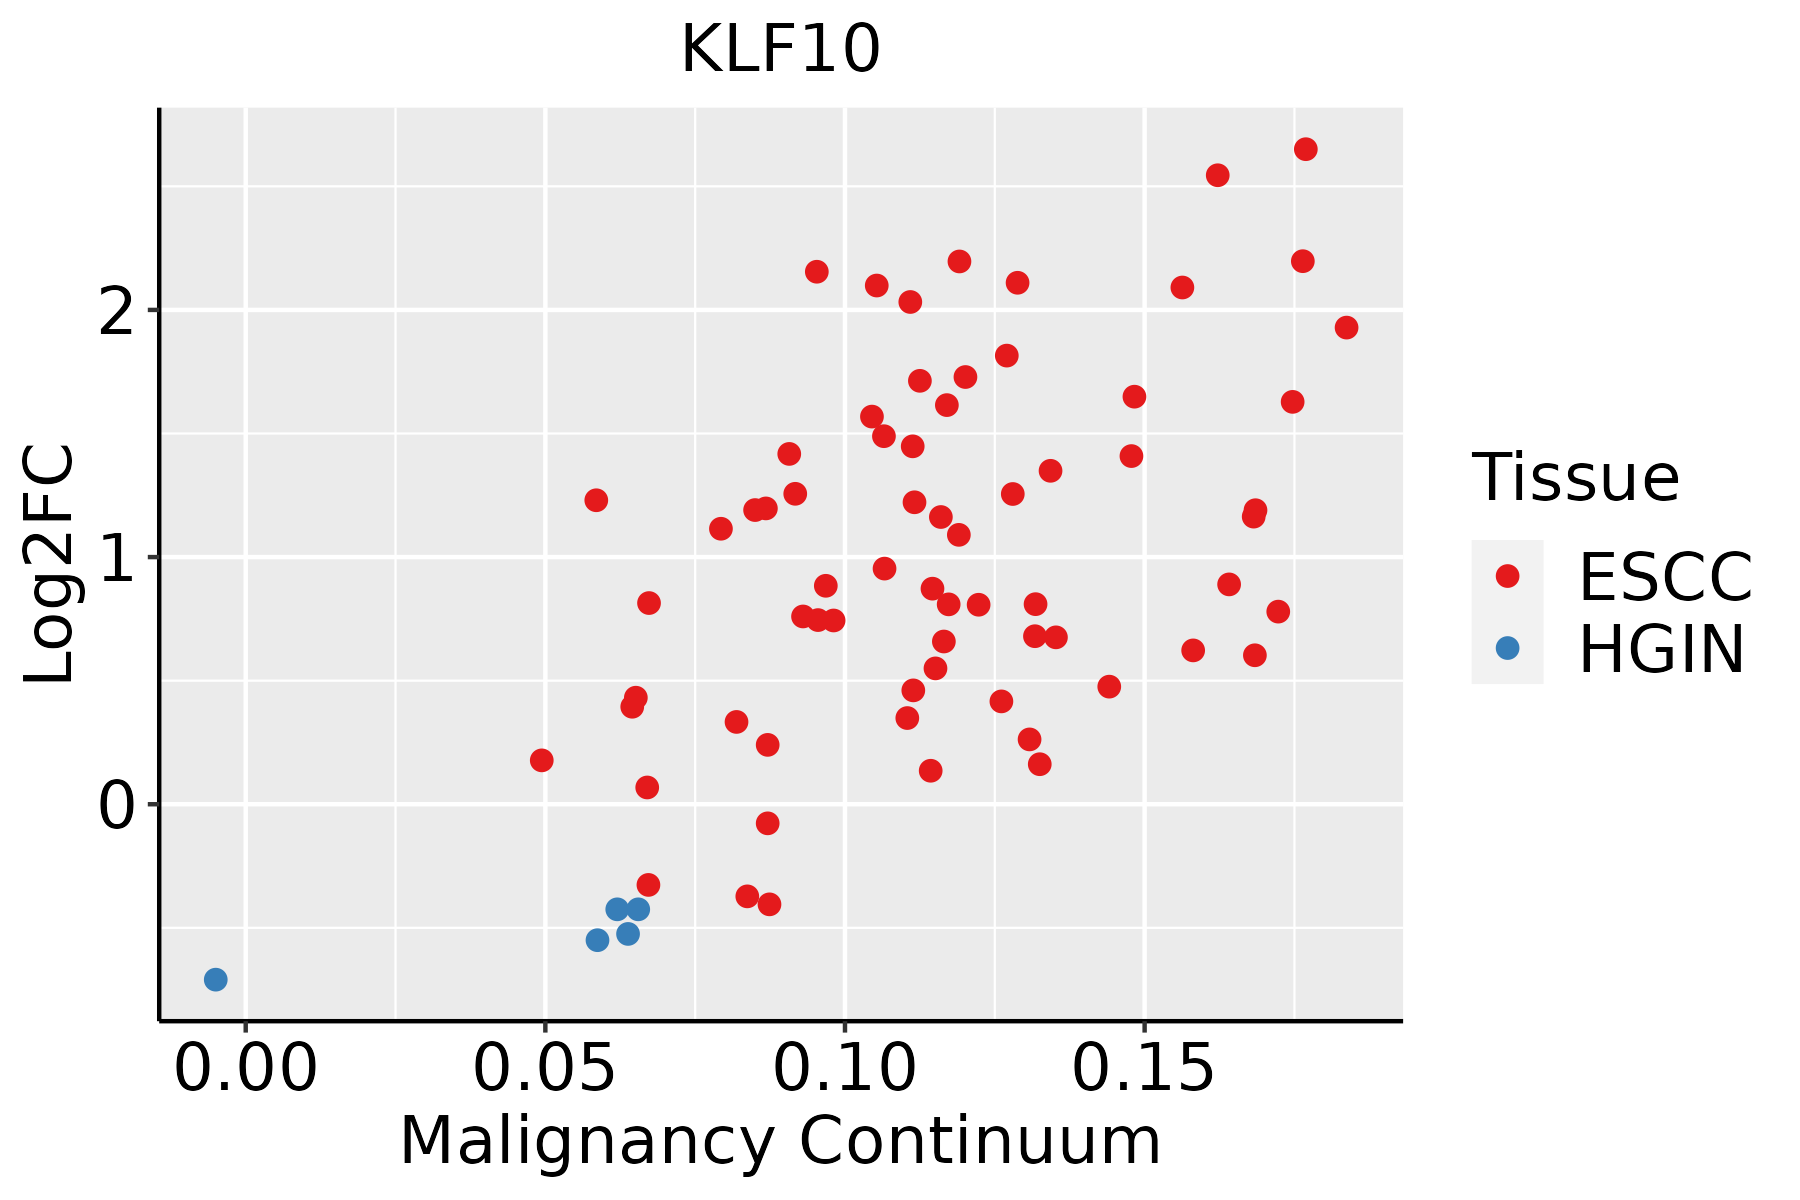 | ESCC: Esophageal squamous cell carcinoma |
| HGIN: High-grade intraepithelial neoplasias |
| LGIN: Low-grade intraepithelial neoplasias |
| Liver | 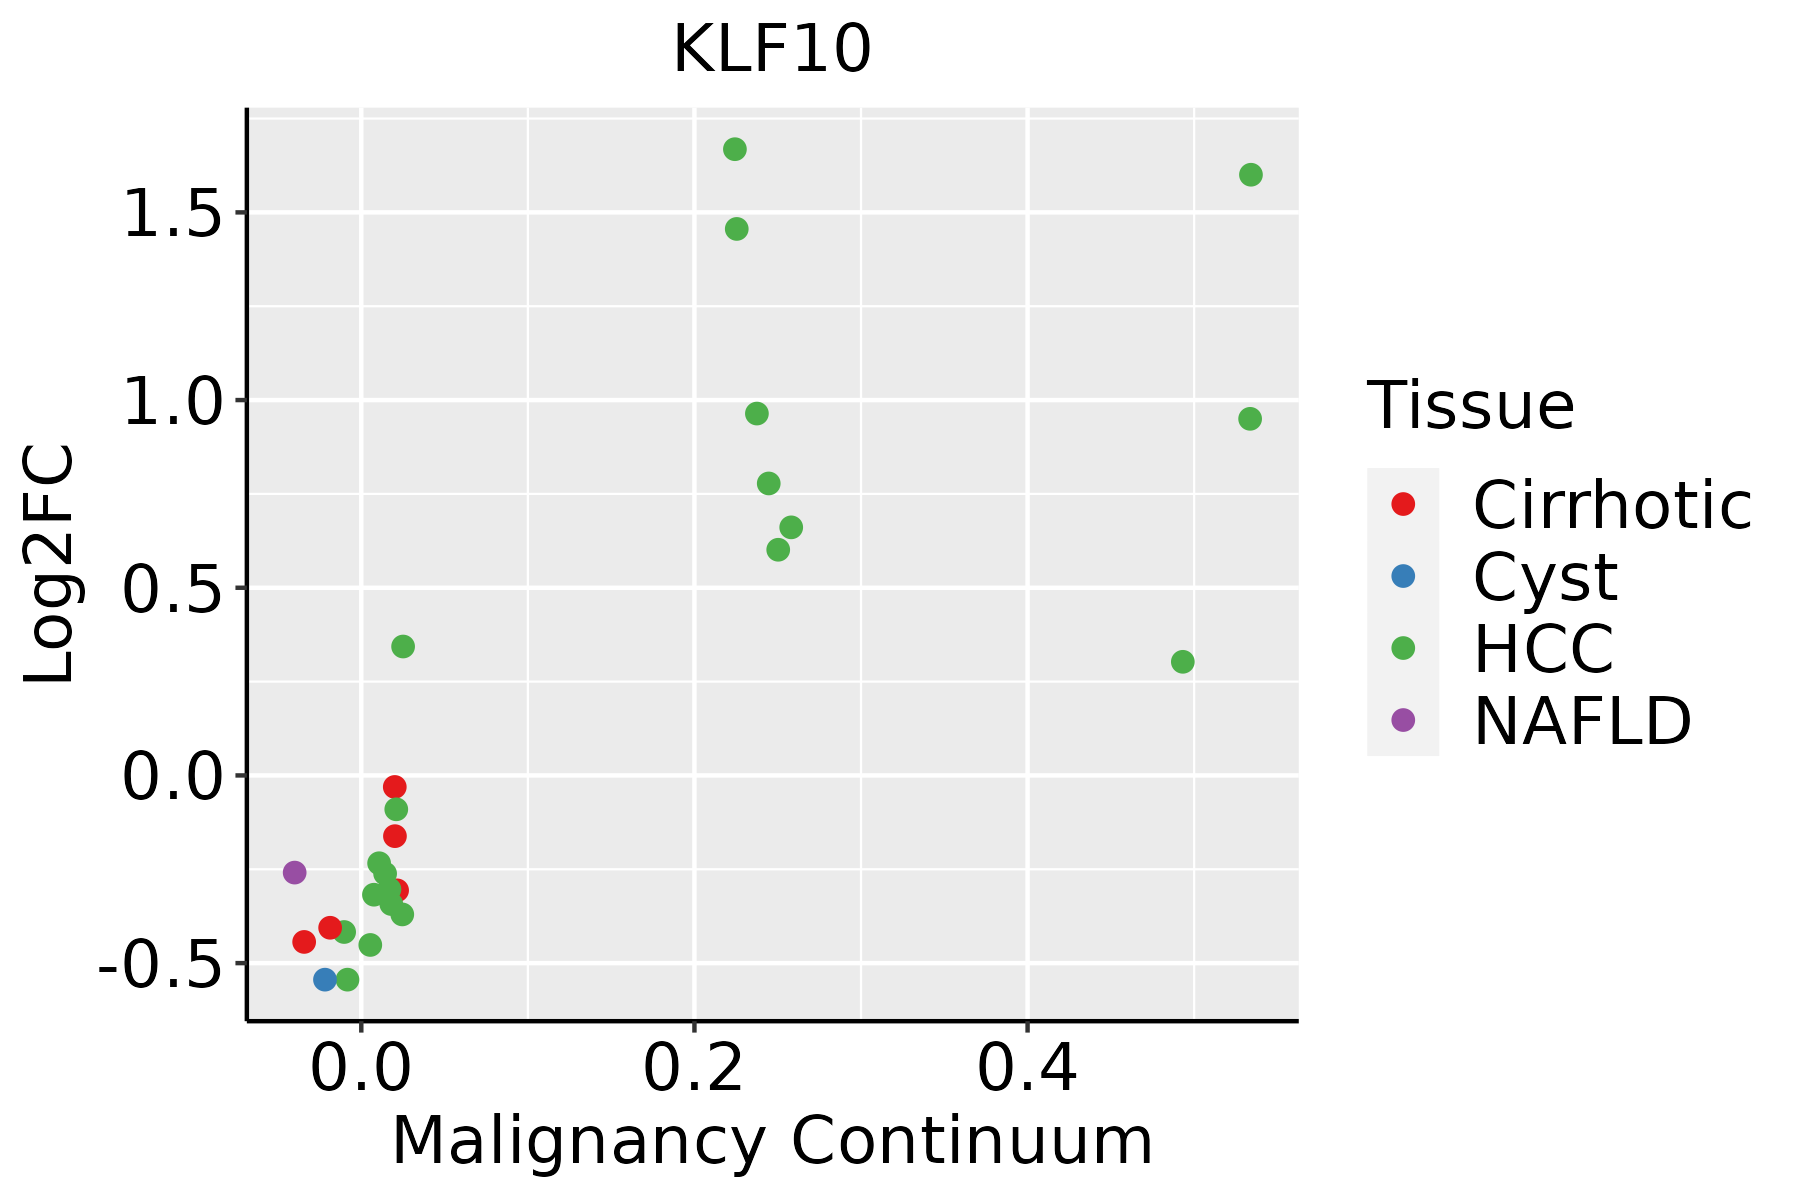 | HCC: Hepatocellular carcinoma |
| NAFLD: Non-alcoholic fatty liver disease |
| Oral Cavity | 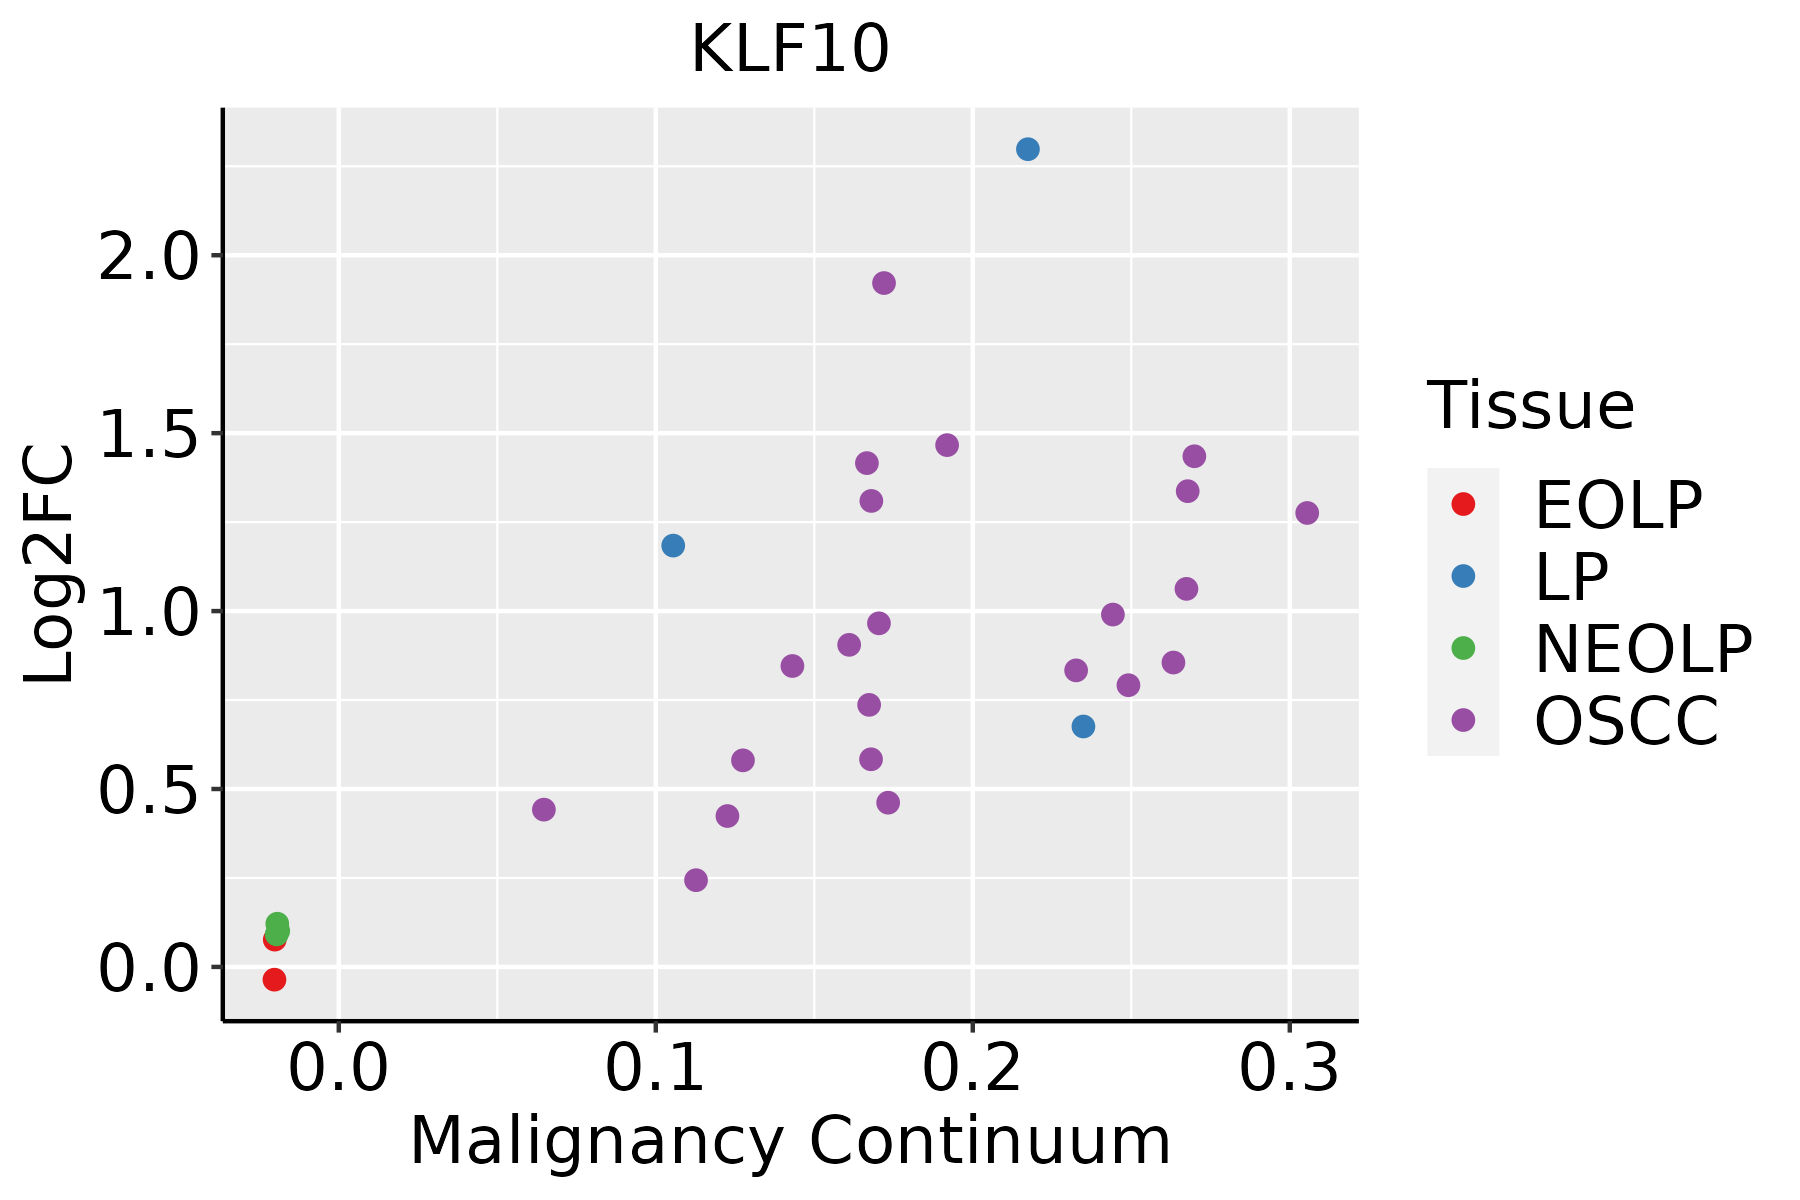 | EOLP: Erosive Oral lichen planus |
| LP: leukoplakia |
| NEOLP: Non-erosive oral lichen planus |
| OSCC: Oral squamous cell carcinoma |
| Prostate | 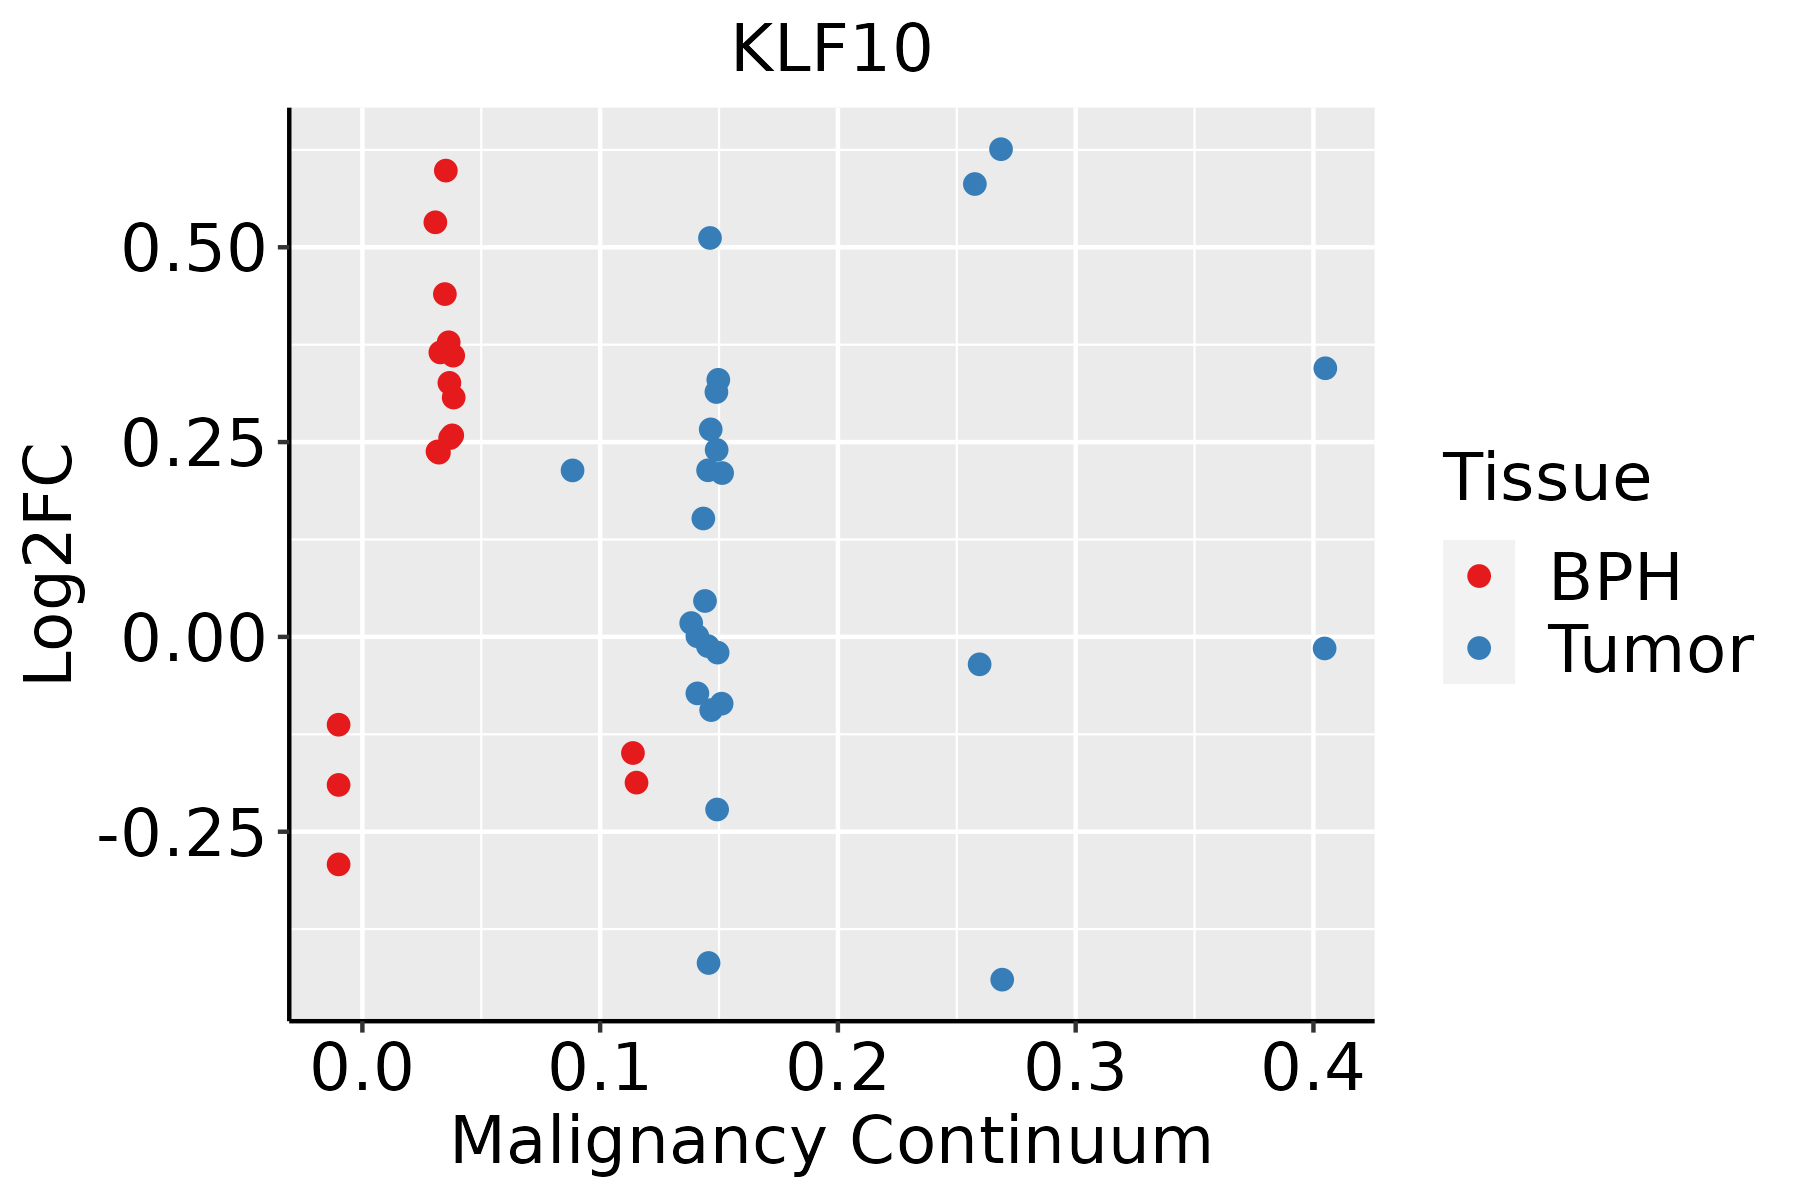 | BPH: Benign Prostatic Hyperplasia |
| Skin | 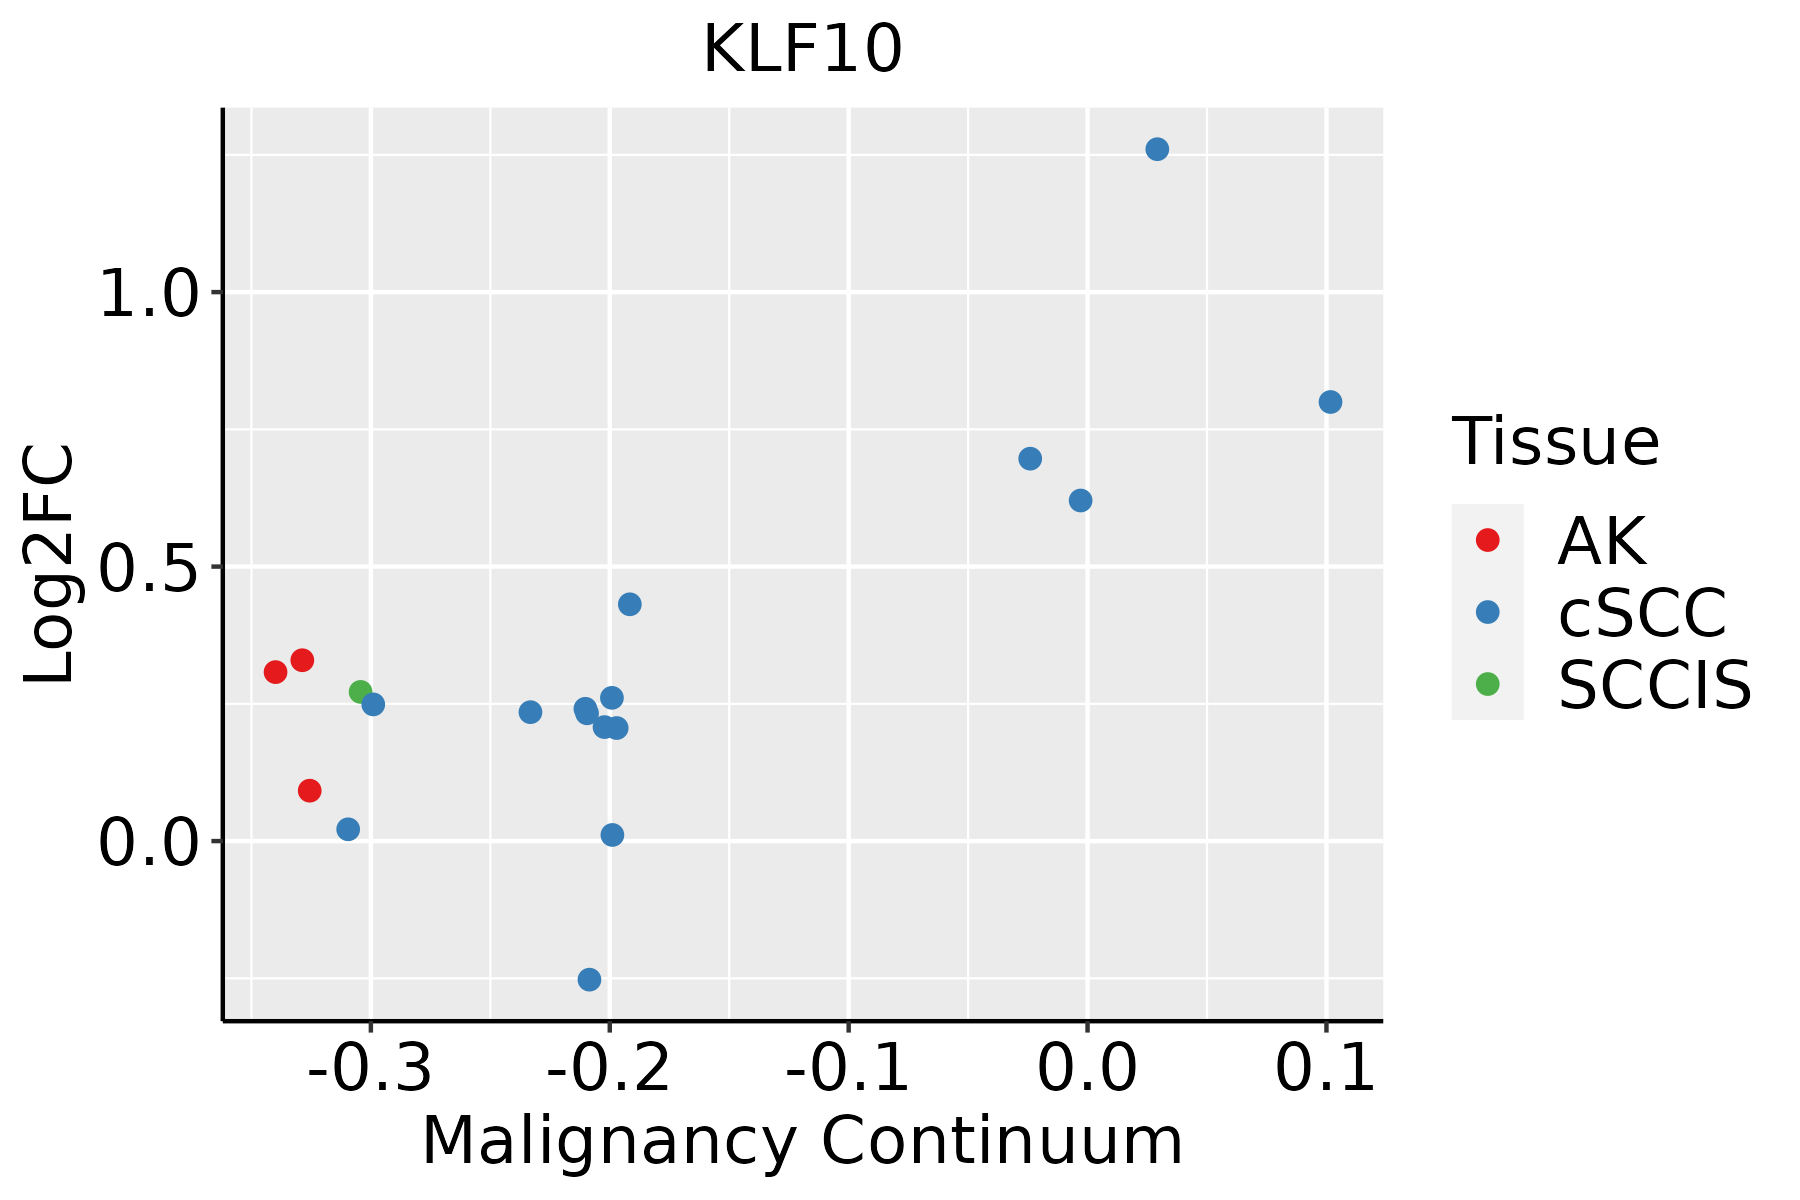 | AK: Actinic keratosis |
| cSCC: Cutaneous squamous cell carcinoma |
| SCCIS:squamous cell carcinoma in situ |
| Thyroid | 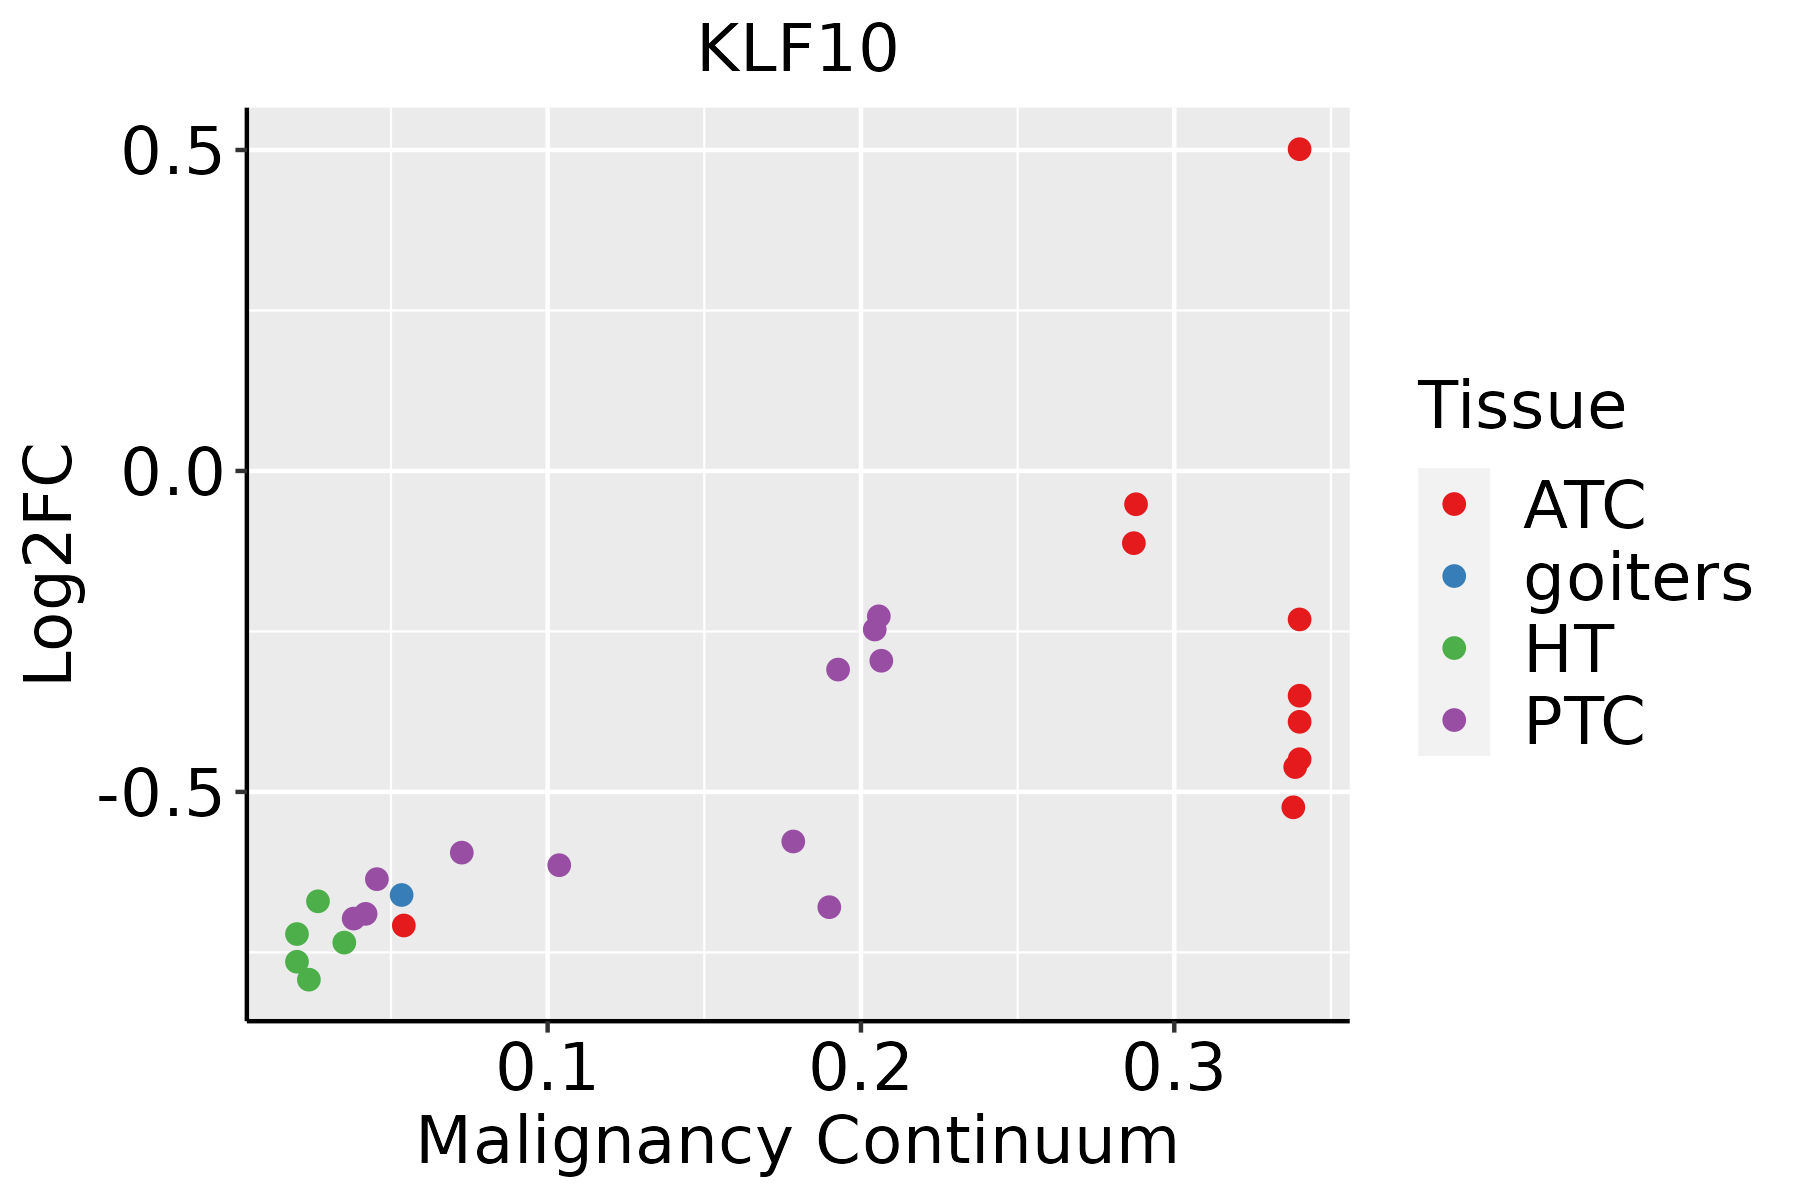 | ATC: Anaplastic thyroid cancer |
| HT: Hashimoto's thyroiditis |
| PTC: Papillary thyroid cancer |
| GO ID | Tissue | Disease Stage | Description | Gene Ratio | Bg Ratio | pvalue | p.adjust | Count |
| GO:00198277 | Esophagus | HGIN | stem cell population maintenance | 39/2587 | 131/18723 | 1.63e-06 | 6.14e-05 | 39 |
| GO:00987278 | Esophagus | HGIN | maintenance of cell number | 39/2587 | 134/18723 | 3.02e-06 | 1.03e-04 | 39 |
| GO:003009927 | Esophagus | HGIN | myeloid cell differentiation | 83/2587 | 381/18723 | 1.26e-05 | 3.52e-04 | 83 |
| GO:007149626 | Esophagus | HGIN | cellular response to external stimulus | 71/2587 | 320/18723 | 2.77e-05 | 7.19e-04 | 71 |
| GO:003166820 | Esophagus | HGIN | cellular response to extracellular stimulus | 56/2587 | 246/18723 | 9.05e-05 | 1.97e-03 | 56 |
| GO:004563725 | Esophagus | HGIN | regulation of myeloid cell differentiation | 49/2587 | 210/18723 | 1.28e-04 | 2.61e-03 | 49 |
| GO:00027617 | Esophagus | HGIN | regulation of myeloid leukocyte differentiation | 31/2587 | 120/18723 | 3.35e-04 | 5.50e-03 | 31 |
| GO:003166920 | Esophagus | HGIN | cellular response to nutrient levels | 47/2587 | 215/18723 | 8.20e-04 | 1.07e-02 | 47 |
| GO:000257316 | Esophagus | HGIN | myeloid leukocyte differentiation | 45/2587 | 208/18723 | 1.31e-03 | 1.56e-02 | 45 |
| GO:004563917 | Esophagus | HGIN | positive regulation of myeloid cell differentiation | 26/2587 | 103/18723 | 1.40e-03 | 1.63e-02 | 26 |
| GO:003166726 | Esophagus | HGIN | response to nutrient levels | 89/2587 | 474/18723 | 1.41e-03 | 1.64e-02 | 89 |
| GO:000762318 | Esophagus | HGIN | circadian rhythm | 45/2587 | 210/18723 | 1.60e-03 | 1.79e-02 | 45 |
| GO:0035019 | Esophagus | HGIN | somatic stem cell population maintenance | 13/2587 | 42/18723 | 3.32e-03 | 3.12e-02 | 13 |
| GO:190165318 | Esophagus | HGIN | cellular response to peptide | 68/2587 | 359/18723 | 3.88e-03 | 3.54e-02 | 68 |
| GO:000926719 | Esophagus | HGIN | cellular response to starvation | 34/2587 | 156/18723 | 4.21e-03 | 3.77e-02 | 34 |
| GO:004259418 | Esophagus | HGIN | response to starvation | 41/2587 | 197/18723 | 4.34e-03 | 3.84e-02 | 41 |
| GO:00027633 | Esophagus | HGIN | positive regulation of myeloid leukocyte differentiation | 16/2587 | 58/18723 | 4.35e-03 | 3.84e-02 | 16 |
| GO:190370620 | Esophagus | HGIN | regulation of hemopoiesis | 69/2587 | 367/18723 | 4.39e-03 | 3.86e-02 | 69 |
| GO:000150316 | Esophagus | HGIN | ossification | 75/2587 | 408/18723 | 5.49e-03 | 4.49e-02 | 75 |
| GO:0071496111 | Esophagus | ESCC | cellular response to external stimulus | 215/8552 | 320/18723 | 4.29e-15 | 2.43e-13 | 215 |
| TF | Cell Type | Tissue | Disease Stage | Target Gene | RSS | Regulon Activity |
| KLF10 | DC | Breast | ADJ | PABPC4,CD83,IRF2BP2, etc. | 4.95e-02 |  |
| KLF10 | INMON | Cervix | CC | CCL3L1,AZIN1-AS1,C15orf48, etc. | 1.98e-01 |  |
| KLF10 | MON | Cervix | CC | CCL3L1,AZIN1-AS1,C15orf48, etc. | 2.13e-01 | |
| KLF10 | INMON | Cervix | HSIL_HPV | CCL3L1,AZIN1-AS1,C15orf48, etc. | 1.65e-01 |  |
| KLF10 | MAC | Colorectum | CRC | ZSCAN5A,FOXK2,BRD1, etc. | 3.32e-01 |  |
| KLF10 | MON | Colorectum | CRC | ZSCAN5A,FOXK2,BRD1, etc. | 2.70e-01 | |
| KLF10 | MAC | Colorectum | Healthy | ZSCAN5A,FOXK2,BRD1, etc. | 4.38e-01 |  |
| KLF10 | MON | Colorectum | Healthy | ZSCAN5A,FOXK2,BRD1, etc. | 1.15e-01 | |
| KLF10 | MAST | Endometrium | ADJ | MIIP,TJP2,MAPKAPK2, etc. | 1.02e-01 |  |
| KLF10 | MAST | Endometrium | EEC | MIIP,TJP2,MAPKAPK2, etc. | 7.73e-02 |  |
| Hugo Symbol | Variant Class | Variant Classification | dbSNP RS | HGVSc | HGVSp | HGVSp Short | SWISSPROT | BIOTYPE | SIFT | PolyPhen | Tumor Sample Barcode | Tissue | Histology | Sex | Age | Stage | Therapy Types | Drugs | Outcome |
| KLF10 | SNV | Missense_Mutation | rs749961016 | c.551N>A | p.Ser184Tyr | p.S184Y | Q13118 | protein_coding | tolerated(0.98) | benign(0.259) | TCGA-AN-A046-01 | Breast | breast invasive carcinoma | Female | >=65 | I/II | Unknown | Unknown | SD |
| KLF10 | SNV | Missense_Mutation | novel | c.442N>T | p.Pro148Ser | p.P148S | Q13118 | protein_coding | tolerated(0.23) | benign(0.015) | TCGA-BH-A0AV-01 | Breast | breast invasive carcinoma | Female | <65 | I/II | Chemotherapy | taxotere | CR |
| KLF10 | SNV | Missense_Mutation | novel | c.22N>G | p.Leu8Val | p.L8V | Q13118 | protein_coding | tolerated_low_confidence(0.07) | benign(0.014) | TCGA-OL-A5RW-01 | Breast | breast invasive carcinoma | Female | <65 | I/II | Chemotherapy | adriamycin | CR |
| KLF10 | insertion | In_Frame_Ins | novel | c.1054_1055insATCAAAACTTGGACCCTTGGAAAACAAAAGTTTTAATTA | p.Pro352delinsHisGlnAsnLeuAspProTrpLysThrLysValLeuIleThr | p.P352delinsHQNLDPWKTKVLIT | Q13118 | protein_coding | | | TCGA-A8-A0A4-01 | Breast | breast invasive carcinoma | Female | >=65 | I/II | Hormone Therapy | tamoxiphen | CR |
| KLF10 | insertion | In_Frame_Ins | novel | c.578_579insCCCACACAG | p.Val193_Glu194insProHisSer | p.V193_E194insPHS | Q13118 | protein_coding | | | TCGA-AN-A04C-01 | Breast | breast invasive carcinoma | Female | <65 | I/II | Unknown | Unknown | SD |
| KLF10 | insertion | Frame_Shift_Ins | novel | c.577_578insACATTGCTCTACCTCCAACCCCTGC | p.Val193AspfsTer10 | p.V193Dfs*10 | Q13118 | protein_coding | | | TCGA-AN-A04C-01 | Breast | breast invasive carcinoma | Female | <65 | I/II | Unknown | Unknown | SD |
| KLF10 | insertion | Nonsense_Mutation | novel | c.1065_1066insTGAACTGAGTTCGCCCTCCC | p.Lys356Ter | p.K356* | Q13118 | protein_coding | | | TCGA-B6-A0RG-01 | Breast | breast invasive carcinoma | Female | <65 | I/II | Unknown | Unknown | SD |
| KLF10 | insertion | Nonsense_Mutation | novel | c.60_61insTTCCAGTCAACATCGTGGATGTAGTGATTAA | p.Glu21PhefsTer8 | p.E21Ffs*8 | Q13118 | protein_coding | | | TCGA-BH-A0BA-01 | Breast | breast invasive carcinoma | Female | <65 | III/IV | Chemotherapy | cytoxan | SD |
| KLF10 | SNV | Missense_Mutation | novel | c.938N>T | p.Pro313Leu | p.P313L | Q13118 | protein_coding | deleterious(0) | possibly_damaging(0.665) | TCGA-2W-A8YY-01 | Cervix | cervical & endocervical cancer | Female | <65 | I/II | Chemotherapy | cisplatin | CR |
| KLF10 | SNV | Missense_Mutation | novel | c.290N>A | p.Ser97Asn | p.S97N | Q13118 | protein_coding | deleterious(0) | probably_damaging(0.996) | TCGA-2W-A8YY-01 | Cervix | cervical & endocervical cancer | Female | <65 | I/II | Chemotherapy | cisplatin | CR |


