
|
|||||
|
 | |
| |
| |
| |
| |
| |
|
Gene: GORASP2 |
Gene summary for GORASP2 |
| Gene information | Species | Human | Gene symbol | GORASP2 | Gene ID | 26003 |
| Gene name | golgi reassembly stacking protein 2 | |
| Gene Alias | GOLPH6 | |
| Cytomap | 2q31.1 | |
| Gene Type | protein-coding | GO ID | GO:0000003 | UniProtAcc | Q9H8Y8 |
Top |
Malignant transformation analysis |
| Identification of the aberrant gene expression in precancerous and cancerous lesions by comparing the gene expression of stem-like cells in diseased tissues with normal stem cells |
| Entrez ID | Symbol | Replicates | Species | Organ | Tissue | Adj P-value | Log2FC | Malignancy |
| 26003 | GORASP2 | HTA11_347_2000001011 | Human | Colorectum | AD | 1.50e-02 | 2.15e-01 | -0.1954 |
| 26003 | GORASP2 | HTA11_99999965062_69753 | Human | Colorectum | MSI-H | 1.91e-03 | 9.65e-01 | 0.3487 |
| 26003 | GORASP2 | A015-C-203 | Human | Colorectum | FAP | 2.16e-18 | -2.89e-01 | -0.1294 |
| 26003 | GORASP2 | A015-C-204 | Human | Colorectum | FAP | 1.54e-03 | -2.96e-01 | -0.0228 |
| 26003 | GORASP2 | A002-C-201 | Human | Colorectum | FAP | 7.69e-04 | -2.21e-01 | 0.0324 |
| 26003 | GORASP2 | A002-C-203 | Human | Colorectum | FAP | 3.00e-03 | -1.56e-01 | 0.2786 |
| 26003 | GORASP2 | A001-C-108 | Human | Colorectum | FAP | 2.19e-12 | -2.09e-01 | -0.0272 |
| 26003 | GORASP2 | A002-C-205 | Human | Colorectum | FAP | 4.89e-09 | -3.24e-01 | -0.1236 |
| 26003 | GORASP2 | A015-C-006 | Human | Colorectum | FAP | 1.40e-08 | -3.90e-01 | -0.0994 |
| 26003 | GORASP2 | A015-C-106 | Human | Colorectum | FAP | 5.39e-08 | -2.19e-01 | -0.0511 |
| 26003 | GORASP2 | A002-C-114 | Human | Colorectum | FAP | 8.07e-07 | -3.00e-01 | -0.1561 |
| 26003 | GORASP2 | A015-C-104 | Human | Colorectum | FAP | 1.04e-18 | -3.64e-01 | -0.1899 |
| 26003 | GORASP2 | A001-C-014 | Human | Colorectum | FAP | 2.32e-07 | -1.93e-01 | 0.0135 |
| 26003 | GORASP2 | A002-C-016 | Human | Colorectum | FAP | 1.63e-08 | -2.06e-01 | 0.0521 |
| 26003 | GORASP2 | A015-C-002 | Human | Colorectum | FAP | 3.84e-03 | -2.68e-01 | -0.0763 |
| 26003 | GORASP2 | A001-C-203 | Human | Colorectum | FAP | 7.62e-09 | -2.21e-01 | -0.0481 |
| 26003 | GORASP2 | A002-C-116 | Human | Colorectum | FAP | 1.32e-13 | -2.59e-01 | -0.0452 |
| 26003 | GORASP2 | A014-C-008 | Human | Colorectum | FAP | 3.57e-04 | -2.59e-01 | -0.191 |
| 26003 | GORASP2 | A018-E-020 | Human | Colorectum | FAP | 4.13e-07 | -2.97e-01 | -0.2034 |
| 26003 | GORASP2 | F034 | Human | Colorectum | FAP | 4.30e-11 | -2.76e-01 | -0.0665 |
| Page: 1 2 3 4 5 6 7 |
| Tissue | Expression Dynamics | Abbreviation |
| Colorectum (GSE201348) |  | FAP: Familial adenomatous polyposis |
| CRC: Colorectal cancer | ||
| Colorectum (HTA11) |  | AD: Adenomas |
| SER: Sessile serrated lesions | ||
| MSI-H: Microsatellite-high colorectal cancer | ||
| MSS: Microsatellite stable colorectal cancer | ||
| Esophagus |  | ESCC: Esophageal squamous cell carcinoma |
| HGIN: High-grade intraepithelial neoplasias | ||
| LGIN: Low-grade intraepithelial neoplasias | ||
| Liver | 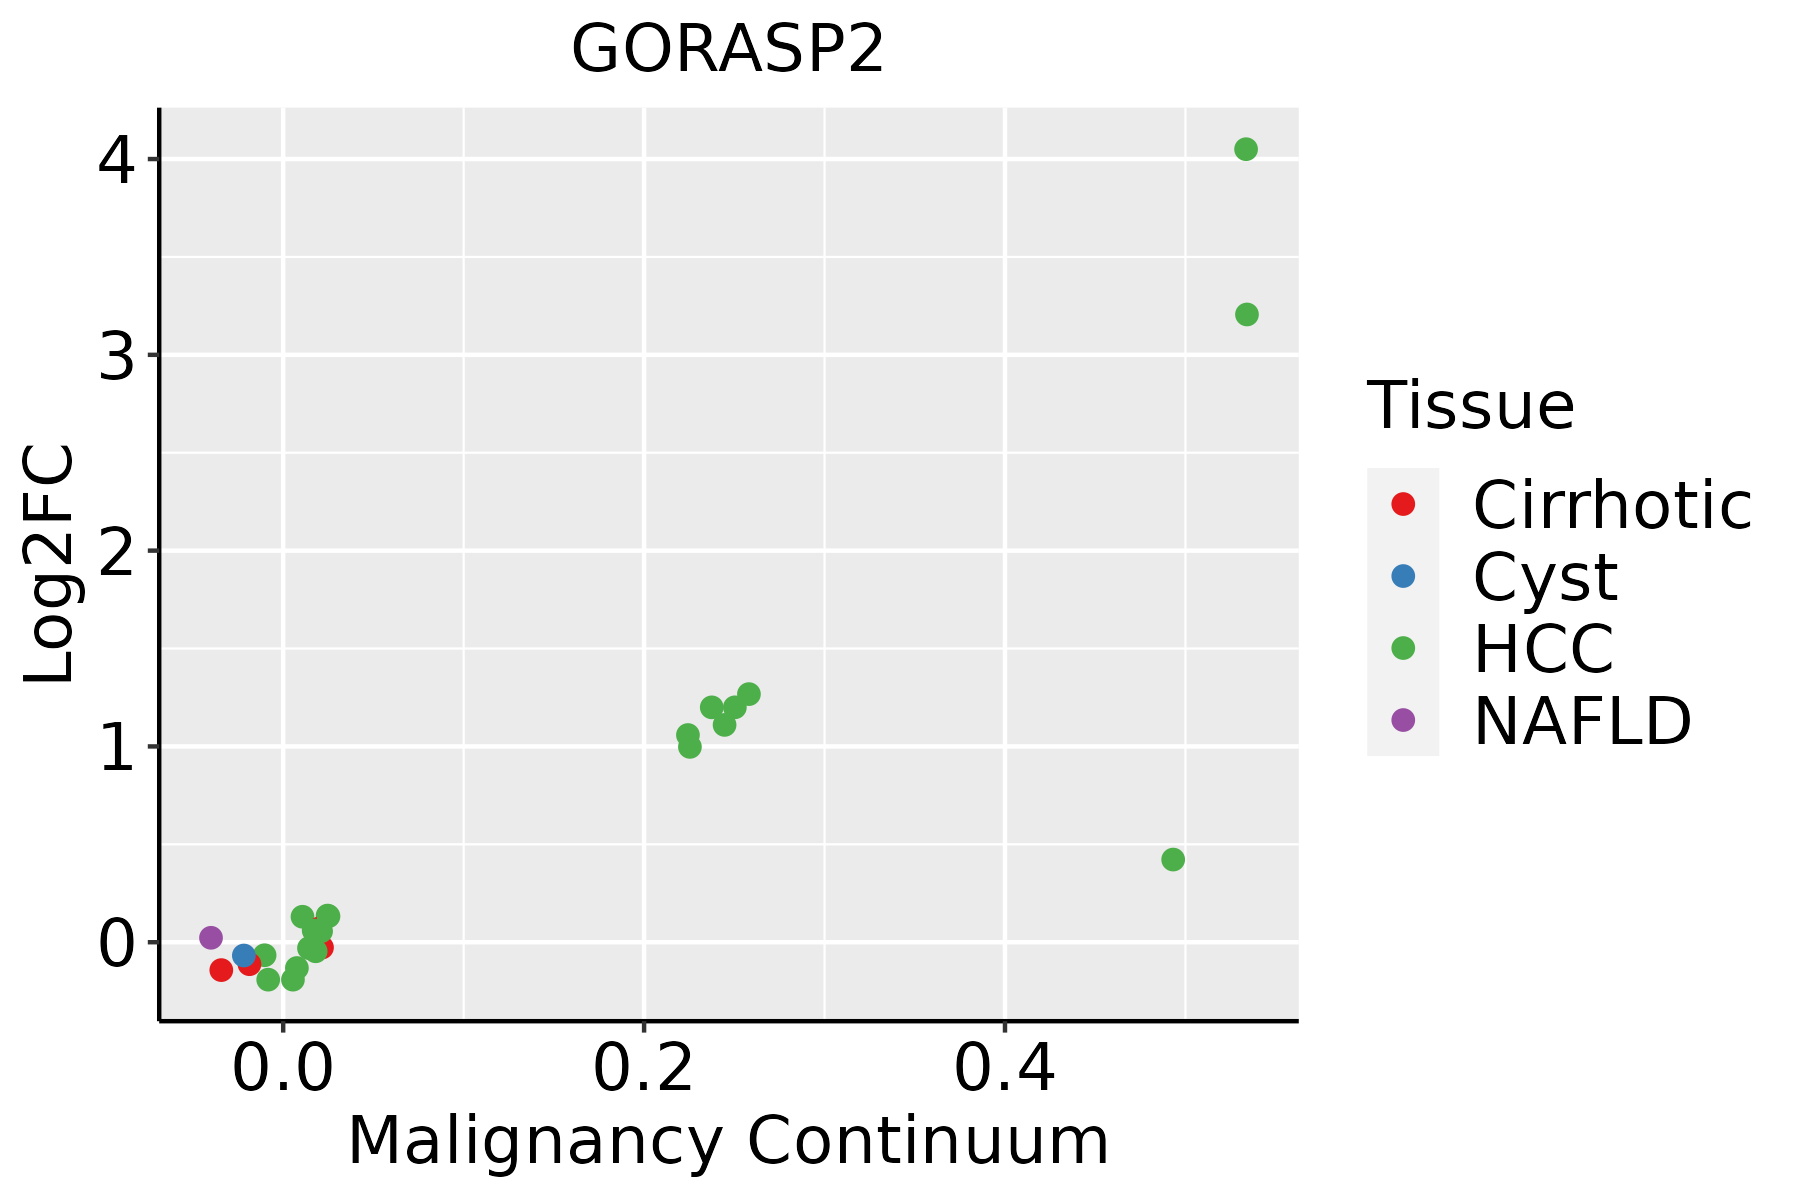 | HCC: Hepatocellular carcinoma |
| NAFLD: Non-alcoholic fatty liver disease | ||
| Oral Cavity |  | EOLP: Erosive Oral lichen planus |
| LP: leukoplakia | ||
| NEOLP: Non-erosive oral lichen planus | ||
| OSCC: Oral squamous cell carcinoma | ||
| Skin |  | AK: Actinic keratosis |
| cSCC: Cutaneous squamous cell carcinoma | ||
| SCCIS:squamous cell carcinoma in situ | ||
| Thyroid |  | ATC: Anaplastic thyroid cancer |
| HT: Hashimoto's thyroiditis | ||
| PTC: Papillary thyroid cancer |
| ∗log2FC in expression of this searched gene in stem-like cells from each diseased tissue sample relative to stem-like cells in normal samples in each tissue plotted against the malignancy continuum. Samples are colored based on if they are from different disease stage. |
Top |
Malignant transformation related pathway analysis |
| Find out the enriched GO biological processes and KEGG pathways involved in transition from healthy to precancer to cancer |
| Tissue | Disease Stage | Enriched GO biological Processes |
| Breast | Precancer |  |
| Breast | IDC |  |
| Breast | DCIS |  |
| Cervix | CC |  |
| Cervix | HSIL_HPV |  |
| ∗Top 15 enriched GO BP terms are showed in the bar plot of each disease state in each tissue. Each row represents a significant GO biological process which is colored according to the -log10(p.adjust). |
| Page: 1 2 3 4 5 6 7 8 9 |
| GO ID | Tissue | Disease Stage | Description | Gene Ratio | Bg Ratio | pvalue | p.adjust | Count |
| GO:0072659 | Colorectum | AD | protein localization to plasma membrane | 122/3918 | 284/18723 | 2.86e-17 | 1.49e-14 | 122 |
| GO:1990778 | Colorectum | AD | protein localization to cell periphery | 129/3918 | 333/18723 | 5.51e-14 | 1.15e-11 | 129 |
| GO:0090150 | Colorectum | AD | establishment of protein localization to membrane | 100/3918 | 260/18723 | 6.01e-11 | 6.33e-09 | 100 |
| GO:0034976 | Colorectum | AD | response to endoplasmic reticulum stress | 90/3918 | 256/18723 | 8.48e-08 | 4.28e-06 | 90 |
| GO:0061951 | Colorectum | AD | establishment of protein localization to plasma membrane | 31/3918 | 60/18723 | 1.37e-07 | 6.42e-06 | 31 |
| GO:00349763 | Colorectum | MSI-H | response to endoplasmic reticulum stress | 39/1319 | 256/18723 | 4.12e-06 | 2.20e-04 | 39 |
| GO:00726593 | Colorectum | MSI-H | protein localization to plasma membrane | 38/1319 | 284/18723 | 1.03e-04 | 3.18e-03 | 38 |
| GO:19907783 | Colorectum | MSI-H | protein localization to cell periphery | 40/1319 | 333/18723 | 6.61e-04 | 1.27e-02 | 40 |
| GO:00901503 | Colorectum | MSI-H | establishment of protein localization to membrane | 32/1319 | 260/18723 | 1.47e-03 | 2.23e-02 | 32 |
| GO:00726594 | Colorectum | FAP | protein localization to plasma membrane | 95/2622 | 284/18723 | 4.86e-17 | 9.93e-14 | 95 |
| GO:19907784 | Colorectum | FAP | protein localization to cell periphery | 100/2622 | 333/18723 | 2.19e-14 | 2.68e-11 | 100 |
| GO:00901504 | Colorectum | FAP | establishment of protein localization to membrane | 69/2622 | 260/18723 | 6.40e-08 | 4.54e-06 | 69 |
| GO:00619513 | Colorectum | FAP | establishment of protein localization to plasma membrane | 24/2622 | 60/18723 | 6.30e-07 | 3.09e-05 | 24 |
| GO:00349764 | Colorectum | FAP | response to endoplasmic reticulum stress | 61/2622 | 256/18723 | 1.58e-05 | 4.10e-04 | 61 |
| GO:00726595 | Colorectum | CRC | protein localization to plasma membrane | 80/2078 | 284/18723 | 1.36e-15 | 4.07e-12 | 80 |
| GO:19907785 | Colorectum | CRC | protein localization to cell periphery | 85/2078 | 333/18723 | 8.75e-14 | 1.05e-10 | 85 |
| GO:00619514 | Colorectum | CRC | establishment of protein localization to plasma membrane | 22/2078 | 60/18723 | 1.89e-07 | 1.92e-05 | 22 |
| GO:00901505 | Colorectum | CRC | establishment of protein localization to membrane | 51/2078 | 260/18723 | 3.59e-05 | 9.05e-04 | 51 |
| GO:003497625 | Esophagus | HGIN | response to endoplasmic reticulum stress | 81/2587 | 256/18723 | 1.47e-13 | 2.32e-11 | 81 |
| GO:009015020 | Esophagus | HGIN | establishment of protein localization to membrane | 67/2587 | 260/18723 | 1.96e-07 | 9.57e-06 | 67 |
| Page: 1 2 3 4 |
| Pathway ID | Tissue | Disease Stage | Description | Gene Ratio | Bg Ratio | pvalue | p.adjust | qvalue | Count |
| Page: 1 |
Top |
Cell-cell communication analysis |
| Identification of potential cell-cell interactions between two cell types and their ligand-receptor pairs for different disease states |
| Ligand | Receptor | LRpair | Pathway | Tissue | Disease Stage |
| Page: 1 |
Top |
Single-cell gene regulatory network inference analysis |
| Find out the significant the regulons (TFs) and the target genes of each regulon across cell types for different disease states |
| TF | Cell Type | Tissue | Disease Stage | Target Gene | RSS | Regulon Activity |
| ∗The dot plots of a searched regulon are shown for all cell subpopulations in each disease state of each tissue based on the regulon specific score inferred using pySCENIC and by calculating the average expression. |
| Page: 1 |
Top |
Somatic mutation of malignant transformation related genes |
| Annotation of somatic variants for genes involved in malignant transformation |
| Hugo Symbol | Variant Class | Variant Classification | dbSNP RS | HGVSc | HGVSp | HGVSp Short | SWISSPROT | BIOTYPE | SIFT | PolyPhen | Tumor Sample Barcode | Tissue | Histology | Sex | Age | Stage | Therapy Types | Drugs | Outcome |
| GORASP2 | SNV | Missense_Mutation | c.553N>A | p.Gly185Ser | p.G185S | Q9H8Y8 | protein_coding | deleterious(0) | probably_damaging(0.998) | TCGA-A2-A0YK-01 | Breast | breast invasive carcinoma | Female | <65 | I/II | Chemotherapy | cytoxan | SD | |
| GORASP2 | SNV | Missense_Mutation | novel | c.1091N>C | p.Phe364Ser | p.F364S | Q9H8Y8 | protein_coding | tolerated(0.13) | benign(0.051) | TCGA-A8-A08H-01 | Breast | breast invasive carcinoma | Female | >=65 | I/II | Unknown | Unknown | SD |
| GORASP2 | deletion | Frame_Shift_Del | c.1246delN | p.Thr418LeufsTer74 | p.T418Lfs*74 | Q9H8Y8 | protein_coding | TCGA-EW-A1IZ-01 | Breast | breast invasive carcinoma | Female | <65 | III/IV | Chemotherapy | taxotere | SD | |||
| GORASP2 | deletion | Frame_Shift_Del | novel | c.547delN | p.Ala183HisfsTer8 | p.A183Hfs*8 | Q9H8Y8 | protein_coding | TCGA-EW-A2FV-01 | Breast | breast invasive carcinoma | Female | <65 | III/IV | Chemotherapy | docetaxel | SD | ||
| GORASP2 | SNV | Missense_Mutation | novel | c.302G>A | p.Arg101His | p.R101H | Q9H8Y8 | protein_coding | deleterious(0) | probably_damaging(1) | TCGA-2W-A8YY-01 | Cervix | cervical & endocervical cancer | Female | <65 | I/II | Chemotherapy | cisplatin | CR |
| GORASP2 | SNV | Missense_Mutation | c.65N>C | p.Val22Ala | p.V22A | Q9H8Y8 | protein_coding | deleterious(0) | probably_damaging(0.999) | TCGA-A6-6780-01 | Colorectum | colon adenocarcinoma | Male | >=65 | I/II | Unknown | Unknown | SD | |
| GORASP2 | SNV | Missense_Mutation | novel | c.106N>C | p.Phe36Leu | p.F36L | Q9H8Y8 | protein_coding | deleterious(0) | probably_damaging(0.953) | TCGA-AM-5820-01 | Colorectum | colon adenocarcinoma | Female | <65 | I/II | Unknown | Unknown | SD |
| GORASP2 | SNV | Missense_Mutation | rs778067597 | c.1177G>A | p.Ala393Thr | p.A393T | Q9H8Y8 | protein_coding | tolerated_low_confidence(0.39) | benign(0.009) | TCGA-AM-5821-01 | Colorectum | colon adenocarcinoma | Female | >=65 | I/II | Unknown | Unknown | SD |
| GORASP2 | SNV | Missense_Mutation | c.397A>G | p.Ser133Gly | p.S133G | Q9H8Y8 | protein_coding | deleterious(0.01) | benign(0.088) | TCGA-AY-A71X-01 | Colorectum | colon adenocarcinoma | Female | <65 | I/II | Unknown | Unknown | SD | |
| GORASP2 | SNV | Missense_Mutation | novel | c.641N>A | p.Ser214Tyr | p.S214Y | Q9H8Y8 | protein_coding | deleterious(0.02) | benign(0.066) | TCGA-AZ-4315-01 | Colorectum | colon adenocarcinoma | Male | <65 | I/II | Unknown | Unknown | SD |
| Page: 1 2 3 4 5 6 |
Top |
Related drugs of malignant transformation related genes |
| Identification of chemicals and drugs interact with genes involved in malignant transfromation |
| (DGIdb 4.0) |
| Entrez ID | Symbol | Category | Interaction Types | Drug Claim Name | Drug Name | PMIDs |
| Page: 1 |

Copyright 2023-Present -The University of Texas Health Science Center at Houston |