
|
|||||
|
 | |
| |
| |
| |
| |
| |
|
Gene: FOXA2 |
Gene summary for FOXA2 |
| Gene information | Species | Human | Gene symbol | FOXA2 | Gene ID | 3170 |
| Gene name | forkhead box A2 | |
| Gene Alias | HNF-3-beta | |
| Cytomap | 20p11.21 | |
| Gene Type | protein-coding | GO ID | GO:0000429 | UniProtAcc | B0ZTD4 |
Top |
Malignant transformation analysis |
| Identification of the aberrant gene expression in precancerous and cancerous lesions by comparing the gene expression of stem-like cells in diseased tissues with normal stem cells |
| Entrez ID | Symbol | Replicates | Species | Organ | Tissue | Adj P-value | Log2FC | Malignancy |
| 3170 | FOXA2 | HTA11_3410_2000001011 | Human | Colorectum | AD | 3.47e-03 | 1.03e-01 | 0.0155 |
| 3170 | FOXA2 | HTA11_2487_2000001011 | Human | Colorectum | SER | 8.42e-05 | 1.98e-01 | -0.1808 |
| 3170 | FOXA2 | HTA11_78_2000001011 | Human | Colorectum | AD | 6.21e-16 | 4.30e-01 | -0.1088 |
| 3170 | FOXA2 | HTA11_347_2000001011 | Human | Colorectum | AD | 1.95e-18 | 4.07e-01 | -0.1954 |
| 3170 | FOXA2 | HTA11_411_2000001011 | Human | Colorectum | SER | 2.50e-11 | 8.79e-01 | -0.2602 |
| 3170 | FOXA2 | HTA11_2112_2000001011 | Human | Colorectum | SER | 1.50e-04 | 3.37e-01 | -0.2196 |
| 3170 | FOXA2 | HTA11_3361_2000001011 | Human | Colorectum | AD | 4.57e-06 | 2.57e-01 | -0.1207 |
| 3170 | FOXA2 | HTA11_696_2000001011 | Human | Colorectum | AD | 1.63e-22 | 5.14e-01 | -0.1464 |
| 3170 | FOXA2 | HTA11_866_2000001011 | Human | Colorectum | AD | 4.28e-10 | 2.59e-01 | -0.1001 |
| 3170 | FOXA2 | HTA11_1391_2000001011 | Human | Colorectum | AD | 4.63e-07 | 2.56e-01 | -0.059 |
| 3170 | FOXA2 | HTA11_2992_2000001011 | Human | Colorectum | SER | 2.14e-07 | 3.79e-01 | -0.1706 |
| 3170 | FOXA2 | HTA11_5212_2000001011 | Human | Colorectum | AD | 3.03e-03 | 1.93e-01 | -0.2061 |
| 3170 | FOXA2 | HTA11_546_2000001011 | Human | Colorectum | AD | 1.56e-06 | 2.90e-01 | -0.0842 |
| 3170 | FOXA2 | HTA11_7862_2000001011 | Human | Colorectum | AD | 5.15e-10 | 3.55e-01 | -0.0179 |
| 3170 | FOXA2 | HTA11_866_3004761011 | Human | Colorectum | AD | 4.30e-20 | 4.39e-01 | 0.096 |
| 3170 | FOXA2 | HTA11_4255_2000001011 | Human | Colorectum | SER | 3.22e-05 | 4.41e-01 | 0.0446 |
| 3170 | FOXA2 | HTA11_8622_2000001021 | Human | Colorectum | SER | 3.89e-10 | 4.21e-01 | 0.0528 |
| 3170 | FOXA2 | HTA11_6801_2000001011 | Human | Colorectum | SER | 2.21e-02 | 2.06e-01 | 0.0171 |
| 3170 | FOXA2 | HTA11_7696_3000711011 | Human | Colorectum | AD | 2.05e-06 | 1.84e-01 | 0.0674 |
| 3170 | FOXA2 | HTA11_6818_2000001011 | Human | Colorectum | AD | 2.00e-08 | 4.88e-01 | 0.0112 |
| Page: 1 2 3 |
| Tissue | Expression Dynamics | Abbreviation |
| Colorectum (GSE201348) |  | FAP: Familial adenomatous polyposis |
| CRC: Colorectal cancer | ||
| Colorectum (HTA11) |  | AD: Adenomas |
| SER: Sessile serrated lesions | ||
| MSI-H: Microsatellite-high colorectal cancer | ||
| MSS: Microsatellite stable colorectal cancer | ||
| Liver | 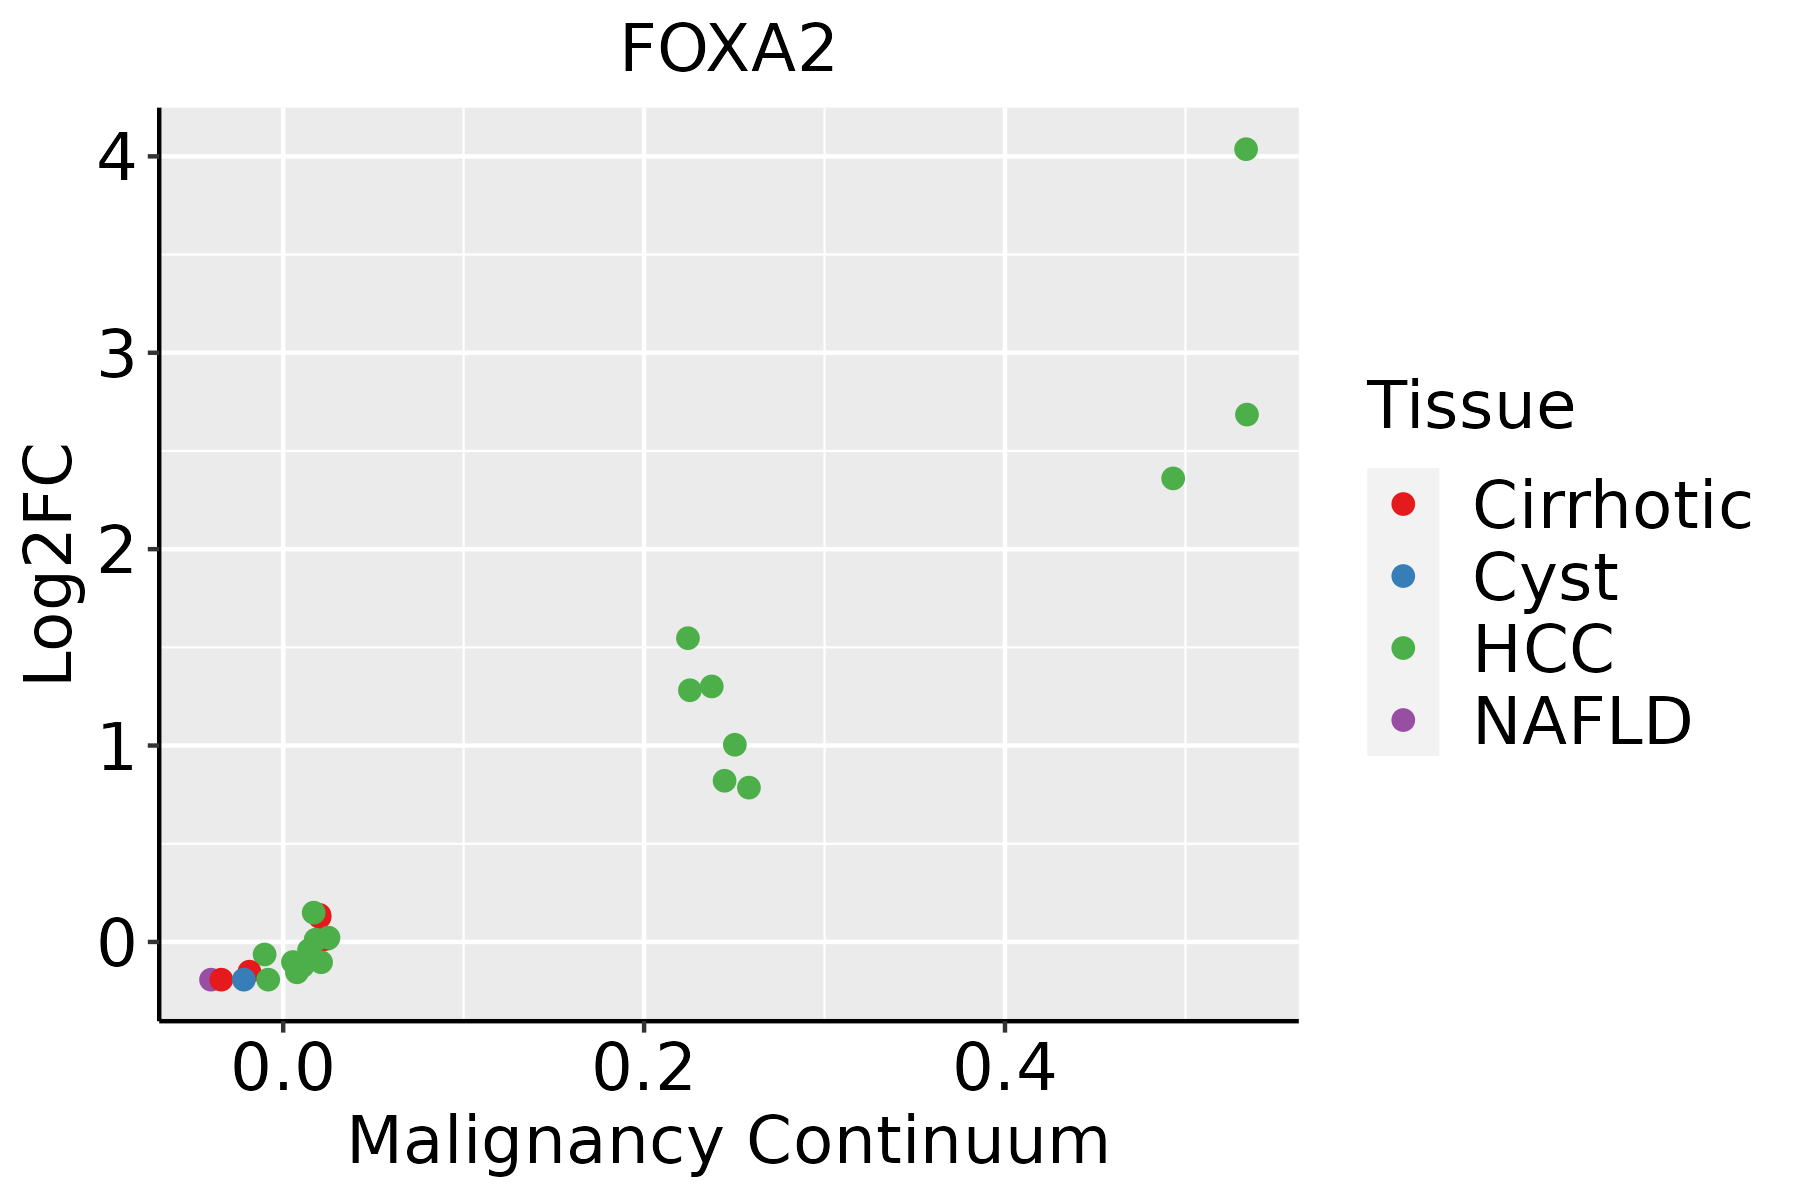 | HCC: Hepatocellular carcinoma |
| NAFLD: Non-alcoholic fatty liver disease |
| ∗log2FC in expression of this searched gene in stem-like cells from each diseased tissue sample relative to stem-like cells in normal samples in each tissue plotted against the malignancy continuum. Samples are colored based on if they are from different disease stage. |
Top |
Malignant transformation related pathway analysis |
| Find out the enriched GO biological processes and KEGG pathways involved in transition from healthy to precancer to cancer |
| Tissue | Disease Stage | Enriched GO biological Processes |
| Breast | Precancer |  |
| Breast | IDC |  |
| Breast | DCIS |  |
| Cervix | CC |  |
| Cervix | HSIL_HPV |  |
| ∗Top 15 enriched GO BP terms are showed in the bar plot of each disease state in each tissue. Each row represents a significant GO biological process which is colored according to the -log10(p.adjust). |
| Page: 1 2 3 4 5 6 7 8 9 |
| GO ID | Tissue | Disease Stage | Description | Gene Ratio | Bg Ratio | pvalue | p.adjust | Count |
| GO:0009743 | Colorectum | AD | response to carbohydrate | 86/3918 | 253/18723 | 8.43e-07 | 2.90e-05 | 86 |
| GO:0042060 | Colorectum | AD | wound healing | 128/3918 | 422/18723 | 2.73e-06 | 7.89e-05 | 128 |
| GO:0034284 | Colorectum | AD | response to monosaccharide | 76/3918 | 225/18723 | 4.64e-06 | 1.23e-04 | 76 |
| GO:0033500 | Colorectum | AD | carbohydrate homeostasis | 84/3918 | 259/18723 | 9.10e-06 | 2.15e-04 | 84 |
| GO:0009746 | Colorectum | AD | response to hexose | 73/3918 | 219/18723 | 1.20e-05 | 2.65e-04 | 73 |
| GO:0031667 | Colorectum | AD | response to nutrient levels | 138/3918 | 474/18723 | 1.22e-05 | 2.68e-04 | 138 |
| GO:0010563 | Colorectum | AD | negative regulation of phosphorus metabolic process | 130/3918 | 442/18723 | 1.26e-05 | 2.76e-04 | 130 |
| GO:0009749 | Colorectum | AD | response to glucose | 71/3918 | 212/18723 | 1.31e-05 | 2.85e-04 | 71 |
| GO:0042593 | Colorectum | AD | glucose homeostasis | 83/3918 | 258/18723 | 1.44e-05 | 3.11e-04 | 83 |
| GO:0001678 | Colorectum | AD | cellular glucose homeostasis | 60/3918 | 172/18723 | 1.49e-05 | 3.18e-04 | 60 |
| GO:0045936 | Colorectum | AD | negative regulation of phosphate metabolic process | 129/3918 | 441/18723 | 1.81e-05 | 3.76e-04 | 129 |
| GO:0019318 | Colorectum | AD | hexose metabolic process | 77/3918 | 237/18723 | 1.96e-05 | 4.01e-04 | 77 |
| GO:0051348 | Colorectum | AD | negative regulation of transferase activity | 85/3918 | 268/18723 | 2.07e-05 | 4.19e-04 | 85 |
| GO:0071322 | Colorectum | AD | cellular response to carbohydrate stimulus | 56/3918 | 163/18723 | 4.61e-05 | 7.97e-04 | 56 |
| GO:0006325 | Colorectum | AD | chromatin organization | 119/3918 | 409/18723 | 4.85e-05 | 8.33e-04 | 119 |
| GO:0044262 | Colorectum | AD | cellular carbohydrate metabolic process | 87/3918 | 283/18723 | 6.00e-05 | 1.01e-03 | 87 |
| GO:0050708 | Colorectum | AD | regulation of protein secretion | 83/3918 | 268/18723 | 6.59e-05 | 1.07e-03 | 83 |
| GO:0005996 | Colorectum | AD | monosaccharide metabolic process | 80/3918 | 257/18723 | 7.31e-05 | 1.17e-03 | 80 |
| GO:0071333 | Colorectum | AD | cellular response to glucose stimulus | 52/3918 | 151/18723 | 7.88e-05 | 1.25e-03 | 52 |
| GO:0042326 | Colorectum | AD | negative regulation of phosphorylation | 112/3918 | 385/18723 | 8.02e-05 | 1.27e-03 | 112 |
| Page: 1 2 3 4 5 6 7 8 9 10 11 12 |
| Pathway ID | Tissue | Disease Stage | Description | Gene Ratio | Bg Ratio | pvalue | p.adjust | qvalue | Count |
| hsa04213 | Colorectum | AD | Longevity regulating pathway - multiple species | 27/2092 | 62/8465 | 8.72e-04 | 5.96e-03 | 3.80e-03 | 27 |
| hsa042131 | Colorectum | AD | Longevity regulating pathway - multiple species | 27/2092 | 62/8465 | 8.72e-04 | 5.96e-03 | 3.80e-03 | 27 |
| hsa042132 | Colorectum | SER | Longevity regulating pathway - multiple species | 20/1580 | 62/8465 | 7.15e-03 | 3.77e-02 | 2.74e-02 | 20 |
| hsa042133 | Colorectum | SER | Longevity regulating pathway - multiple species | 20/1580 | 62/8465 | 7.15e-03 | 3.77e-02 | 2.74e-02 | 20 |
| hsa042134 | Colorectum | MSS | Longevity regulating pathway - multiple species | 27/1875 | 62/8465 | 1.33e-04 | 1.17e-03 | 7.18e-04 | 27 |
| hsa042135 | Colorectum | MSS | Longevity regulating pathway - multiple species | 27/1875 | 62/8465 | 1.33e-04 | 1.17e-03 | 7.18e-04 | 27 |
| hsa042138 | Liver | HCC | Longevity regulating pathway - multiple species | 41/4020 | 62/8465 | 2.30e-03 | 7.86e-03 | 4.37e-03 | 41 |
| hsa0421311 | Liver | HCC | Longevity regulating pathway - multiple species | 41/4020 | 62/8465 | 2.30e-03 | 7.86e-03 | 4.37e-03 | 41 |
| Page: 1 |
Top |
Cell-cell communication analysis |
| Identification of potential cell-cell interactions between two cell types and their ligand-receptor pairs for different disease states |
| Ligand | Receptor | LRpair | Pathway | Tissue | Disease Stage |
| Page: 1 |
Top |
Single-cell gene regulatory network inference analysis |
| Find out the significant the regulons (TFs) and the target genes of each regulon across cell types for different disease states |
| TF | Cell Type | Tissue | Disease Stage | Target Gene | RSS | Regulon Activity |
| FOXA2 | COL | Cervix | N_HPV | IGFL1,KATNA1,IL19, etc. | 4.19e-01 |  |
| FOXA2 | IMGOB | Colorectum | AD | ELAPOR1,RAB15,ST6GALNAC1, etc. | 1.90e-01 |  |
| FOXA2 | GOB | Colorectum | AD | ELAPOR1,RAB15,ST6GALNAC1, etc. | 2.15e-01 | |
| FOXA2 | GOB | Colorectum | ADJ | FOXA2(+) | 2.71e-01 |  |
| FOXA2 | IMGOB | Colorectum | ADJ | FOXA2(+) | 1.39e-01 | |
| FOXA2 | IMGOB | Colorectum | MSI-H | ELAPOR1,RAB15,ST6GALNAC1, etc. | 2.32e-01 |  |
| FOXA2 | IMGOB | Colorectum | MSS | ELAPOR1,RAB15,ST6GALNAC1, etc. | 5.88e-02 |  |
| FOXA2 | IMGOB | Colorectum | SER | ELAPOR1,RAB15,ST6GALNAC1, etc. | 5.77e-02 |  |
| FOXA2 | TUF | Colorectum | SER | ELAPOR1,RAB15,ST6GALNAC1, etc. | 4.51e-02 | |
| FOXA2 | DUCT1 | Pancreas | PanIN | LINC00261,SNORD3A,RCAN1, etc. | 2.90e-01 |  |
| ∗The dot plots of a searched regulon are shown for all cell subpopulations in each disease state of each tissue based on the regulon specific score inferred using pySCENIC and by calculating the average expression. |
| Page: 1 |
Top |
Somatic mutation of malignant transformation related genes |
| Annotation of somatic variants for genes involved in malignant transformation |
| Hugo Symbol | Variant Class | Variant Classification | dbSNP RS | HGVSc | HGVSp | HGVSp Short | SWISSPROT | BIOTYPE | SIFT | PolyPhen | Tumor Sample Barcode | Tissue | Histology | Sex | Age | Stage | Therapy Types | Drugs | Outcome |
| FOXA2 | SNV | Missense_Mutation | novel | c.640C>T | p.Arg214Cys | p.R214C | Q9Y261 | protein_coding | deleterious(0) | probably_damaging(1) | TCGA-AC-A8OQ-01 | Breast | breast invasive carcinoma | Female | >=65 | I/II | Unknown | Unknown | SD |
| FOXA2 | SNV | Missense_Mutation | novel | c.58N>A | p.Asp20Asn | p.D20N | Q9Y261 | protein_coding | deleterious(0) | probably_damaging(0.944) | TCGA-E2-A152-01 | Breast | breast invasive carcinoma | Female | <65 | I/II | Targeted Molecular therapy | trastuzumab | PD |
| FOXA2 | SNV | Missense_Mutation | novel | c.555G>C | p.Met185Ile | p.M185I | Q9Y261 | protein_coding | deleterious(0) | possibly_damaging(0.796) | TCGA-OL-A66O-01 | Breast | breast invasive carcinoma | Female | <65 | I/II | Chemotherapy | cytoxan | CR |
| FOXA2 | deletion | Frame_Shift_Del | c.1278_1318delNNNNNNNNNNNNNNNNNNNNNNNNNNNNNNNNNNNNNNNNN | p.Ser427ArgfsTer43 | p.S427Rfs*43 | Q9Y261 | protein_coding | TCGA-AN-A0XU-01 | Breast | breast invasive carcinoma | Female | <65 | I/II | Unknown | Unknown | SD | |||
| FOXA2 | SNV | Missense_Mutation | novel | c.1285N>A | p.Ala429Thr | p.A429T | Q9Y261 | protein_coding | tolerated(0.14) | benign(0.393) | TCGA-2W-A8YY-01 | Cervix | cervical & endocervical cancer | Female | <65 | I/II | Chemotherapy | cisplatin | CR |
| FOXA2 | SNV | Missense_Mutation | c.1169C>T | p.Ser390Leu | p.S390L | Q9Y261 | protein_coding | deleterious(0.02) | probably_damaging(0.997) | TCGA-DG-A2KK-01 | Cervix | cervical & endocervical cancer | Female | <65 | III/IV | Chemotherapy | cisplatin | SD | |
| FOXA2 | SNV | Missense_Mutation | novel | c.336N>C | p.Leu112Phe | p.L112F | Q9Y261 | protein_coding | deleterious(0) | probably_damaging(0.993) | TCGA-JW-A5VL-01 | Cervix | cervical & endocervical cancer | Female | <65 | I/II | Unknown | Unknown | SD |
| FOXA2 | SNV | Missense_Mutation | novel | c.1152N>G | p.Ile384Met | p.I384M | Q9Y261 | protein_coding | deleterious(0) | probably_damaging(0.998) | TCGA-VS-A94X-01 | Cervix | cervical & endocervical cancer | Female | <65 | I/II | Chemotherapy | cisplatin | PD |
| FOXA2 | SNV | Missense_Mutation | novel | c.8N>T | p.Ser3Leu | p.S3L | Q9Y261 | protein_coding | deleterious_low_confidence(0.01) | benign(0.281) | TCGA-VS-A94Y-01 | Cervix | cervical & endocervical cancer | Female | <65 | I/II | Chemotherapy | cisplatin | PD |
| FOXA2 | SNV | Missense_Mutation | novel | c.1301N>T | p.Thr434Met | p.T434M | Q9Y261 | protein_coding | deleterious(0.04) | probably_damaging(0.947) | TCGA-VS-A94Z-01 | Cervix | cervical & endocervical cancer | Female | <65 | I/II | Chemotherapy | cisplatin | CR |
| Page: 1 2 3 4 5 6 7 |
Top |
Related drugs of malignant transformation related genes |
| Identification of chemicals and drugs interact with genes involved in malignant transfromation |
| (DGIdb 4.0) |
| Entrez ID | Symbol | Category | Interaction Types | Drug Claim Name | Drug Name | PMIDs |
| Page: 1 |

Copyright 2023-Present -The University of Texas Health Science Center at Houston |