
|
|||||
|
 | |
| |
| |
| |
| |
| |
|
Gene: EIF4EBP1 |
Gene summary for EIF4EBP1 |
| Gene information | Species | Human | Gene symbol | EIF4EBP1 | Gene ID | 1978 |
| Gene name | eukaryotic translation initiation factor 4E binding protein 1 | |
| Gene Alias | 4E-BP1 | |
| Cytomap | 8p11.23 | |
| Gene Type | protein-coding | GO ID | GO:0000082 | UniProtAcc | Q13541 |
Top |
Malignant transformation analysis |
| Identification of the aberrant gene expression in precancerous and cancerous lesions by comparing the gene expression of stem-like cells in diseased tissues with normal stem cells |
| Entrez ID | Symbol | Replicates | Species | Organ | Tissue | Adj P-value | Log2FC | Malignancy |
| 1978 | EIF4EBP1 | GSM4909282 | Human | Breast | IDC | 4.46e-09 | 3.78e-01 | -0.0288 |
| 1978 | EIF4EBP1 | GSM4909285 | Human | Breast | IDC | 1.05e-04 | -3.14e-01 | 0.21 |
| 1978 | EIF4EBP1 | GSM4909286 | Human | Breast | IDC | 3.55e-04 | -2.78e-01 | 0.1081 |
| 1978 | EIF4EBP1 | GSM4909291 | Human | Breast | IDC | 6.05e-14 | 5.86e-01 | 0.1753 |
| 1978 | EIF4EBP1 | GSM4909293 | Human | Breast | IDC | 9.60e-12 | -4.68e-01 | 0.1581 |
| 1978 | EIF4EBP1 | GSM4909294 | Human | Breast | IDC | 3.42e-06 | -3.02e-01 | 0.2022 |
| 1978 | EIF4EBP1 | GSM4909296 | Human | Breast | IDC | 1.31e-02 | -1.15e-01 | 0.1524 |
| 1978 | EIF4EBP1 | GSM4909297 | Human | Breast | IDC | 2.45e-11 | -6.27e-02 | 0.1517 |
| 1978 | EIF4EBP1 | GSM4909298 | Human | Breast | IDC | 6.44e-10 | -4.28e-01 | 0.1551 |
| 1978 | EIF4EBP1 | GSM4909299 | Human | Breast | IDC | 4.14e-04 | -3.95e-01 | 0.035 |
| 1978 | EIF4EBP1 | GSM4909301 | Human | Breast | IDC | 5.75e-03 | -3.41e-01 | 0.1577 |
| 1978 | EIF4EBP1 | GSM4909303 | Human | Breast | IDC | 1.39e-05 | -5.72e-01 | 0.0438 |
| 1978 | EIF4EBP1 | GSM4909311 | Human | Breast | IDC | 4.07e-24 | -4.74e-01 | 0.1534 |
| 1978 | EIF4EBP1 | GSM4909312 | Human | Breast | IDC | 3.75e-09 | -3.83e-01 | 0.1552 |
| 1978 | EIF4EBP1 | GSM4909313 | Human | Breast | IDC | 1.04e-06 | -4.26e-01 | 0.0391 |
| 1978 | EIF4EBP1 | GSM4909317 | Human | Breast | IDC | 2.32e-04 | 3.70e-01 | 0.1355 |
| 1978 | EIF4EBP1 | GSM4909318 | Human | Breast | IDC | 1.05e-05 | 4.85e-01 | 0.2031 |
| 1978 | EIF4EBP1 | GSM4909319 | Human | Breast | IDC | 8.23e-35 | -4.52e-01 | 0.1563 |
| 1978 | EIF4EBP1 | GSM4909321 | Human | Breast | IDC | 4.03e-10 | -2.88e-01 | 0.1559 |
| 1978 | EIF4EBP1 | brca1 | Human | Breast | Precancer | 2.00e-10 | 4.18e-01 | -0.0338 |
| Page: 1 2 3 4 5 6 7 8 |
| Tissue | Expression Dynamics | Abbreviation |
| Breast |  | IDC: Invasive ductal carcinoma |
| DCIS: Ductal carcinoma in situ | ||
| Precancer(BRCA1-mut): Precancerous lesion from BRCA1 mutation carriers | ||
| Cervix | 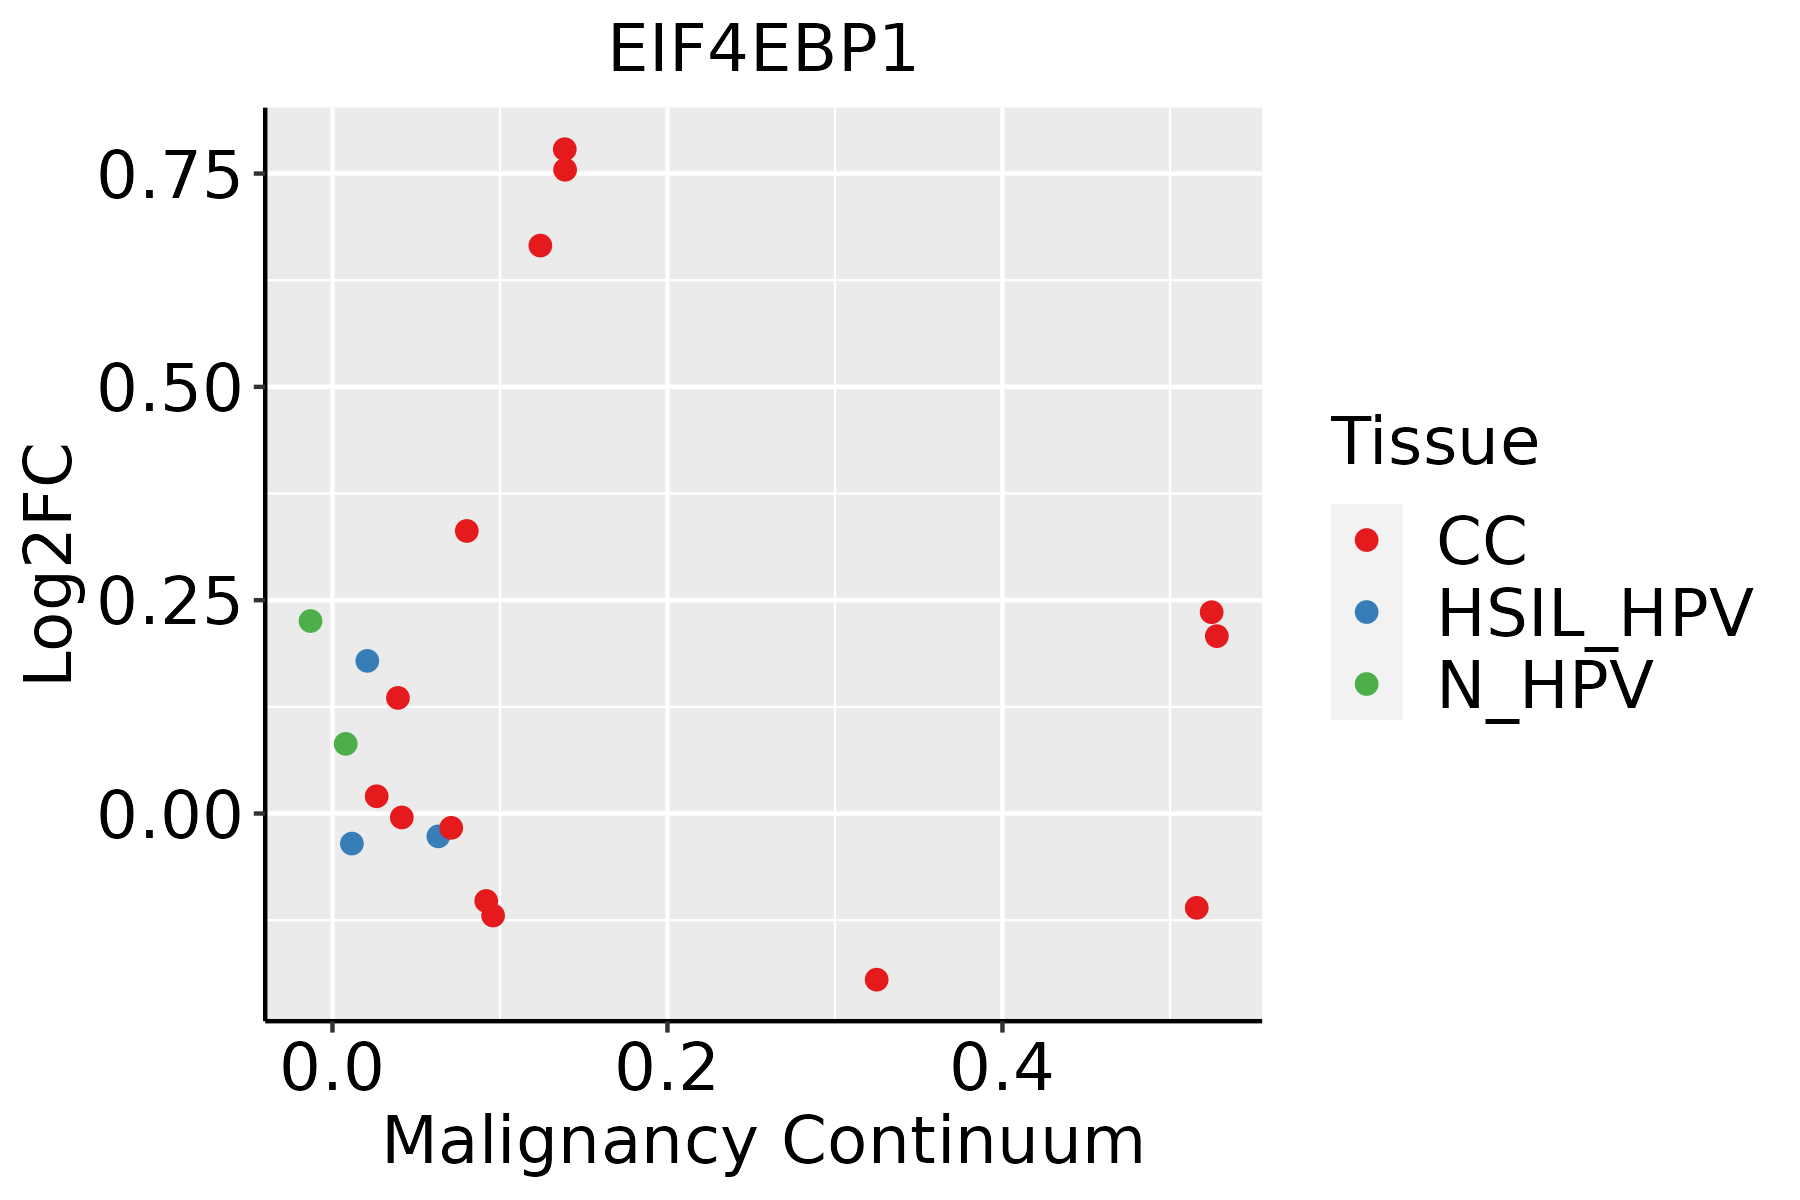 | CC: Cervix cancer |
| HSIL_HPV: HPV-infected high-grade squamous intraepithelial lesions | ||
| N_HPV: HPV-infected normal cervix | ||
| Esophagus |  | ESCC: Esophageal squamous cell carcinoma |
| HGIN: High-grade intraepithelial neoplasias | ||
| LGIN: Low-grade intraepithelial neoplasias | ||
| Liver | 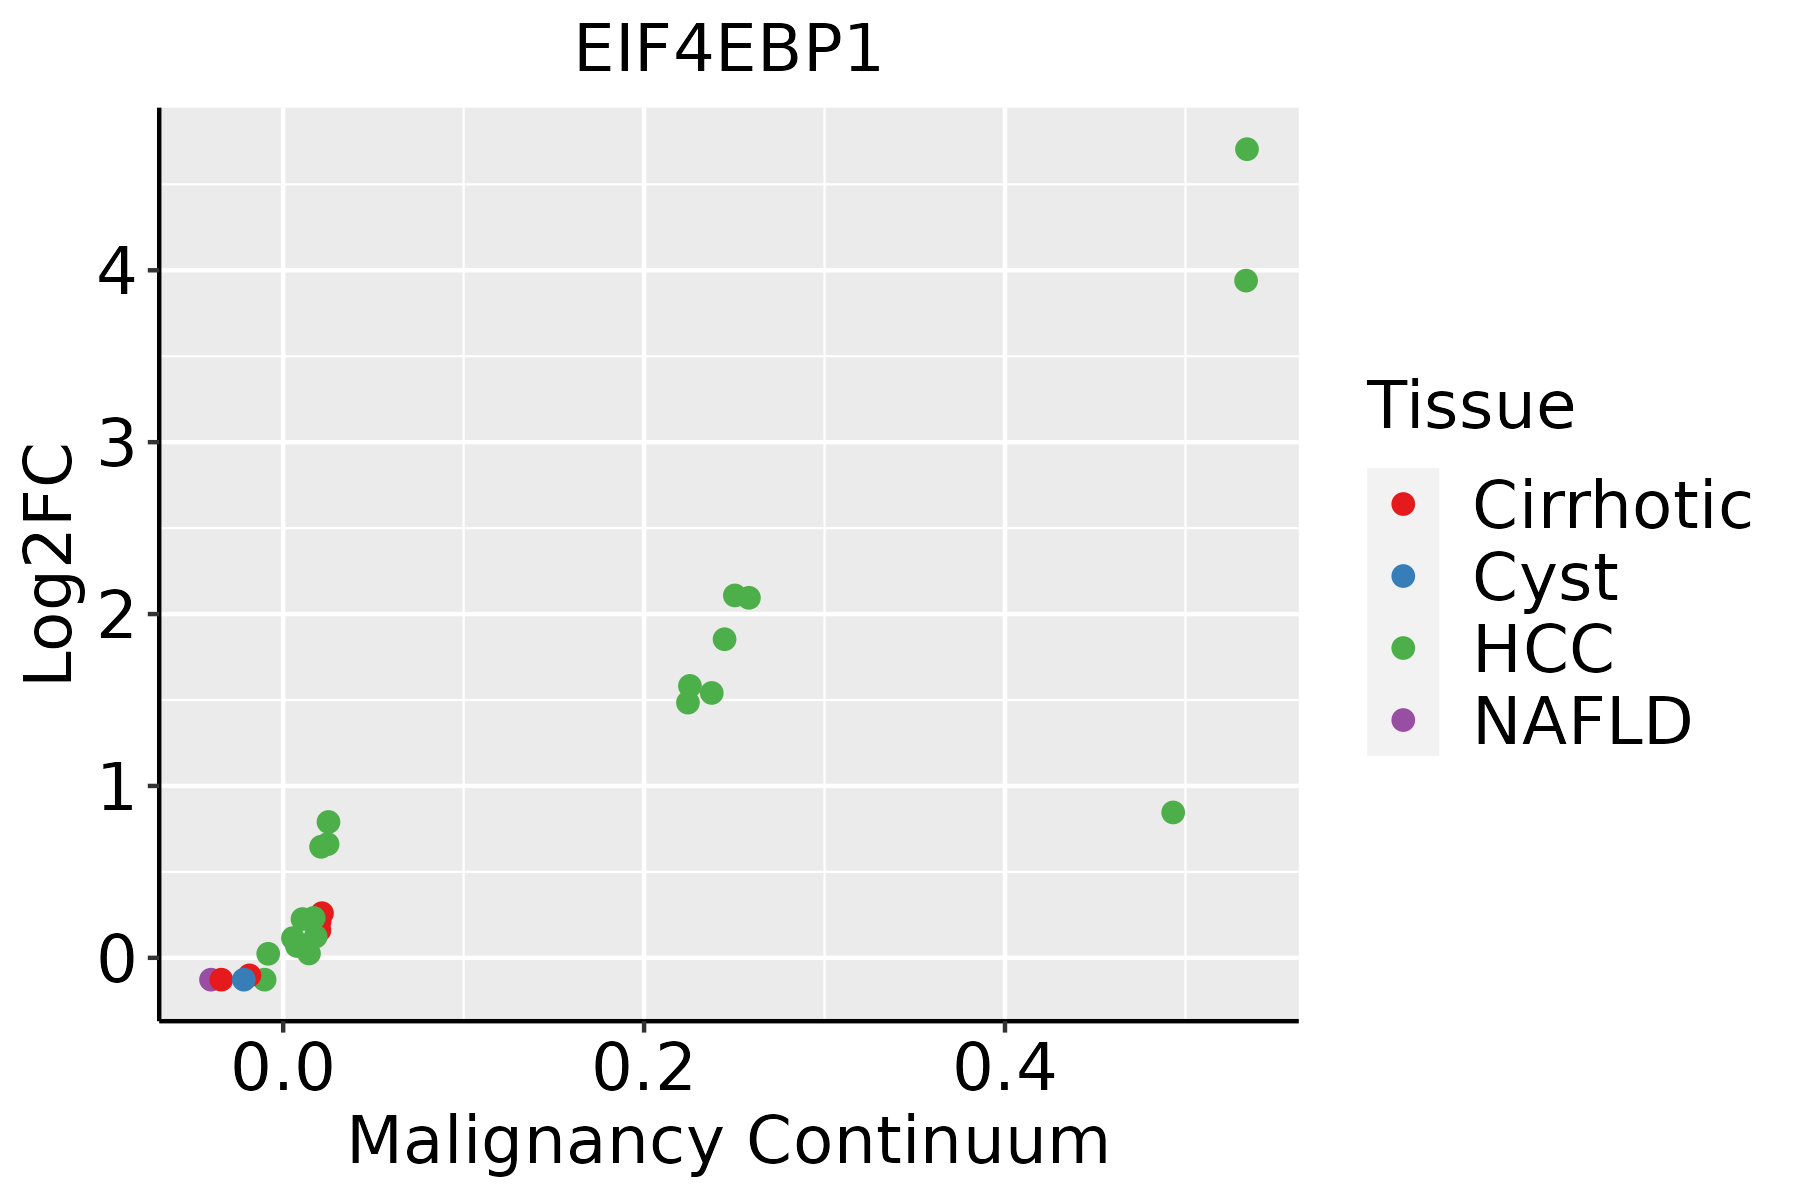 | HCC: Hepatocellular carcinoma |
| NAFLD: Non-alcoholic fatty liver disease | ||
| Oral Cavity | 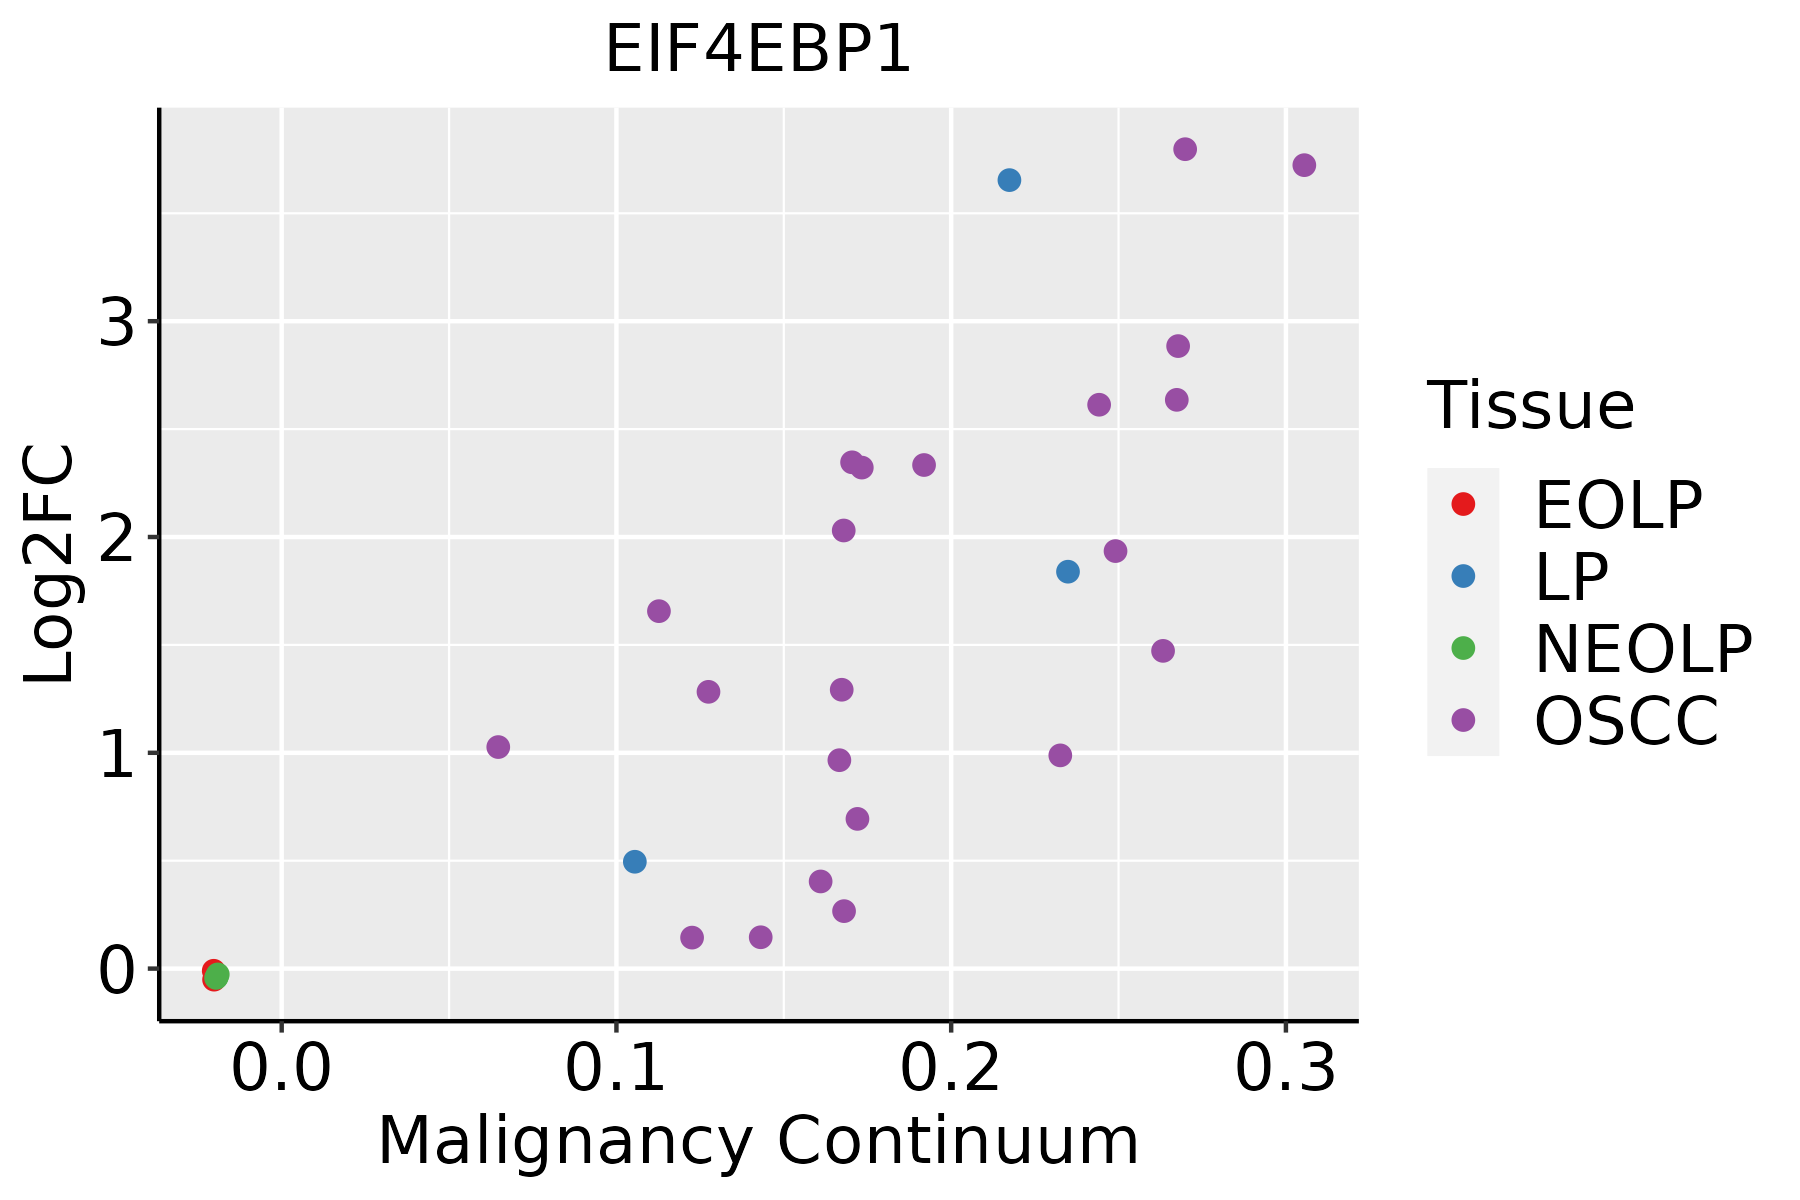 | EOLP: Erosive Oral lichen planus |
| LP: leukoplakia | ||
| NEOLP: Non-erosive oral lichen planus | ||
| OSCC: Oral squamous cell carcinoma | ||
| Skin | 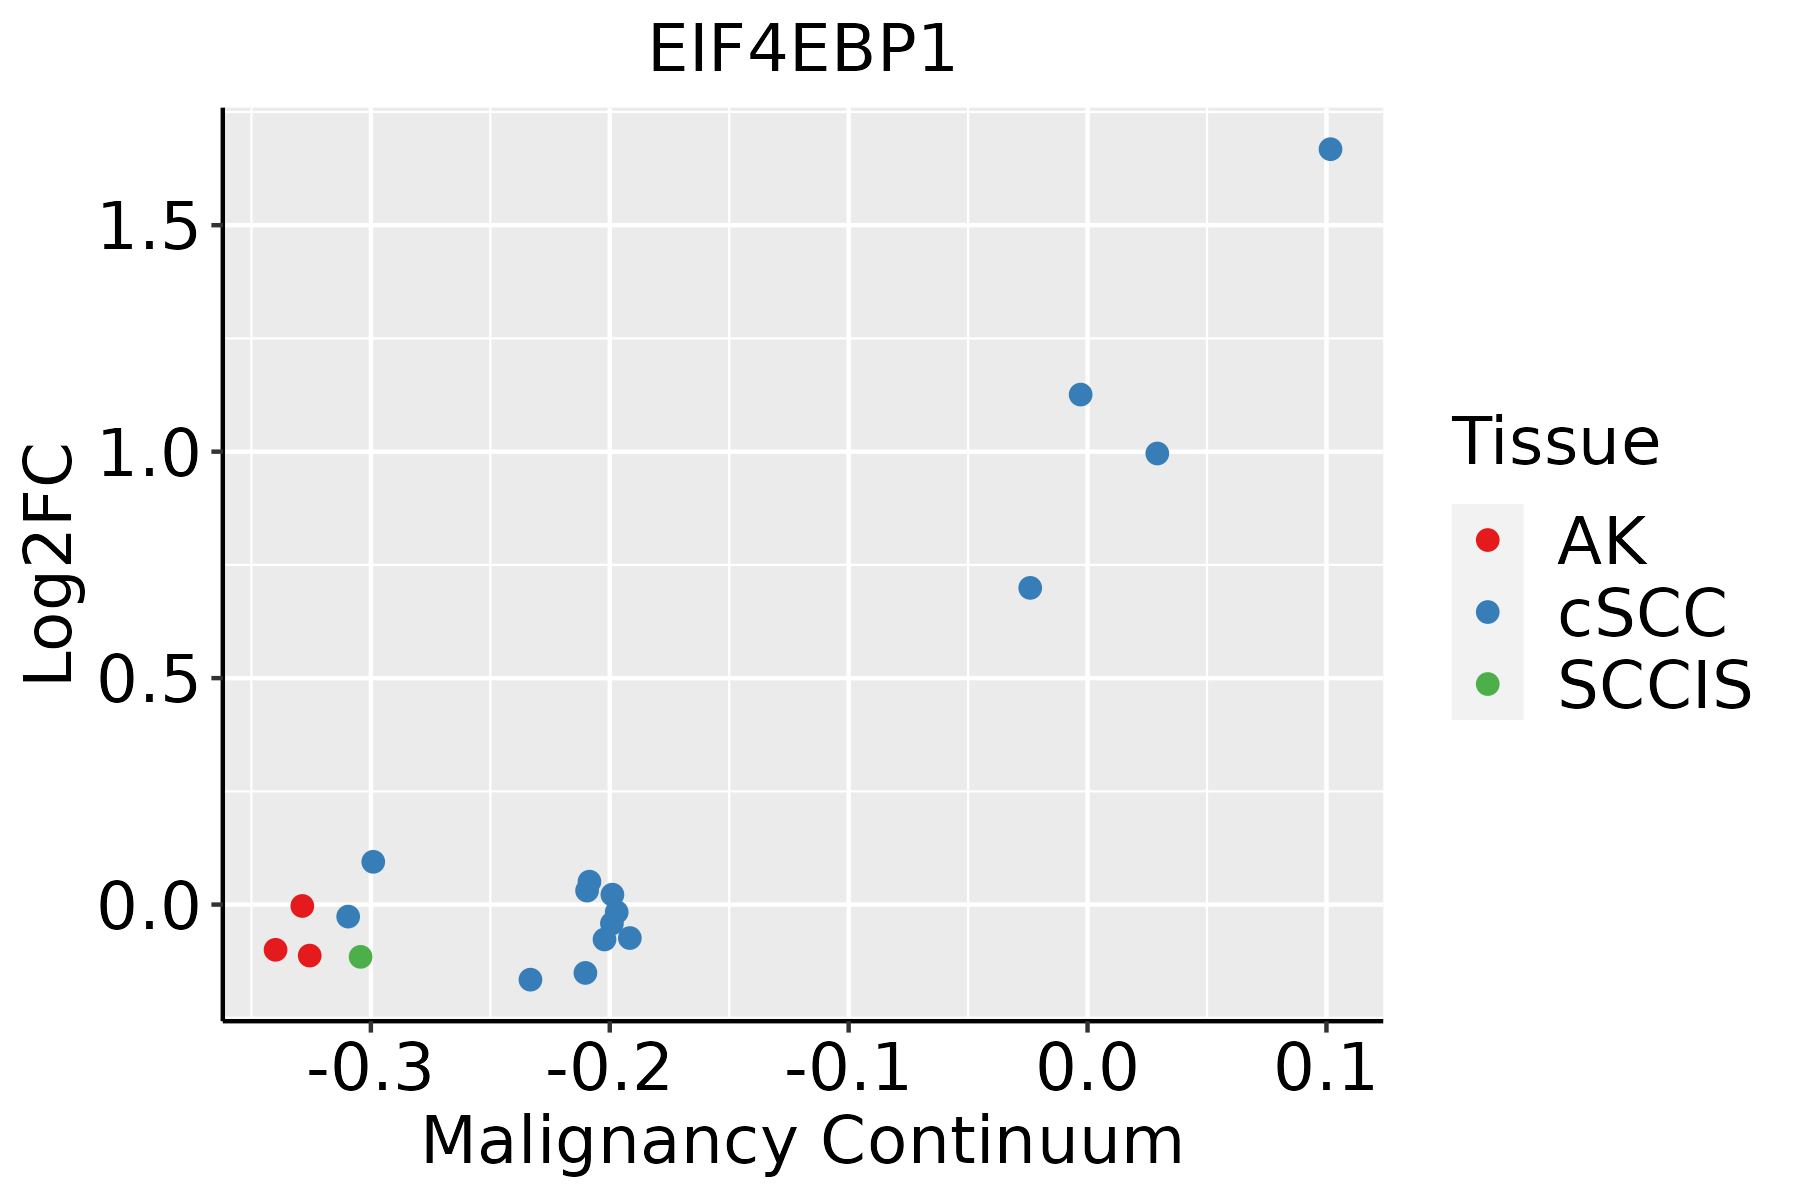 | AK: Actinic keratosis |
| cSCC: Cutaneous squamous cell carcinoma | ||
| SCCIS:squamous cell carcinoma in situ | ||
| Thyroid |  | ATC: Anaplastic thyroid cancer |
| HT: Hashimoto's thyroiditis | ||
| PTC: Papillary thyroid cancer |
| ∗log2FC in expression of this searched gene in stem-like cells from each diseased tissue sample relative to stem-like cells in normal samples in each tissue plotted against the malignancy continuum. Samples are colored based on if they are from different disease stage. |
Top |
Malignant transformation related pathway analysis |
| Find out the enriched GO biological processes and KEGG pathways involved in transition from healthy to precancer to cancer |
| Tissue | Disease Stage | Enriched GO biological Processes |
| Breast | Precancer |  |
| Breast | IDC |  |
| Breast | DCIS |  |
| Cervix | CC |  |
| Cervix | HSIL_HPV |  |
| ∗Top 15 enriched GO BP terms are showed in the bar plot of each disease state in each tissue. Each row represents a significant GO biological process which is colored according to the -log10(p.adjust). |
| Page: 1 2 3 4 5 6 7 8 9 |
| GO ID | Tissue | Disease Stage | Description | Gene Ratio | Bg Ratio | pvalue | p.adjust | Count |
| GO:00064138 | Breast | Precancer | translational initiation | 30/1080 | 118/18723 | 3.23e-12 | 5.58e-10 | 30 |
| GO:00362939 | Breast | Precancer | response to decreased oxygen levels | 53/1080 | 322/18723 | 4.09e-12 | 6.84e-10 | 53 |
| GO:00064179 | Breast | Precancer | regulation of translation | 67/1080 | 468/18723 | 4.71e-12 | 7.64e-10 | 67 |
| GO:00016669 | Breast | Precancer | response to hypoxia | 51/1080 | 307/18723 | 7.33e-12 | 1.11e-09 | 51 |
| GO:00704829 | Breast | Precancer | response to oxygen levels | 55/1080 | 347/18723 | 7.47e-12 | 1.11e-09 | 55 |
| GO:00362948 | Breast | Precancer | cellular response to decreased oxygen levels | 31/1080 | 161/18723 | 2.61e-09 | 2.11e-07 | 31 |
| GO:00714538 | Breast | Precancer | cellular response to oxygen levels | 32/1080 | 177/18723 | 7.32e-09 | 5.52e-07 | 32 |
| GO:00714565 | Breast | Precancer | cellular response to hypoxia | 29/1080 | 151/18723 | 8.98e-09 | 6.50e-07 | 29 |
| GO:00064466 | Breast | Precancer | regulation of translational initiation | 19/1080 | 79/18723 | 7.99e-08 | 4.60e-06 | 19 |
| GO:00432549 | Breast | Precancer | regulation of protein-containing complex assembly | 50/1080 | 428/18723 | 1.63e-06 | 5.97e-05 | 50 |
| GO:0002931 | Breast | Precancer | response to ischemia | 12/1080 | 58/18723 | 9.65e-05 | 1.80e-03 | 12 |
| GO:00316679 | Breast | Precancer | response to nutrient levels | 47/1080 | 474/18723 | 2.09e-04 | 3.27e-03 | 47 |
| GO:00313338 | Breast | Precancer | negative regulation of protein-containing complex assembly | 18/1080 | 141/18723 | 1.27e-03 | 1.35e-02 | 18 |
| GO:00425947 | Breast | Precancer | response to starvation | 22/1080 | 197/18723 | 2.30e-03 | 2.15e-02 | 22 |
| GO:00973058 | Breast | Precancer | response to alcohol | 25/1080 | 253/18723 | 6.16e-03 | 4.35e-02 | 25 |
| GO:007048214 | Breast | IDC | response to oxygen levels | 64/1434 | 347/18723 | 3.45e-11 | 5.57e-09 | 64 |
| GO:003629314 | Breast | IDC | response to decreased oxygen levels | 60/1434 | 322/18723 | 9.26e-11 | 1.25e-08 | 60 |
| GO:000166614 | Breast | IDC | response to hypoxia | 58/1434 | 307/18723 | 1.09e-10 | 1.38e-08 | 58 |
| GO:000641313 | Breast | IDC | translational initiation | 31/1434 | 118/18723 | 7.29e-10 | 7.52e-08 | 31 |
| GO:000641714 | Breast | IDC | regulation of translation | 74/1434 | 468/18723 | 1.67e-09 | 1.53e-07 | 74 |
| Page: 1 2 3 4 5 6 7 8 9 10 11 12 13 14 15 16 17 |
| Pathway ID | Tissue | Disease Stage | Description | Gene Ratio | Bg Ratio | pvalue | p.adjust | qvalue | Count |
| hsa0406616 | Breast | Precancer | HIF-1 signaling pathway | 23/684 | 109/8465 | 1.51e-05 | 1.59e-04 | 1.22e-04 | 23 |
| hsa042189 | Breast | Precancer | Cellular senescence | 29/684 | 156/8465 | 1.66e-05 | 1.69e-04 | 1.30e-04 | 29 |
| hsa0516316 | Breast | Precancer | Human cytomegalovirus infection | 32/684 | 225/8465 | 1.13e-03 | 7.57e-03 | 5.80e-03 | 32 |
| hsa0406617 | Breast | Precancer | HIF-1 signaling pathway | 23/684 | 109/8465 | 1.51e-05 | 1.59e-04 | 1.22e-04 | 23 |
| hsa0421814 | Breast | Precancer | Cellular senescence | 29/684 | 156/8465 | 1.66e-05 | 1.69e-04 | 1.30e-04 | 29 |
| hsa0516317 | Breast | Precancer | Human cytomegalovirus infection | 32/684 | 225/8465 | 1.13e-03 | 7.57e-03 | 5.80e-03 | 32 |
| hsa0421824 | Breast | IDC | Cellular senescence | 35/867 | 156/8465 | 5.49e-06 | 7.43e-05 | 5.56e-05 | 35 |
| hsa0516324 | Breast | IDC | Human cytomegalovirus infection | 39/867 | 225/8465 | 6.66e-04 | 5.41e-03 | 4.05e-03 | 39 |
| hsa0406623 | Breast | IDC | HIF-1 signaling pathway | 22/867 | 109/8465 | 1.36e-03 | 1.00e-02 | 7.50e-03 | 22 |
| hsa0421834 | Breast | IDC | Cellular senescence | 35/867 | 156/8465 | 5.49e-06 | 7.43e-05 | 5.56e-05 | 35 |
| hsa0516334 | Breast | IDC | Human cytomegalovirus infection | 39/867 | 225/8465 | 6.66e-04 | 5.41e-03 | 4.05e-03 | 39 |
| hsa0406633 | Breast | IDC | HIF-1 signaling pathway | 22/867 | 109/8465 | 1.36e-03 | 1.00e-02 | 7.50e-03 | 22 |
| hsa0421844 | Breast | DCIS | Cellular senescence | 34/846 | 156/8465 | 8.53e-06 | 1.06e-04 | 7.80e-05 | 34 |
| hsa0516344 | Breast | DCIS | Human cytomegalovirus infection | 38/846 | 225/8465 | 8.11e-04 | 5.95e-03 | 4.38e-03 | 38 |
| hsa0406642 | Breast | DCIS | HIF-1 signaling pathway | 22/846 | 109/8465 | 9.83e-04 | 7.05e-03 | 5.20e-03 | 22 |
| hsa0421854 | Breast | DCIS | Cellular senescence | 34/846 | 156/8465 | 8.53e-06 | 1.06e-04 | 7.80e-05 | 34 |
| hsa0516354 | Breast | DCIS | Human cytomegalovirus infection | 38/846 | 225/8465 | 8.11e-04 | 5.95e-03 | 4.38e-03 | 38 |
| hsa0406652 | Breast | DCIS | HIF-1 signaling pathway | 22/846 | 109/8465 | 9.83e-04 | 7.05e-03 | 5.20e-03 | 22 |
| hsa0516318 | Cervix | CC | Human cytomegalovirus infection | 65/1267 | 225/8465 | 4.59e-08 | 6.47e-07 | 3.83e-07 | 65 |
| hsa0421810 | Cervix | CC | Cellular senescence | 49/1267 | 156/8465 | 1.30e-07 | 1.63e-06 | 9.61e-07 | 49 |
| Page: 1 2 3 4 5 6 7 |
Top |
Cell-cell communication analysis |
| Identification of potential cell-cell interactions between two cell types and their ligand-receptor pairs for different disease states |
| Ligand | Receptor | LRpair | Pathway | Tissue | Disease Stage |
| Page: 1 |
Top |
Single-cell gene regulatory network inference analysis |
| Find out the significant the regulons (TFs) and the target genes of each regulon across cell types for different disease states |
| TF | Cell Type | Tissue | Disease Stage | Target Gene | RSS | Regulon Activity |
| ∗The dot plots of a searched regulon are shown for all cell subpopulations in each disease state of each tissue based on the regulon specific score inferred using pySCENIC and by calculating the average expression. |
| Page: 1 |
Top |
Somatic mutation of malignant transformation related genes |
| Annotation of somatic variants for genes involved in malignant transformation |
| Hugo Symbol | Variant Class | Variant Classification | dbSNP RS | HGVSc | HGVSp | HGVSp Short | SWISSPROT | BIOTYPE | SIFT | PolyPhen | Tumor Sample Barcode | Tissue | Histology | Sex | Age | Stage | Therapy Types | Drugs | Outcome |
| EIF4EBP1 | SNV | Missense_Mutation | novel | c.223C>A | p.Leu75Met | p.L75M | Q13541 | protein_coding | tolerated(0.07) | probably_damaging(0.999) | TCGA-EO-A3B0-01 | Endometrium | uterine corpus endometrioid carcinoma | Female | <65 | III/IV | Unknown | Unknown | SD |
| Page: 1 |
Top |
Related drugs of malignant transformation related genes |
| Identification of chemicals and drugs interact with genes involved in malignant transfromation |
| (DGIdb 4.0) |
| Entrez ID | Symbol | Category | Interaction Types | Drug Claim Name | Drug Name | PMIDs |
| 1978 | EIF4EBP1 | KINASE | PACLITAXEL | PACLITAXEL | 15897904 |
| Page: 1 |

Copyright 2023-Present -The University of Texas Health Science Center at Houston |