
|
|||||
|
 | |
| |
| |
| |
| |
| |
|
Gene: CLDND2 |
Gene summary for CLDND2 |
| Gene information | Species | Human | Gene symbol | CLDND2 | Gene ID | 125875 |
| Gene name | claudin domain containing 2 | |
| Gene Alias | CLDND2 | |
| Cytomap | 19q13.41 | |
| Gene Type | protein-coding | GO ID | GO:0005575 | UniProtAcc | Q8NHS1 |
Top |
Malignant transformation analysis |
| Identification of the aberrant gene expression in precancerous and cancerous lesions by comparing the gene expression of stem-like cells in diseased tissues with normal stem cells |
| Entrez ID | Symbol | Replicates | Species | Organ | Tissue | Adj P-value | Log2FC | Malignancy |
| 125875 | CLDND2 | HCC1_Meng | Human | Liver | HCC | 2.06e-34 | 2.55e-02 | 0.0246 |
| 125875 | CLDND2 | cirrhotic1 | Human | Liver | Cirrhotic | 1.47e-03 | 6.16e-02 | 0.0202 |
| 125875 | CLDND2 | S027 | Human | Liver | HCC | 1.36e-03 | 5.31e-01 | 0.2446 |
| 125875 | CLDND2 | S028 | Human | Liver | HCC | 3.91e-02 | 2.69e-01 | 0.2503 |
| 125875 | CLDND2 | S029 | Human | Liver | HCC | 1.10e-09 | 5.34e-01 | 0.2581 |
| Page: 1 |
| Tissue | Expression Dynamics | Abbreviation |
| Liver | 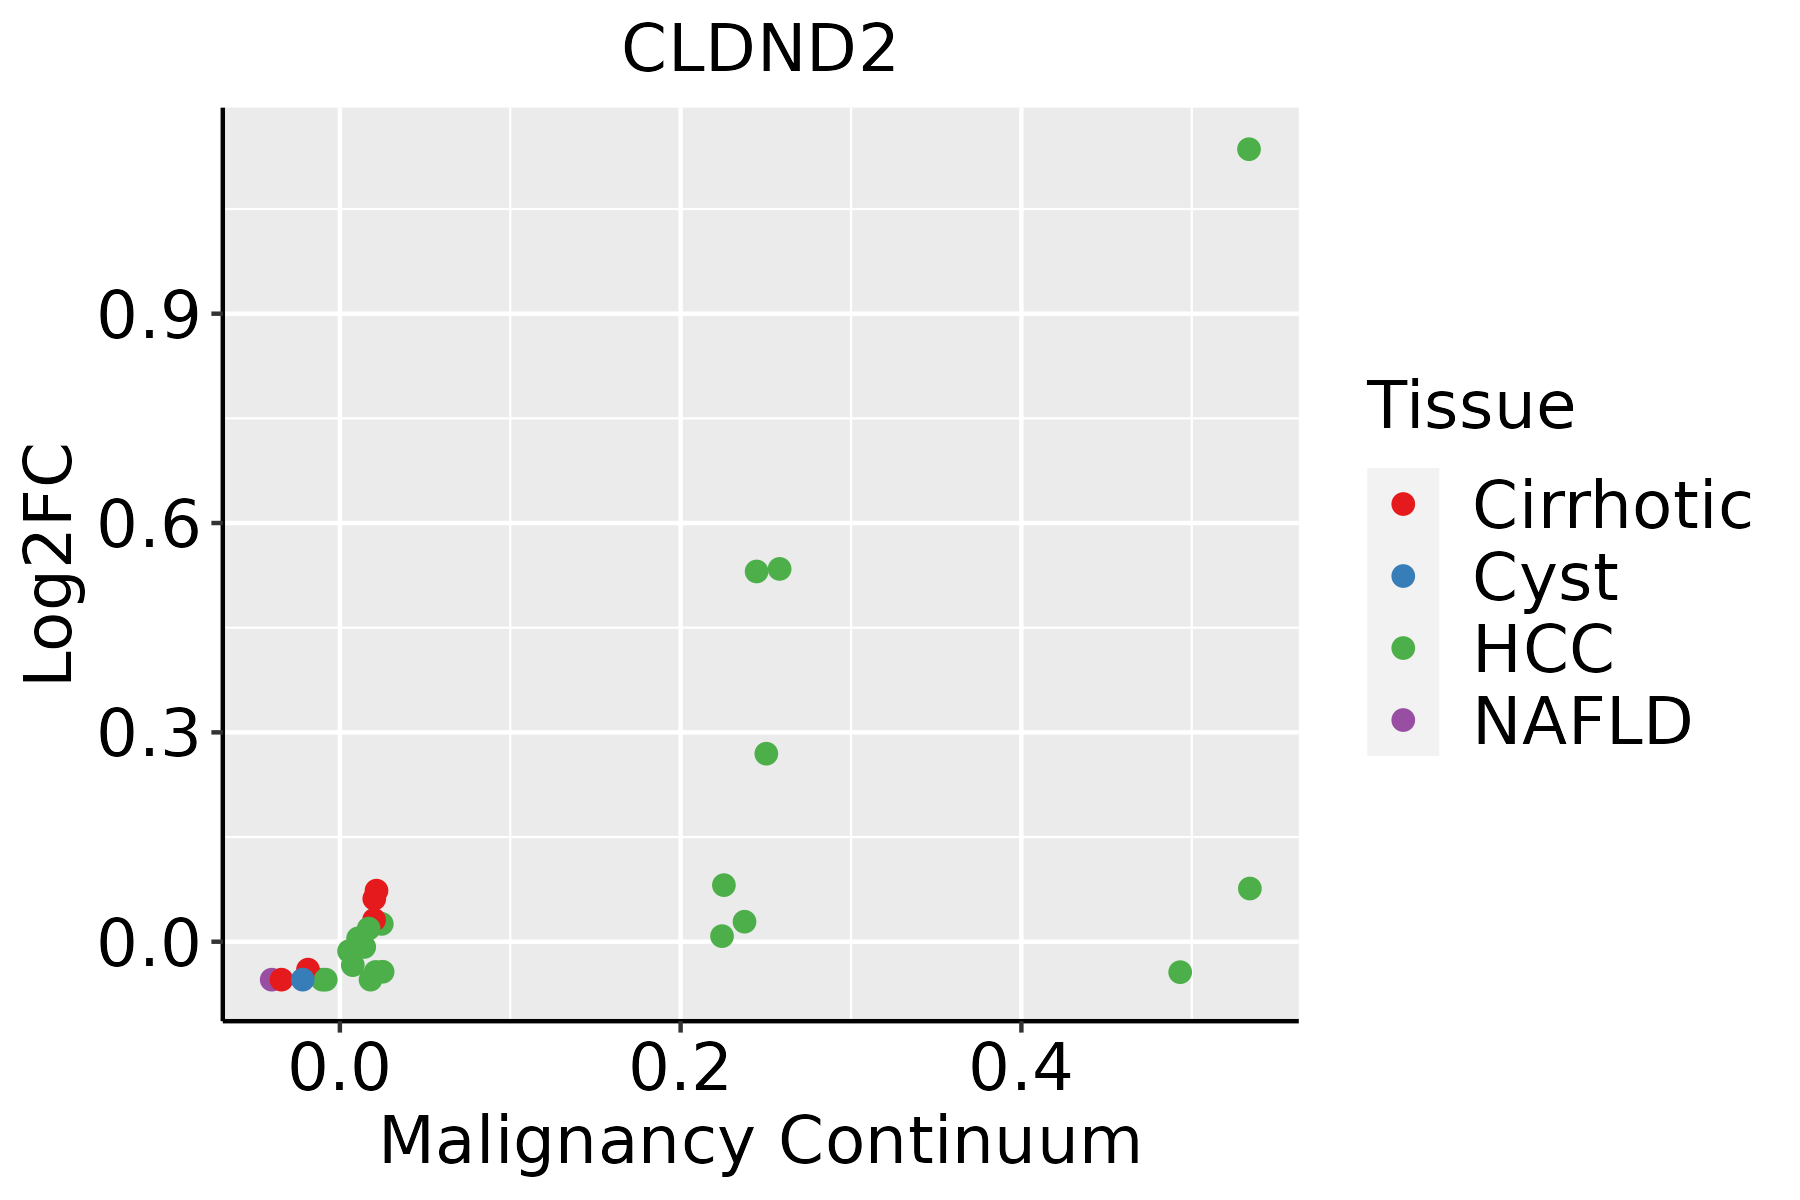 | HCC: Hepatocellular carcinoma |
| NAFLD: Non-alcoholic fatty liver disease |
| ∗log2FC in expression of this searched gene in stem-like cells from each diseased tissue sample relative to stem-like cells in normal samples in each tissue plotted against the malignancy continuum. Samples are colored based on if they are from different disease stage. |
Top |
Malignant transformation related pathway analysis |
| Find out the enriched GO biological processes and KEGG pathways involved in transition from healthy to precancer to cancer |
| Tissue | Disease Stage | Enriched GO biological Processes |
| Breast | Precancer |  |
| Breast | IDC |  |
| Breast | DCIS |  |
| Cervix | CC |  |
| Cervix | HSIL_HPV |  |
| ∗Top 15 enriched GO BP terms are showed in the bar plot of each disease state in each tissue. Each row represents a significant GO biological process which is colored according to the -log10(p.adjust). |
| Page: 1 2 3 4 5 6 7 8 9 |
| GO ID | Tissue | Disease Stage | Description | Gene Ratio | Bg Ratio | pvalue | p.adjust | Count |
| Page: 1 |
| Pathway ID | Tissue | Disease Stage | Description | Gene Ratio | Bg Ratio | pvalue | p.adjust | qvalue | Count |
| Page: 1 |
Top |
Cell-cell communication analysis |
| Identification of potential cell-cell interactions between two cell types and their ligand-receptor pairs for different disease states |
| Ligand | Receptor | LRpair | Pathway | Tissue | Disease Stage |
| Page: 1 |
Top |
Single-cell gene regulatory network inference analysis |
| Find out the significant the regulons (TFs) and the target genes of each regulon across cell types for different disease states |
| TF | Cell Type | Tissue | Disease Stage | Target Gene | RSS | Regulon Activity |
| ∗The dot plots of a searched regulon are shown for all cell subpopulations in each disease state of each tissue based on the regulon specific score inferred using pySCENIC and by calculating the average expression. |
| Page: 1 |
Top |
Somatic mutation of malignant transformation related genes |
| Annotation of somatic variants for genes involved in malignant transformation |
| Hugo Symbol | Variant Class | Variant Classification | dbSNP RS | HGVSc | HGVSp | HGVSp Short | SWISSPROT | BIOTYPE | SIFT | PolyPhen | Tumor Sample Barcode | Tissue | Histology | Sex | Age | Stage | Therapy Types | Drugs | Outcome |
| CLDND2 | SNV | Missense_Mutation | novel | c.5N>T | p.Gly2Val | p.G2V | Q8NHS1 | protein_coding | deleterious(0) | probably_damaging(0.998) | TCGA-MA-AA42-01 | Cervix | cervical & endocervical cancer | Female | >=65 | I/II | Unknown | Unknown | SD |
| CLDND2 | SNV | Missense_Mutation | rs199591571 | c.98N>A | p.Arg33His | p.R33H | Q8NHS1 | protein_coding | tolerated(0.1) | benign(0.005) | TCGA-AA-3877-01 | Colorectum | colon adenocarcinoma | Female | >=65 | I/II | Unknown | Unknown | SD |
| CLDND2 | SNV | Missense_Mutation | c.424C>A | p.Leu142Ile | p.L142I | Q8NHS1 | protein_coding | tolerated(0.13) | benign(0.066) | TCGA-AA-3977-01 | Colorectum | colon adenocarcinoma | Male | >=65 | I/II | Unknown | Unknown | SD | |
| CLDND2 | SNV | Missense_Mutation | novel | c.333G>C | p.Leu111Phe | p.L111F | Q8NHS1 | protein_coding | deleterious(0.03) | benign(0.017) | TCGA-56-A5DR-01 | Lung | lung squamous cell carcinoma | Male | >=65 | I/II | Unknown | Unknown | SD |
| Page: 1 |
Top |
Related drugs of malignant transformation related genes |
| Identification of chemicals and drugs interact with genes involved in malignant transfromation |
| (DGIdb 4.0) |
| Entrez ID | Symbol | Category | Interaction Types | Drug Claim Name | Drug Name | PMIDs |
| Page: 1 |

Copyright 2023-Present -The University of Texas Health Science Center at Houston |