
|
|||||
|
 | |
| |
| |
| |
| |
| |
|
Gene: CLDN4 |
Gene summary for CLDN4 |
| Gene information | Species | Human | Gene symbol | CLDN4 | Gene ID | 1364 |
| Gene name | claudin 4 | |
| Gene Alias | CPE-R | |
| Cytomap | 7q11.23 | |
| Gene Type | protein-coding | GO ID | GO:0000003 | UniProtAcc | O14493 |
Top |
Malignant transformation analysis |
| Identification of the aberrant gene expression in precancerous and cancerous lesions by comparing the gene expression of stem-like cells in diseased tissues with normal stem cells |
| Entrez ID | Symbol | Replicates | Species | Organ | Tissue | Adj P-value | Log2FC | Malignancy |
| 1364 | CLDN4 | GSM4909280 | Human | Breast | Precancer | 3.36e-04 | 3.43e-01 | 0.0305 |
| 1364 | CLDN4 | GSM4909281 | Human | Breast | IDC | 1.63e-14 | -4.12e-01 | 0.21 |
| 1364 | CLDN4 | GSM4909282 | Human | Breast | IDC | 2.01e-13 | 4.11e-01 | -0.0288 |
| 1364 | CLDN4 | GSM4909285 | Human | Breast | IDC | 5.90e-09 | -2.32e-01 | 0.21 |
| 1364 | CLDN4 | GSM4909286 | Human | Breast | IDC | 1.55e-23 | -5.52e-01 | 0.1081 |
| 1364 | CLDN4 | GSM4909288 | Human | Breast | IDC | 7.42e-03 | -4.43e-01 | 0.0988 |
| 1364 | CLDN4 | GSM4909290 | Human | Breast | IDC | 1.28e-20 | -7.92e-01 | 0.2096 |
| 1364 | CLDN4 | GSM4909294 | Human | Breast | IDC | 2.42e-17 | -5.94e-01 | 0.2022 |
| 1364 | CLDN4 | GSM4909297 | Human | Breast | IDC | 6.95e-14 | -4.57e-01 | 0.1517 |
| 1364 | CLDN4 | GSM4909298 | Human | Breast | IDC | 7.84e-08 | -3.63e-01 | 0.1551 |
| 1364 | CLDN4 | GSM4909300 | Human | Breast | IDC | 3.38e-07 | 4.00e-01 | 0.0334 |
| 1364 | CLDN4 | GSM4909302 | Human | Breast | IDC | 7.19e-06 | -4.40e-01 | 0.1545 |
| 1364 | CLDN4 | GSM4909304 | Human | Breast | IDC | 1.12e-14 | -4.36e-01 | 0.1636 |
| 1364 | CLDN4 | GSM4909305 | Human | Breast | IDC | 7.25e-07 | 3.33e-01 | 0.0436 |
| 1364 | CLDN4 | GSM4909307 | Human | Breast | IDC | 1.04e-06 | -4.16e-01 | 0.1569 |
| 1364 | CLDN4 | GSM4909308 | Human | Breast | IDC | 2.92e-19 | -5.81e-01 | 0.158 |
| 1364 | CLDN4 | GSM4909311 | Human | Breast | IDC | 6.44e-37 | -6.24e-01 | 0.1534 |
| 1364 | CLDN4 | GSM4909313 | Human | Breast | IDC | 6.80e-06 | 1.84e-01 | 0.0391 |
| 1364 | CLDN4 | GSM4909315 | Human | Breast | IDC | 2.60e-36 | -9.18e-01 | 0.21 |
| 1364 | CLDN4 | GSM4909316 | Human | Breast | IDC | 2.27e-15 | -1.02e+00 | 0.21 |
| Page: 1 2 3 4 5 6 7 8 9 10 11 12 13 14 15 16 17 |
| Tissue | Expression Dynamics | Abbreviation |
| Breast | 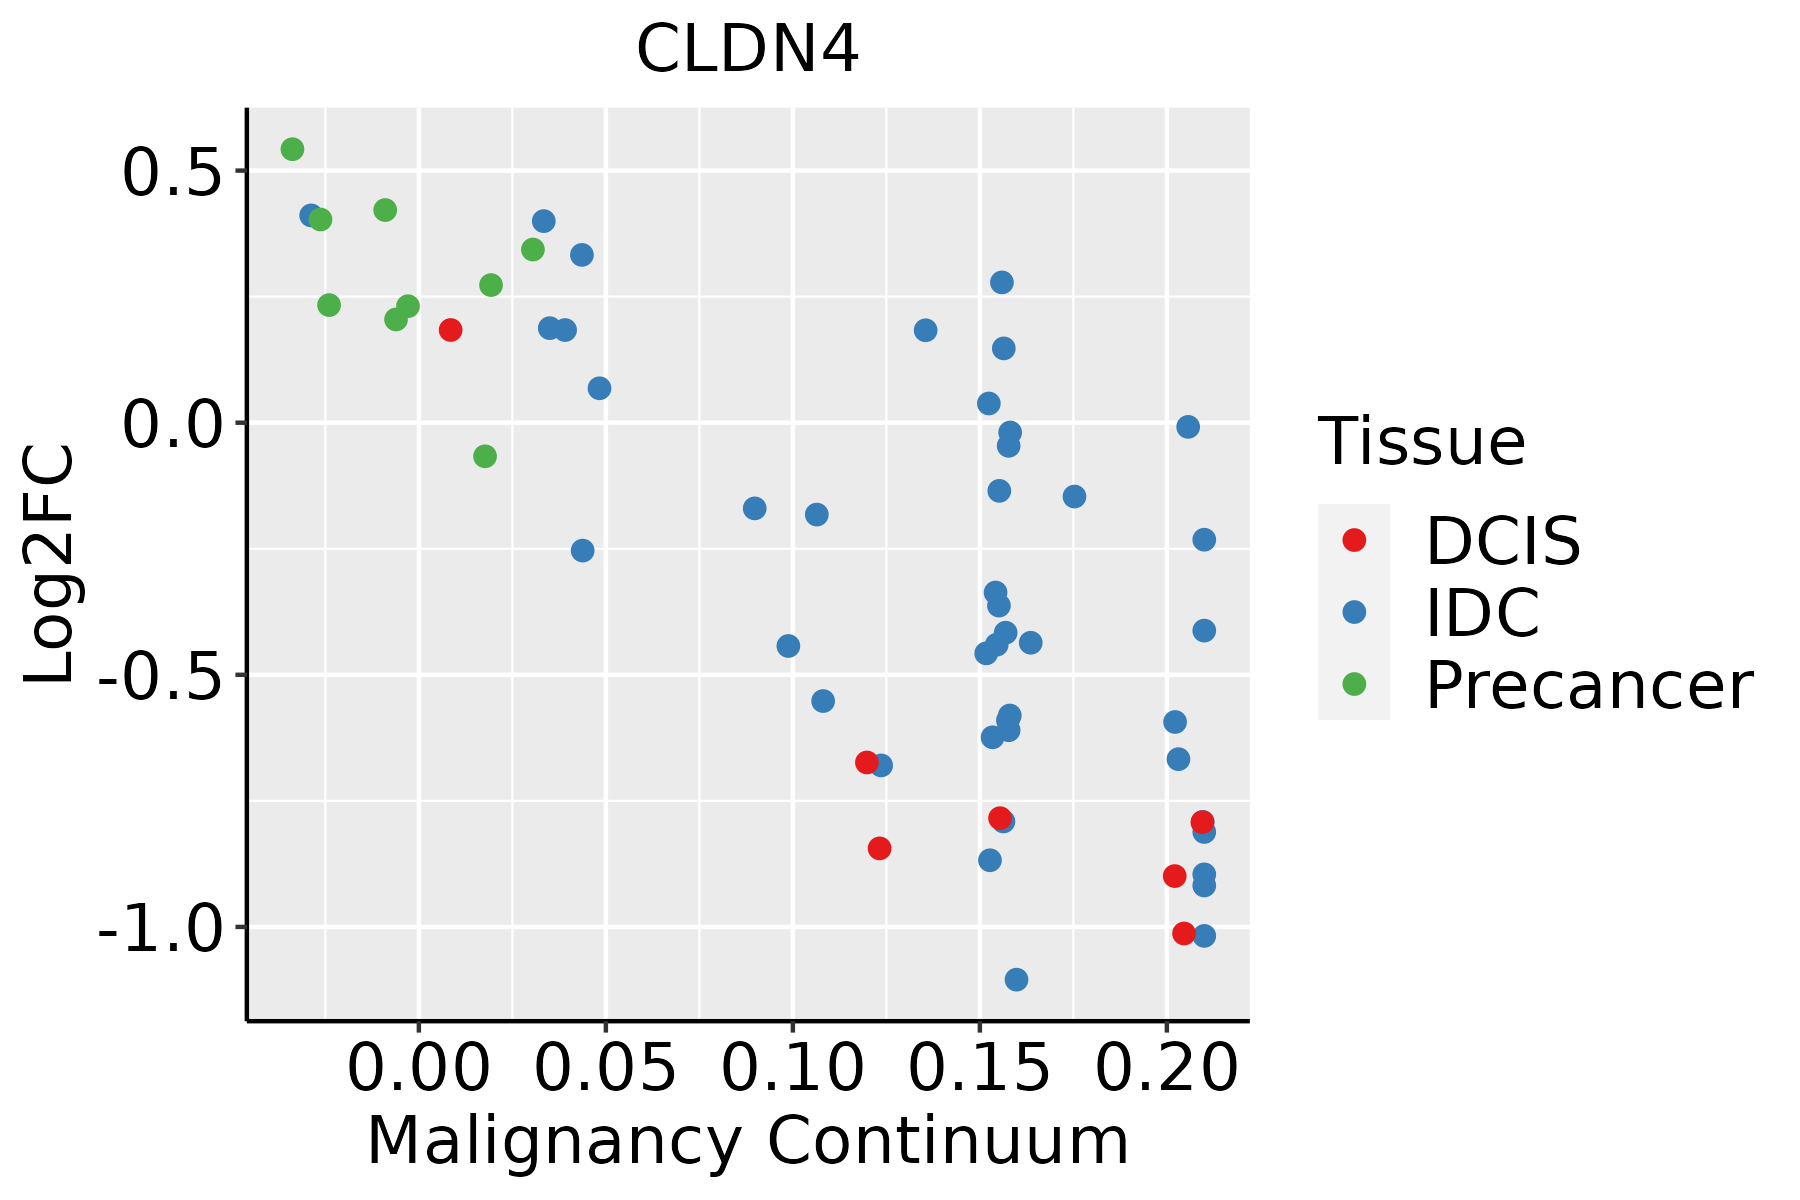 | IDC: Invasive ductal carcinoma |
| DCIS: Ductal carcinoma in situ | ||
| Precancer(BRCA1-mut): Precancerous lesion from BRCA1 mutation carriers | ||
| Cervix | 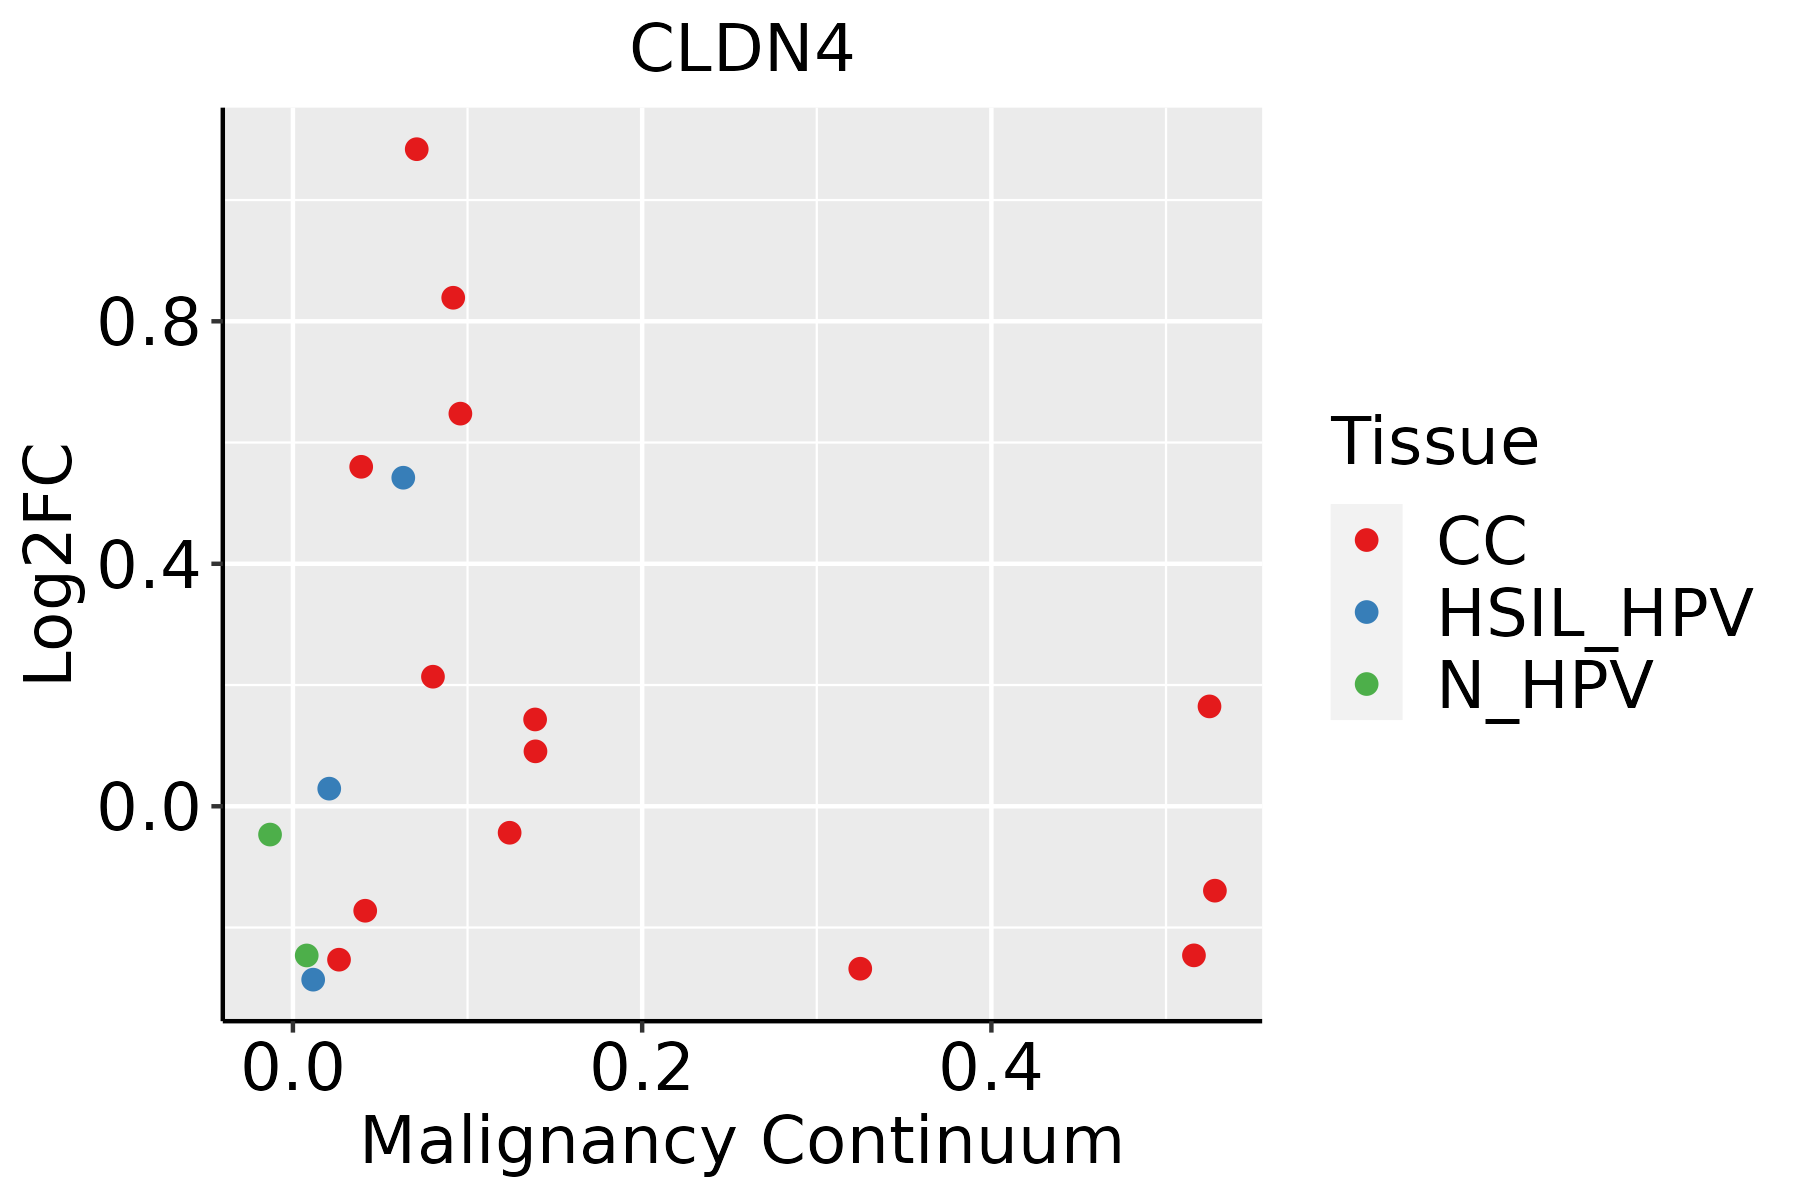 | CC: Cervix cancer |
| HSIL_HPV: HPV-infected high-grade squamous intraepithelial lesions | ||
| N_HPV: HPV-infected normal cervix | ||
| Colorectum (GSE201348) |  | FAP: Familial adenomatous polyposis |
| CRC: Colorectal cancer | ||
| Colorectum (HTA11) |  | AD: Adenomas |
| SER: Sessile serrated lesions | ||
| MSI-H: Microsatellite-high colorectal cancer | ||
| MSS: Microsatellite stable colorectal cancer | ||
| Endometrium | 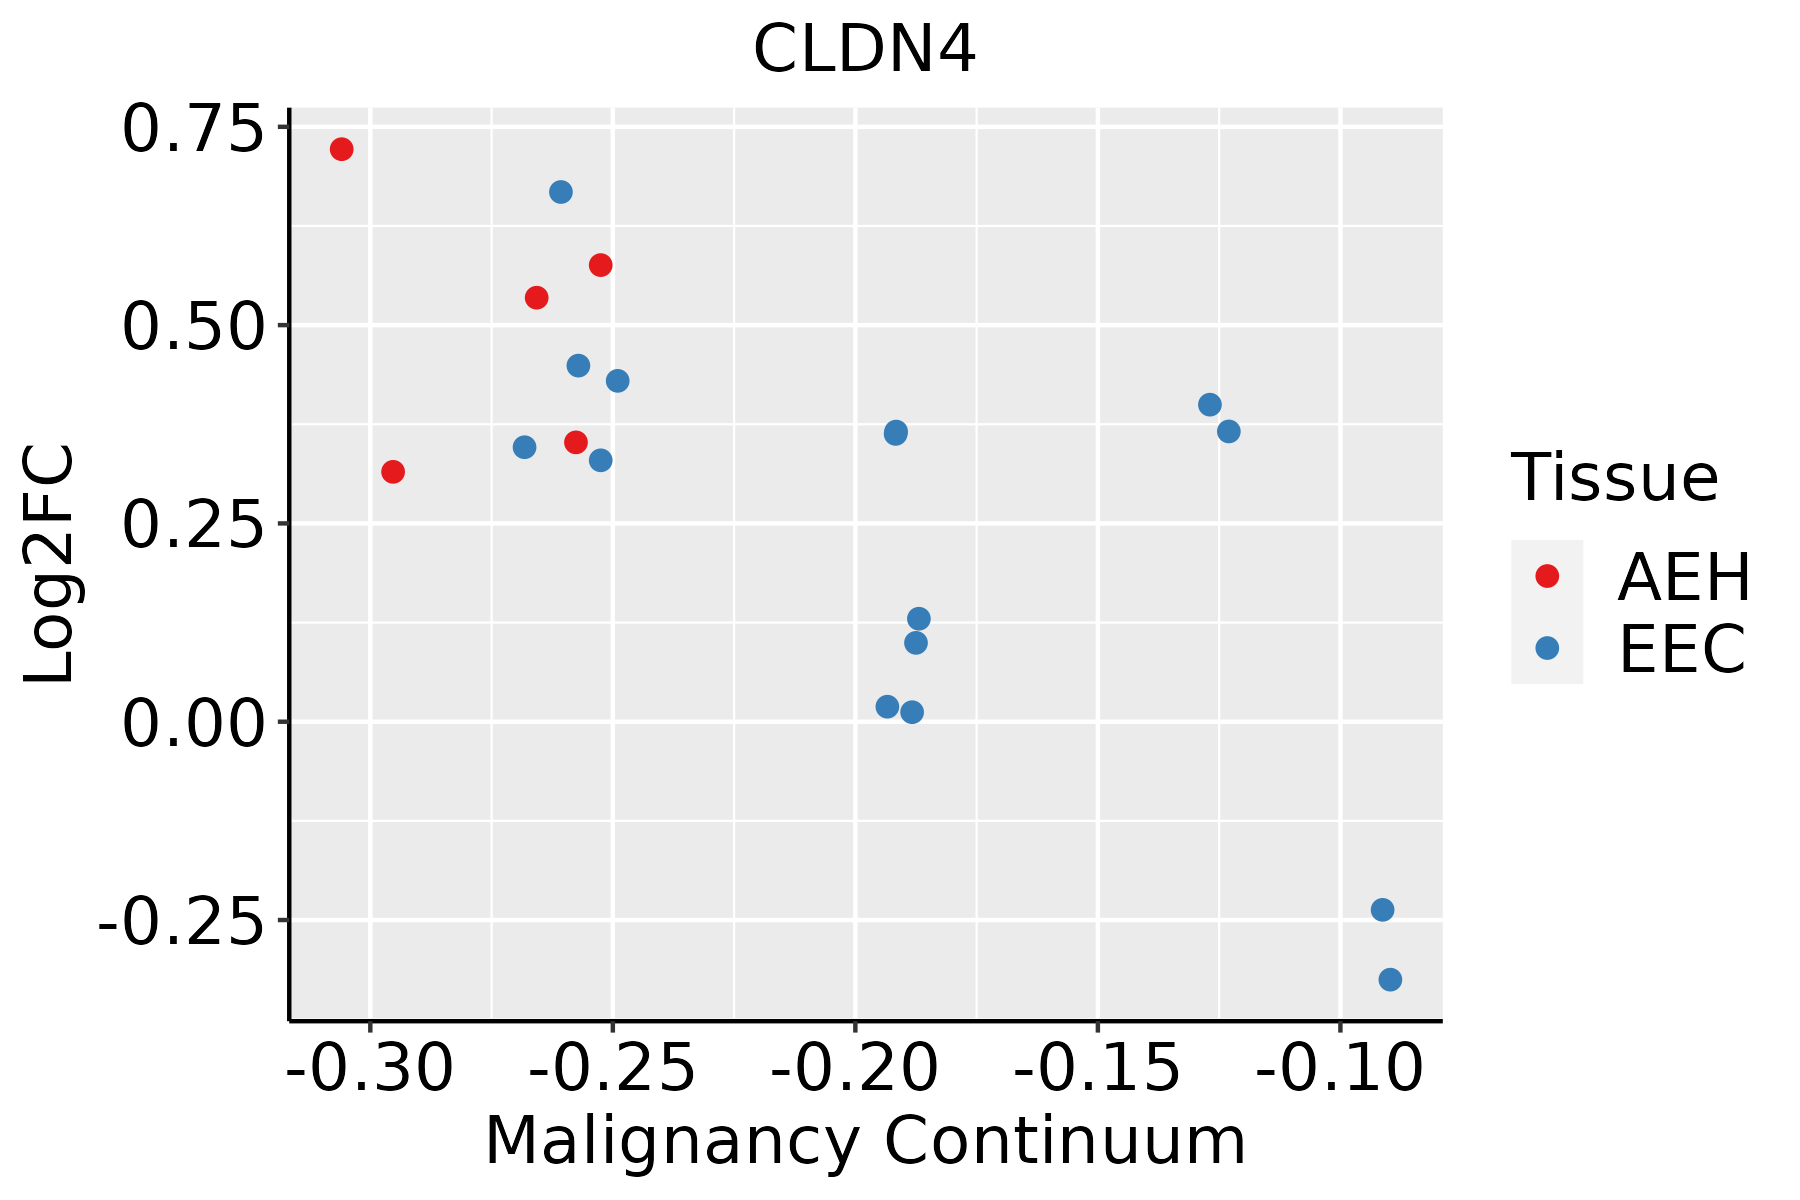 | AEH: Atypical endometrial hyperplasia |
| EEC: Endometrioid Cancer | ||
| Esophagus |  | ESCC: Esophageal squamous cell carcinoma |
| HGIN: High-grade intraepithelial neoplasias | ||
| LGIN: Low-grade intraepithelial neoplasias | ||
| GC | 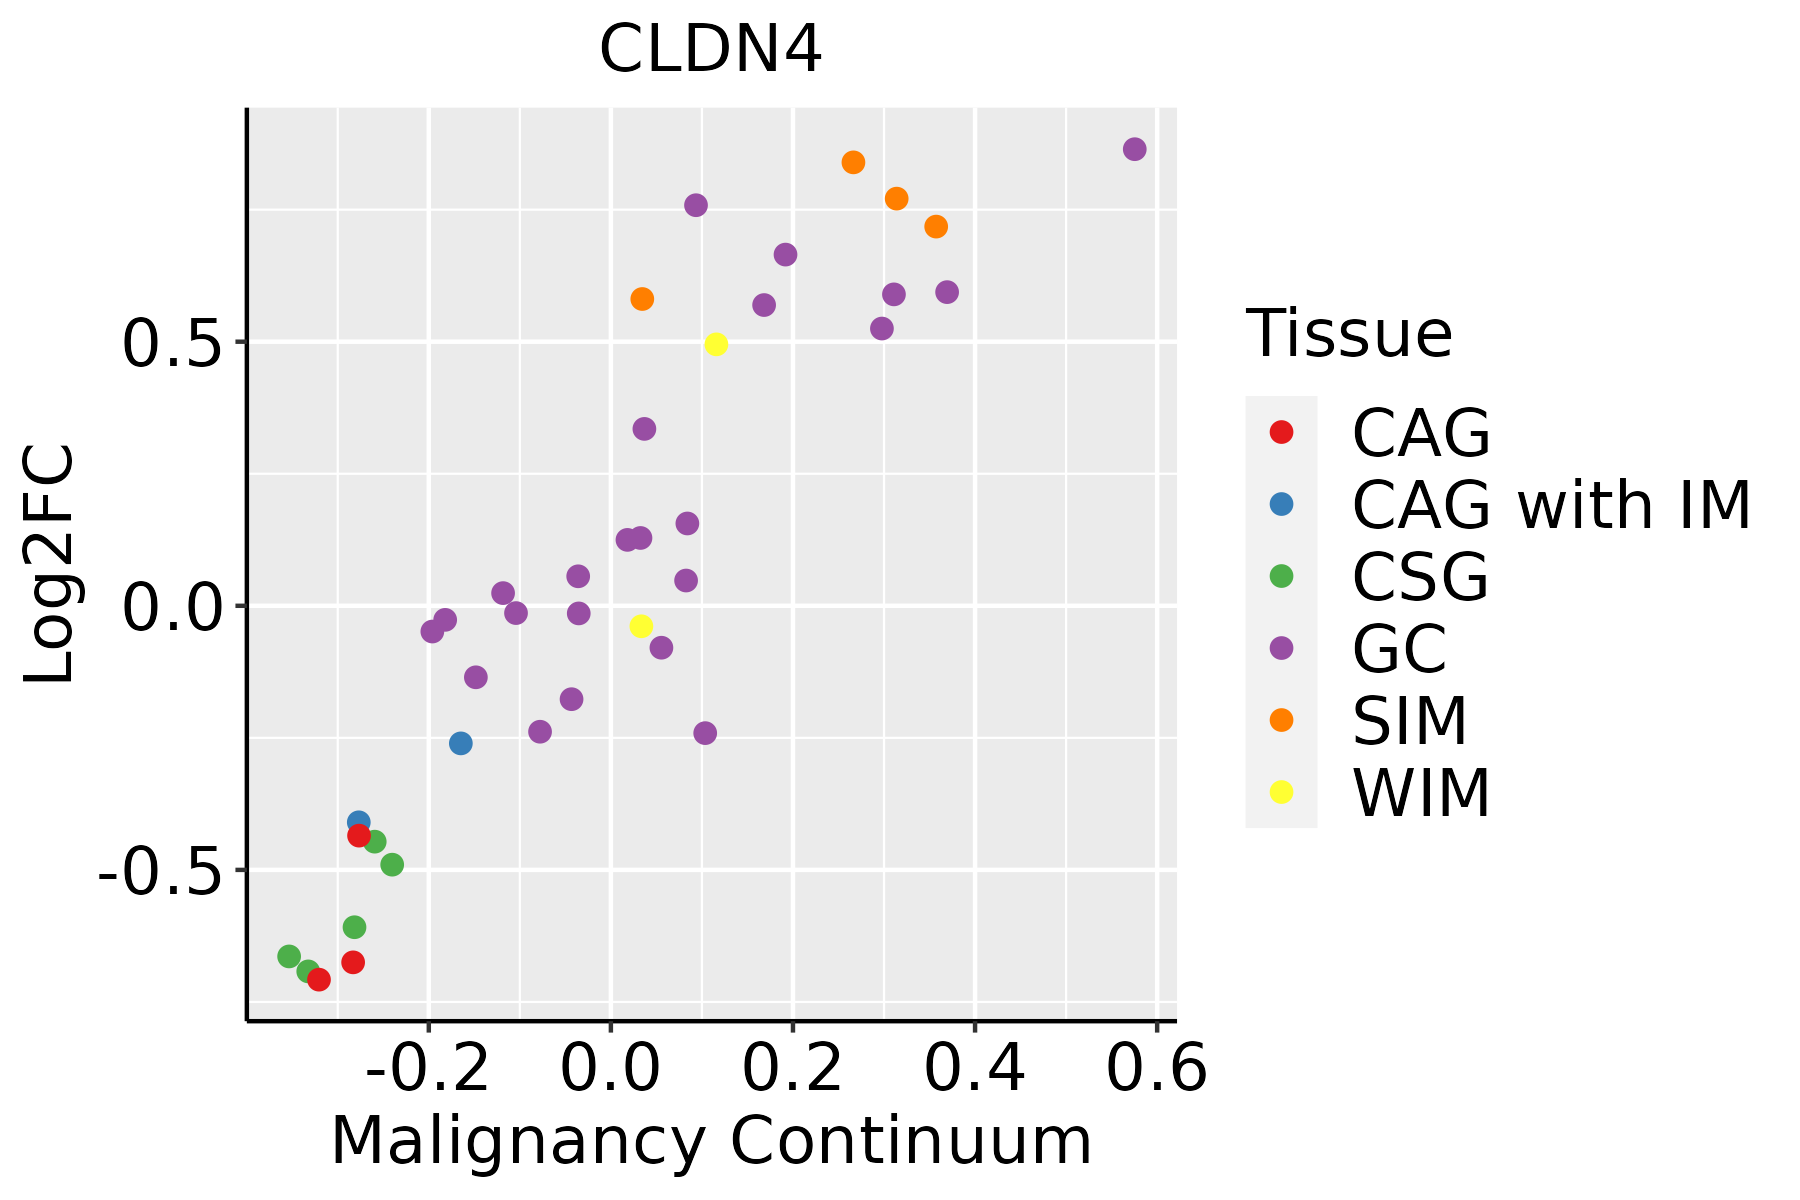 | CAG: Chronic atrophic gastritis |
| CAG with IM: Chronic atrophic gastritis with intestinal metaplasia | ||
| CSG: Chronic superficial gastritis | ||
| GC: Gastric cancer | ||
| SIM: Severe intestinal metaplasia | ||
| WIM: Wild intestinal metaplasia | ||
| Liver | 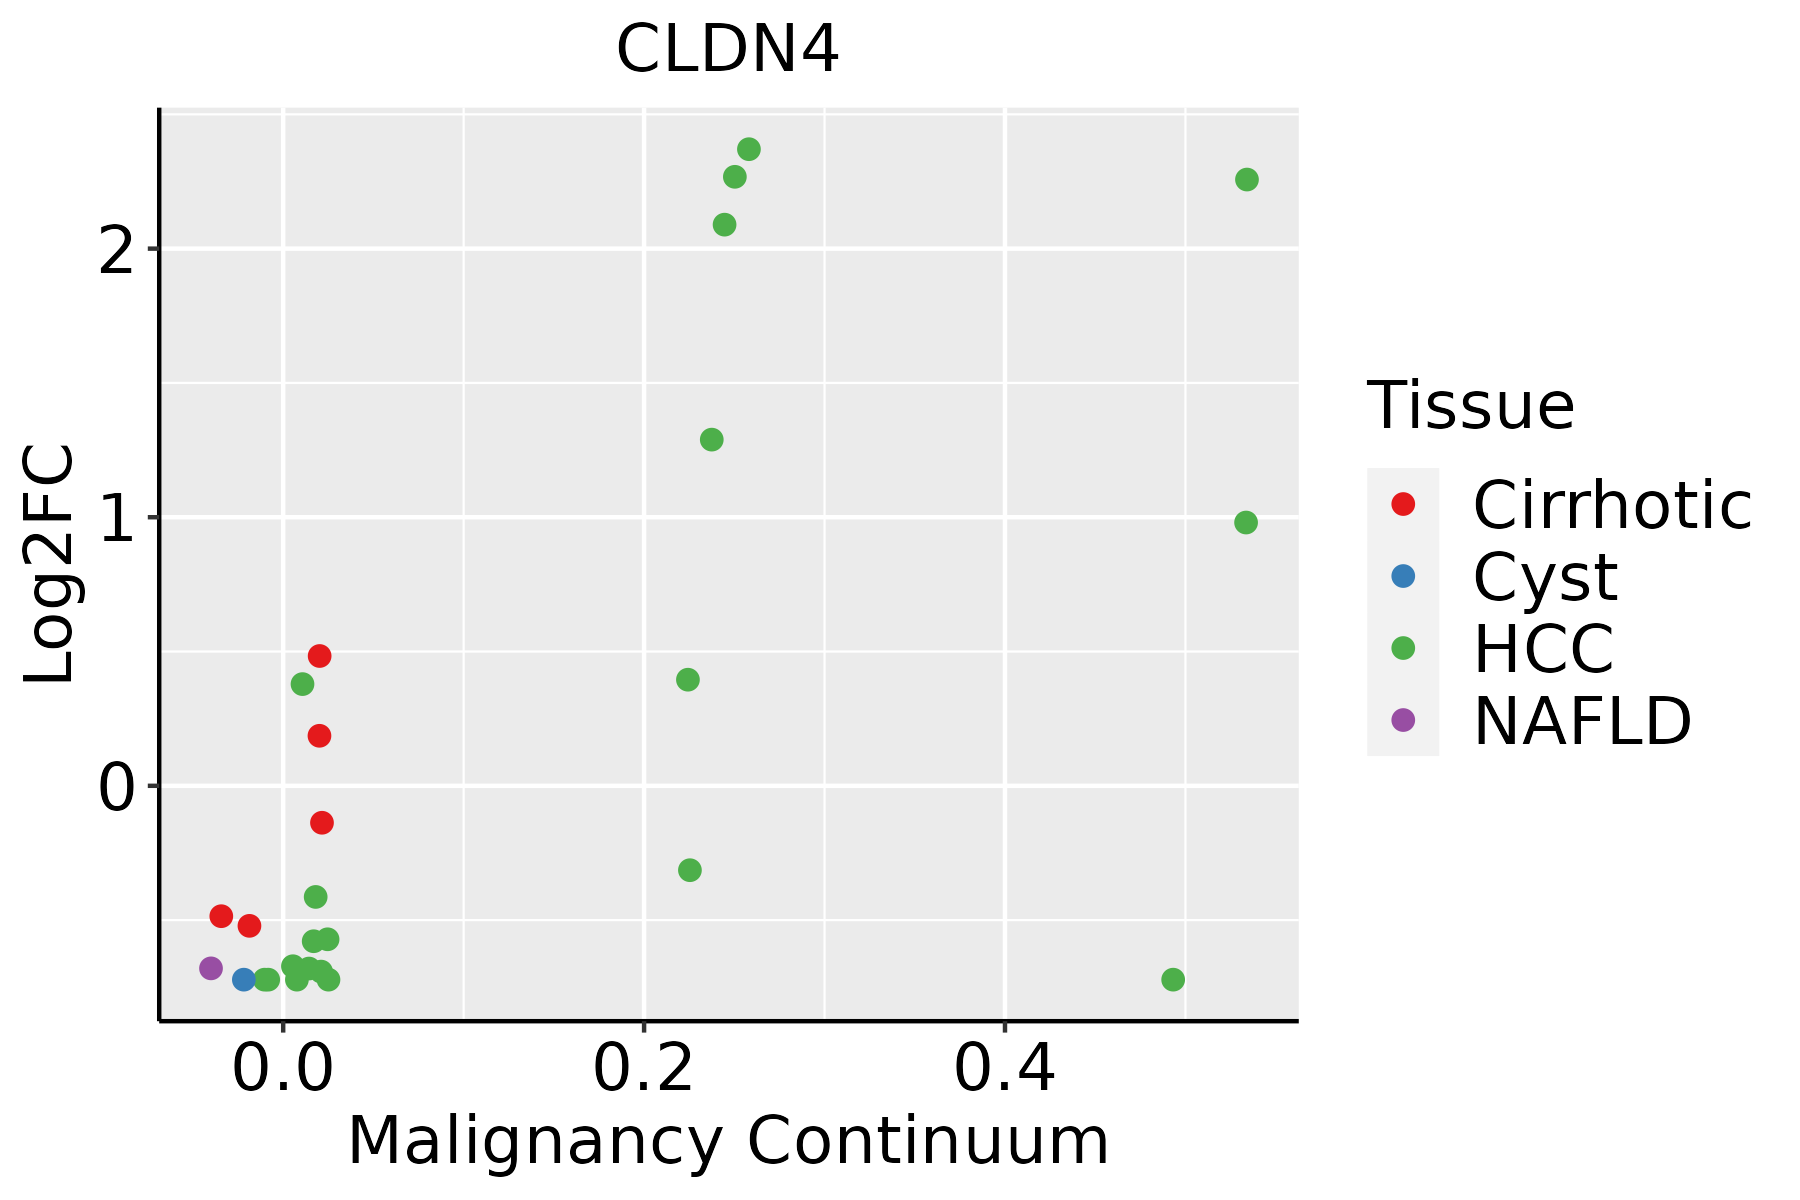 | HCC: Hepatocellular carcinoma |
| NAFLD: Non-alcoholic fatty liver disease | ||
| Lung | 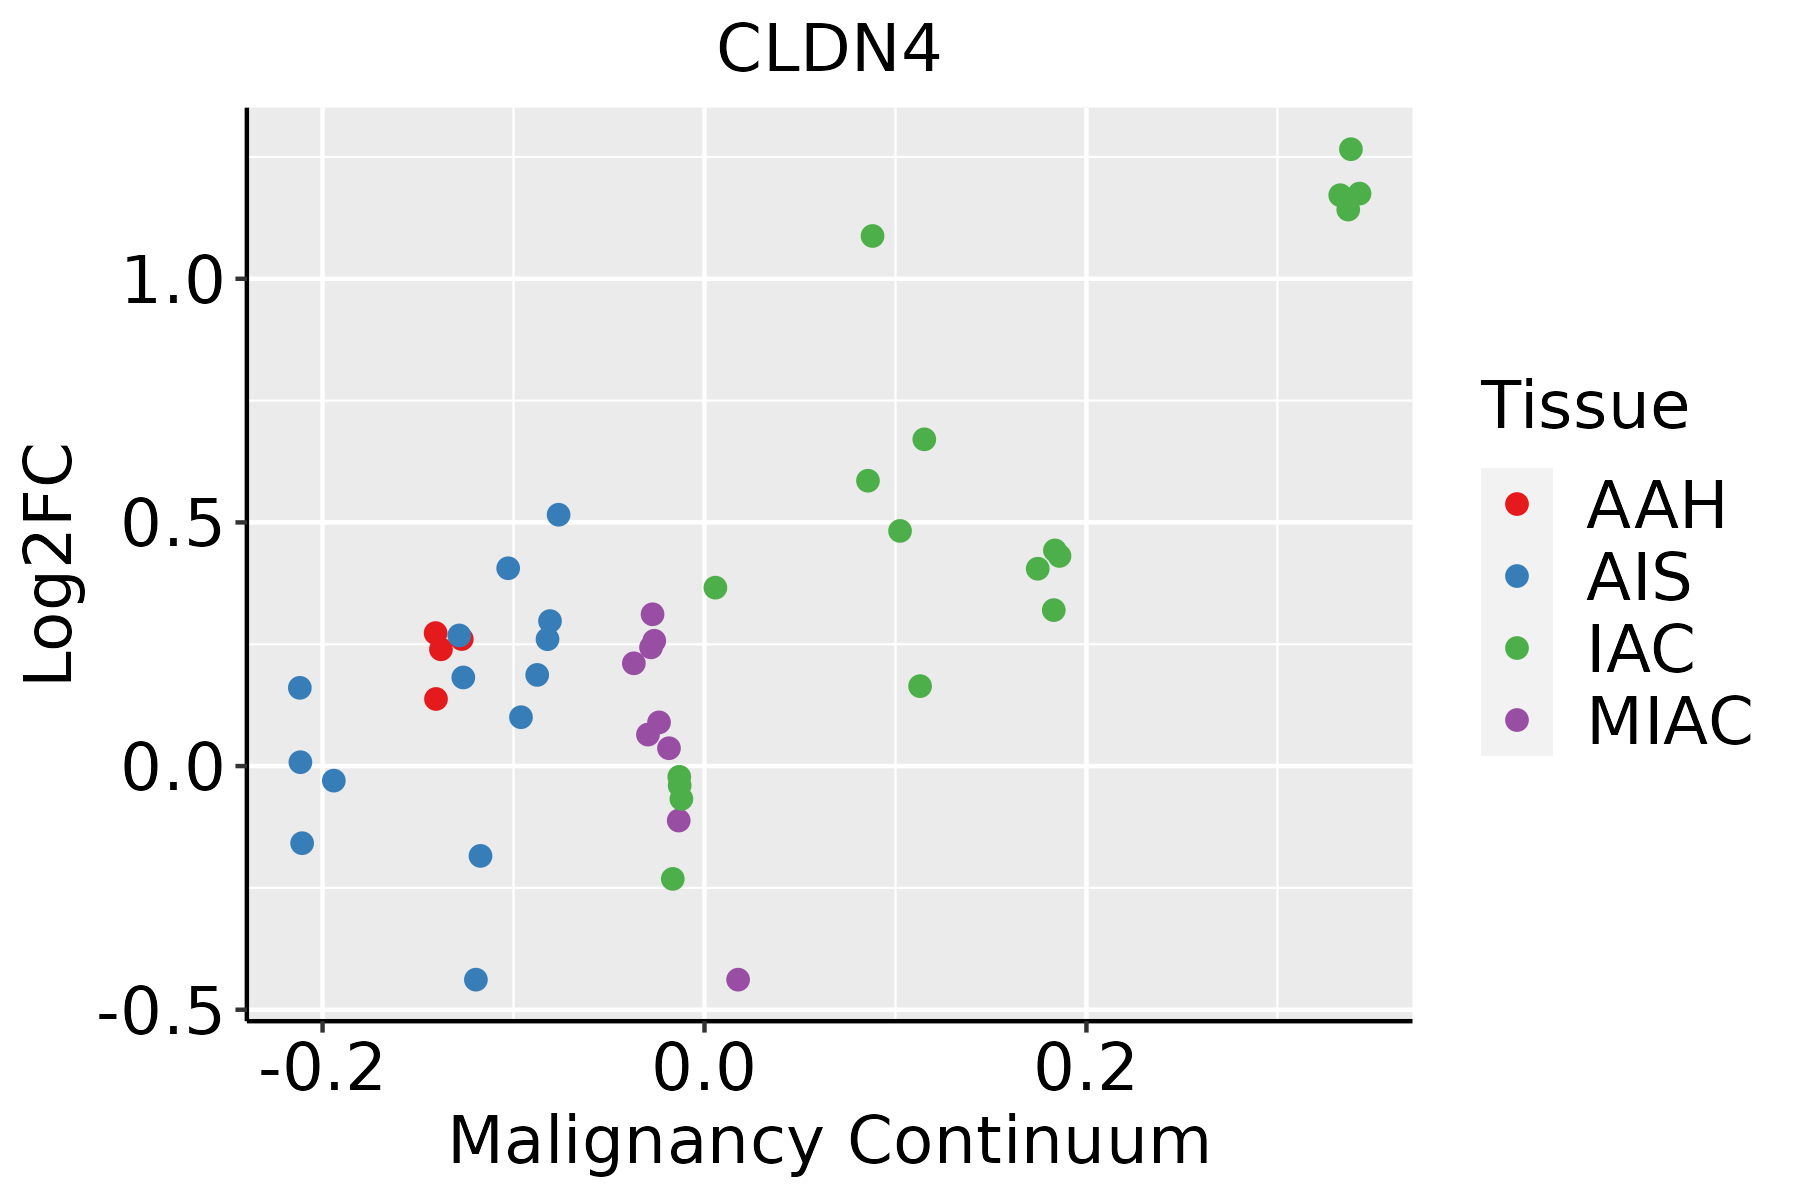 | AAH: Atypical adenomatous hyperplasia |
| AIS: Adenocarcinoma in situ | ||
| IAC: Invasive lung adenocarcinoma | ||
| MIA: Minimally invasive adenocarcinoma | ||
| Oral Cavity |  | EOLP: Erosive Oral lichen planus |
| LP: leukoplakia | ||
| NEOLP: Non-erosive oral lichen planus | ||
| OSCC: Oral squamous cell carcinoma | ||
| Prostate | 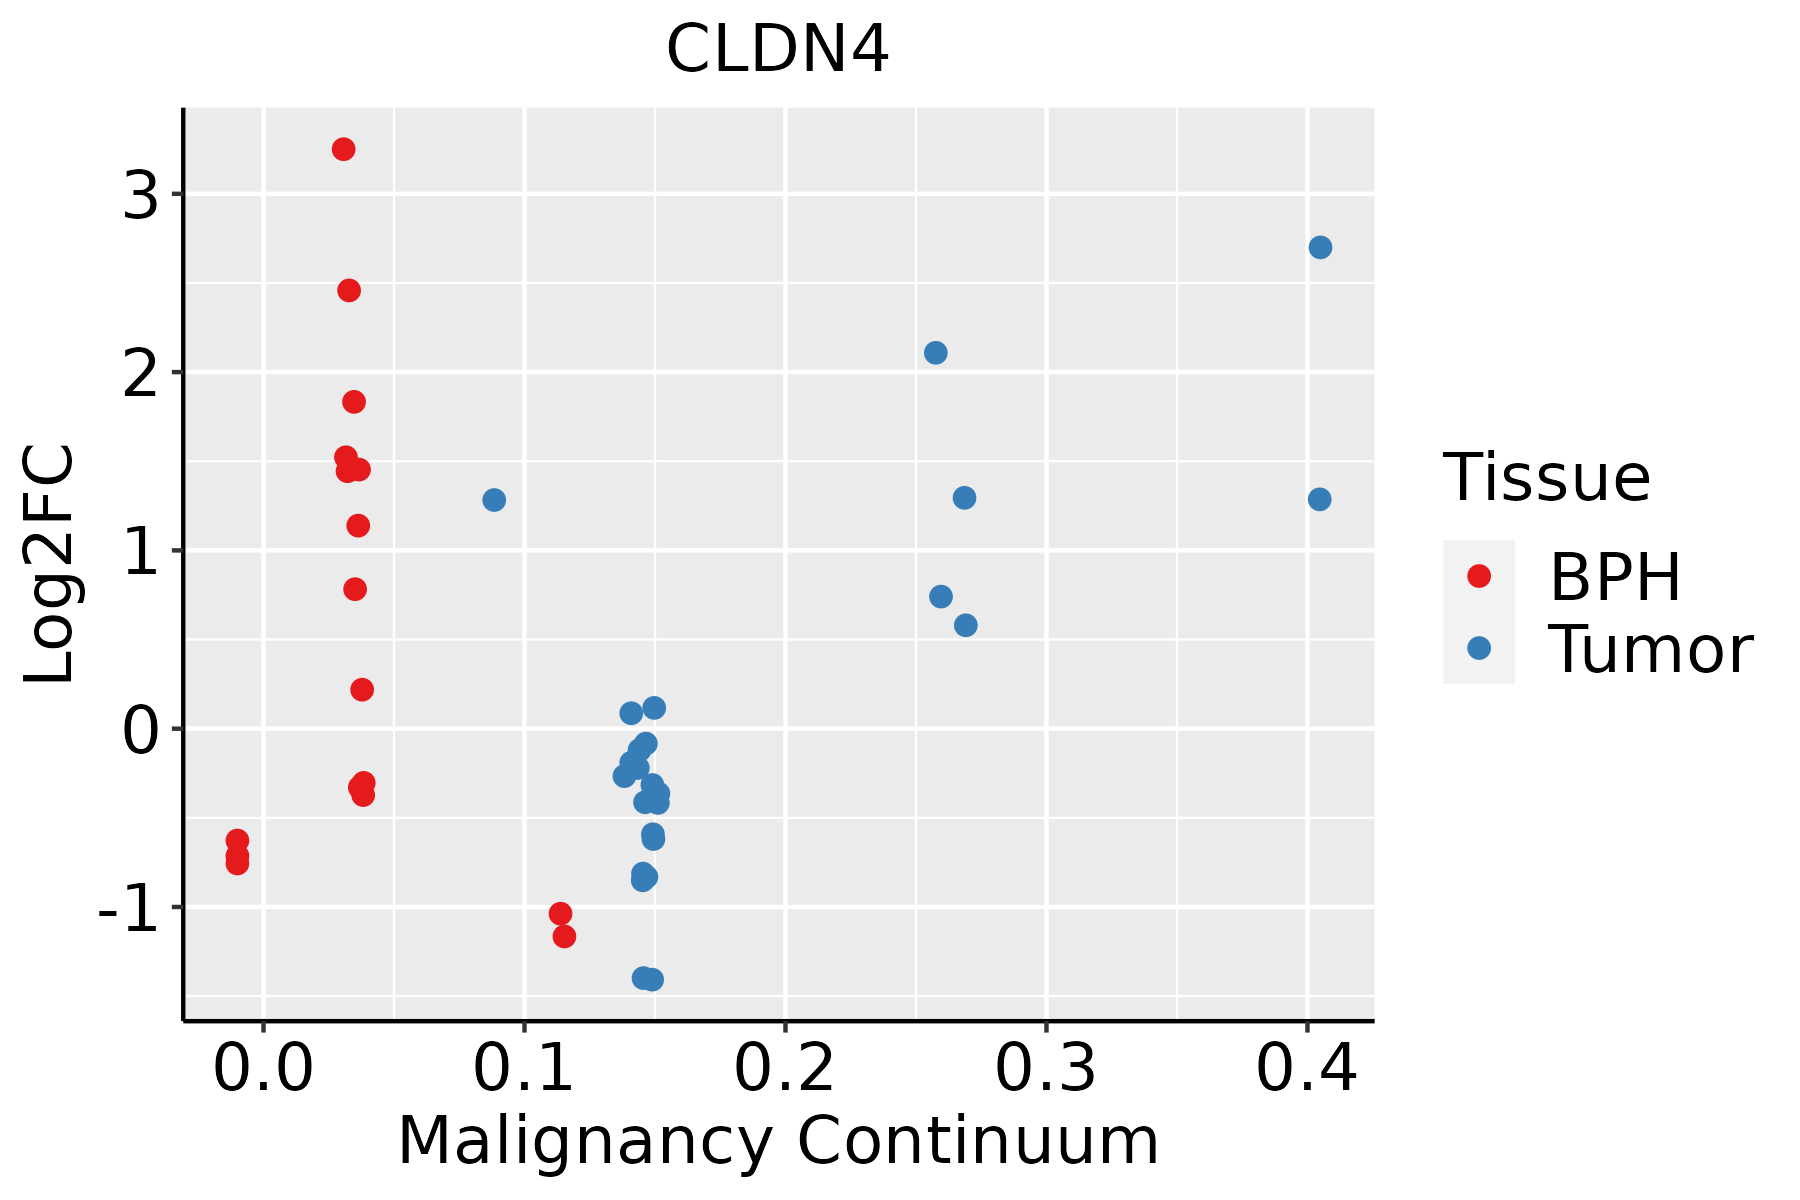 | BPH: Benign Prostatic Hyperplasia |
| Thyroid | 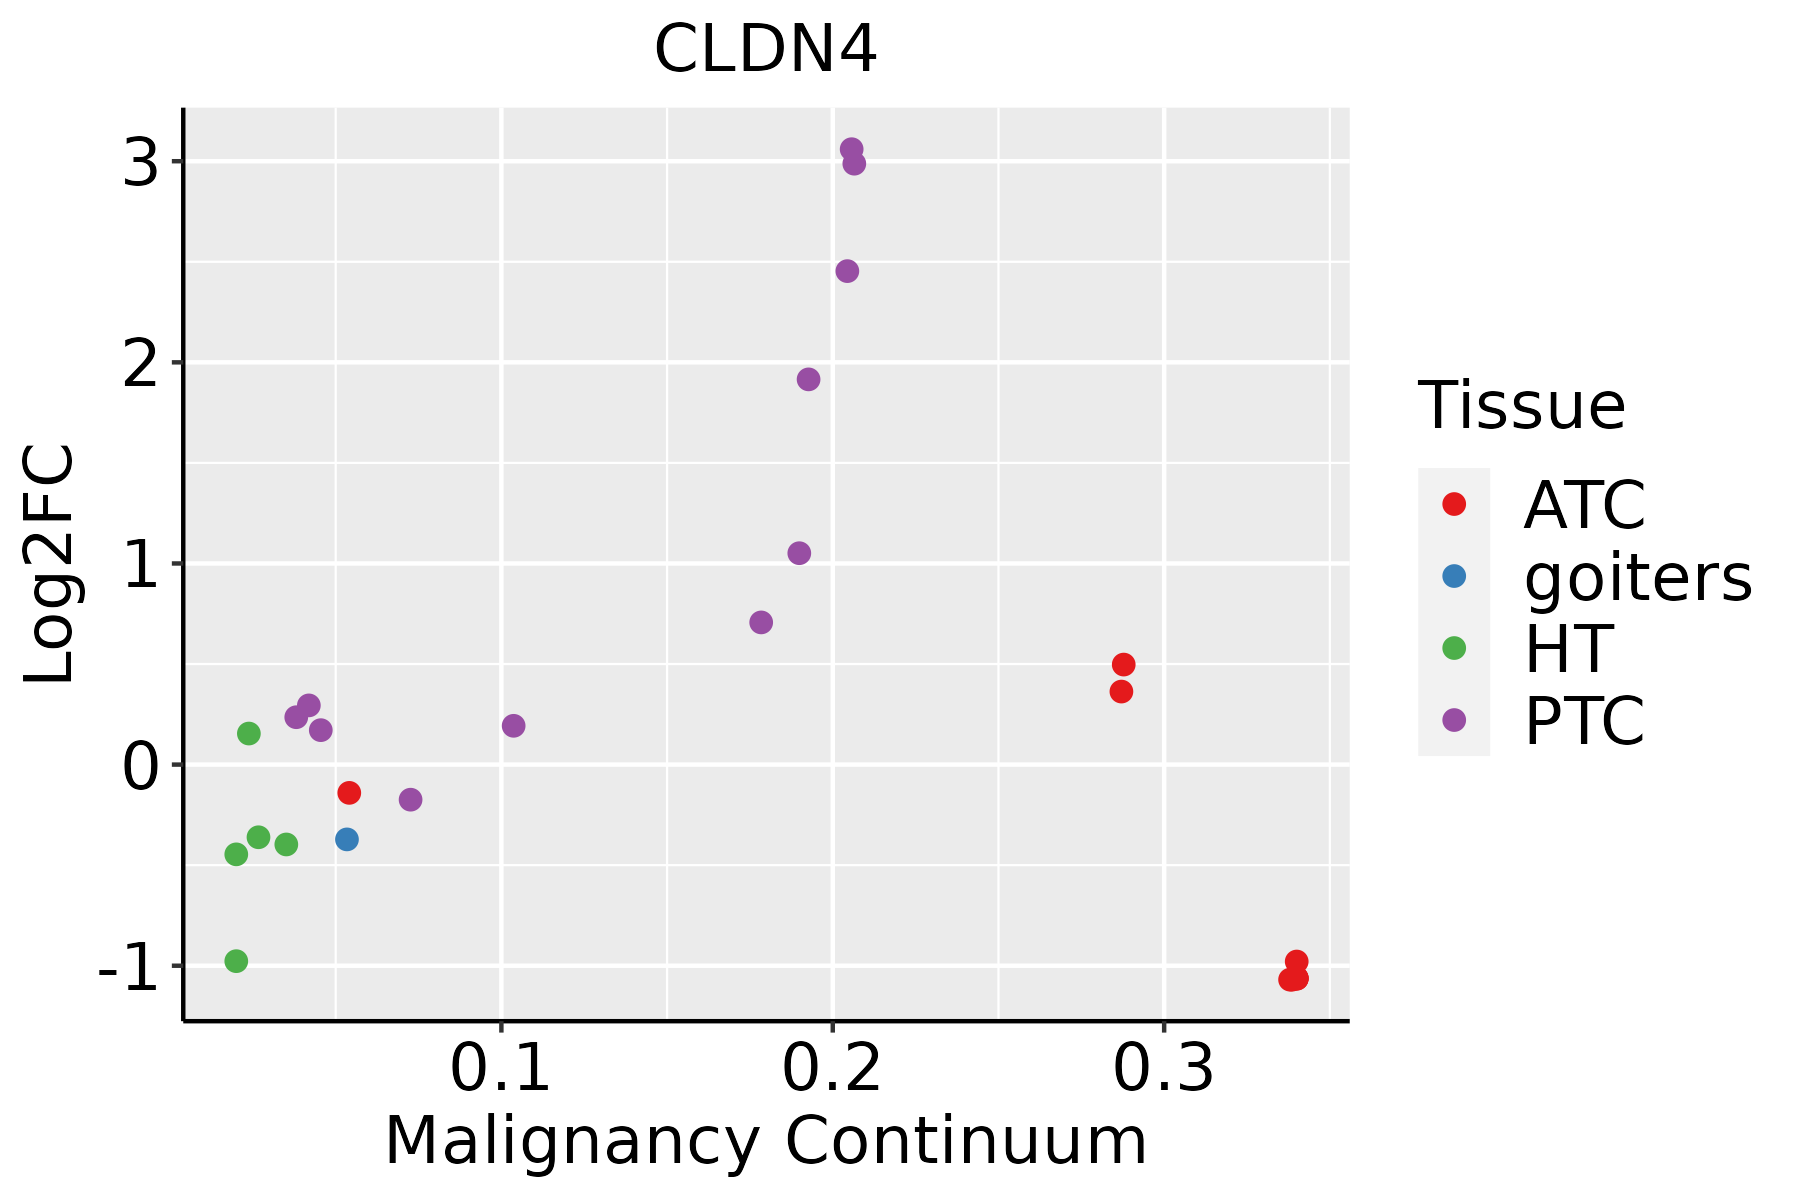 | ATC: Anaplastic thyroid cancer |
| HT: Hashimoto's thyroiditis | ||
| PTC: Papillary thyroid cancer |
| ∗log2FC in expression of this searched gene in stem-like cells from each diseased tissue sample relative to stem-like cells in normal samples in each tissue plotted against the malignancy continuum. Samples are colored based on if they are from different disease stage. |
Top |
Malignant transformation related pathway analysis |
| Find out the enriched GO biological processes and KEGG pathways involved in transition from healthy to precancer to cancer |
| Tissue | Disease Stage | Enriched GO biological Processes |
| Breast | Precancer |  |
| Breast | IDC |  |
| Breast | DCIS |  |
| Cervix | CC |  |
| Cervix | HSIL_HPV |  |
| ∗Top 15 enriched GO BP terms are showed in the bar plot of each disease state in each tissue. Each row represents a significant GO biological process which is colored according to the -log10(p.adjust). |
| Page: 1 2 3 4 5 6 7 8 9 |
| GO ID | Tissue | Disease Stage | Description | Gene Ratio | Bg Ratio | pvalue | p.adjust | Count |
| GO:00525479 | Breast | Precancer | regulation of peptidase activity | 71/1080 | 461/18723 | 2.72e-14 | 6.94e-12 | 71 |
| GO:00485459 | Breast | Precancer | response to steroid hormone | 53/1080 | 339/18723 | 3.07e-11 | 3.66e-09 | 53 |
| GO:00458629 | Breast | Precancer | positive regulation of proteolysis | 51/1080 | 372/18723 | 7.77e-09 | 5.70e-07 | 51 |
| GO:00109529 | Breast | Precancer | positive regulation of peptidase activity | 33/1080 | 197/18723 | 3.01e-08 | 1.89e-06 | 33 |
| GO:00075653 | Breast | Precancer | female pregnancy | 29/1080 | 193/18723 | 2.07e-06 | 7.31e-05 | 29 |
| GO:00447063 | Breast | Precancer | multi-multicellular organism process | 31/1080 | 220/18723 | 3.73e-06 | 1.19e-04 | 31 |
| GO:00420609 | Breast | Precancer | wound healing | 48/1080 | 422/18723 | 5.48e-06 | 1.63e-04 | 48 |
| GO:00508789 | Breast | Precancer | regulation of body fluid levels | 40/1080 | 379/18723 | 1.68e-04 | 2.77e-03 | 40 |
| GO:00702933 | Breast | Precancer | renal absorption | 6/1080 | 17/18723 | 2.59e-04 | 3.83e-03 | 6 |
| GO:19030367 | Breast | Precancer | positive regulation of response to wounding | 12/1080 | 72/18723 | 7.90e-04 | 9.30e-03 | 12 |
| GO:00903036 | Breast | Precancer | positive regulation of wound healing | 10/1080 | 59/18723 | 1.86e-03 | 1.81e-02 | 10 |
| GO:19016549 | Breast | Precancer | response to ketone | 22/1080 | 194/18723 | 1.89e-03 | 1.84e-02 | 22 |
| GO:19030348 | Breast | Precancer | regulation of response to wounding | 19/1080 | 167/18723 | 3.60e-03 | 2.98e-02 | 19 |
| GO:00226049 | Breast | Precancer | regulation of cell morphogenesis | 29/1080 | 309/18723 | 6.88e-03 | 4.67e-02 | 29 |
| GO:005254714 | Breast | IDC | regulation of peptidase activity | 96/1434 | 461/18723 | 7.58e-20 | 6.15e-17 | 96 |
| GO:004854514 | Breast | IDC | response to steroid hormone | 70/1434 | 339/18723 | 1.34e-14 | 4.23e-12 | 70 |
| GO:004586214 | Breast | IDC | positive regulation of proteolysis | 66/1434 | 372/18723 | 9.76e-11 | 1.29e-08 | 66 |
| GO:001095214 | Breast | IDC | positive regulation of peptidase activity | 40/1434 | 197/18723 | 1.04e-08 | 7.67e-07 | 40 |
| GO:000756511 | Breast | IDC | female pregnancy | 39/1434 | 193/18723 | 1.81e-08 | 1.27e-06 | 39 |
| GO:00447061 | Breast | IDC | multi-multicellular organism process | 41/1434 | 220/18723 | 8.58e-08 | 5.19e-06 | 41 |
| Page: 1 2 3 4 5 6 7 8 9 10 11 12 13 14 15 16 17 18 19 20 21 22 23 24 25 26 27 28 29 30 31 32 |
| Pathway ID | Tissue | Disease Stage | Description | Gene Ratio | Bg Ratio | pvalue | p.adjust | qvalue | Count |
| hsa0513018 | Breast | Precancer | Pathogenic Escherichia coli infection | 38/684 | 197/8465 | 3.12e-07 | 5.81e-06 | 4.45e-06 | 38 |
| hsa0453018 | Breast | Precancer | Tight junction | 31/684 | 169/8465 | 1.13e-05 | 1.26e-04 | 9.64e-05 | 31 |
| hsa0513019 | Breast | Precancer | Pathogenic Escherichia coli infection | 38/684 | 197/8465 | 3.12e-07 | 5.81e-06 | 4.45e-06 | 38 |
| hsa0453019 | Breast | Precancer | Tight junction | 31/684 | 169/8465 | 1.13e-05 | 1.26e-04 | 9.64e-05 | 31 |
| hsa0453024 | Breast | IDC | Tight junction | 38/867 | 169/8465 | 2.07e-06 | 3.20e-05 | 2.39e-05 | 38 |
| hsa0513024 | Breast | IDC | Pathogenic Escherichia coli infection | 42/867 | 197/8465 | 2.66e-06 | 3.92e-05 | 2.94e-05 | 42 |
| hsa0467024 | Breast | IDC | Leukocyte transendothelial migration | 21/867 | 114/8465 | 5.41e-03 | 3.13e-02 | 2.34e-02 | 21 |
| hsa0453034 | Breast | IDC | Tight junction | 38/867 | 169/8465 | 2.07e-06 | 3.20e-05 | 2.39e-05 | 38 |
| hsa0513034 | Breast | IDC | Pathogenic Escherichia coli infection | 42/867 | 197/8465 | 2.66e-06 | 3.92e-05 | 2.94e-05 | 42 |
| hsa0467034 | Breast | IDC | Leukocyte transendothelial migration | 21/867 | 114/8465 | 5.41e-03 | 3.13e-02 | 2.34e-02 | 21 |
| hsa0513043 | Breast | DCIS | Pathogenic Escherichia coli infection | 42/846 | 197/8465 | 1.40e-06 | 2.15e-05 | 1.59e-05 | 42 |
| hsa0453044 | Breast | DCIS | Tight junction | 37/846 | 169/8465 | 3.07e-06 | 4.20e-05 | 3.09e-05 | 37 |
| hsa0513053 | Breast | DCIS | Pathogenic Escherichia coli infection | 42/846 | 197/8465 | 1.40e-06 | 2.15e-05 | 1.59e-05 | 42 |
| hsa0453054 | Breast | DCIS | Tight junction | 37/846 | 169/8465 | 3.07e-06 | 4.20e-05 | 3.09e-05 | 37 |
| hsa0513020 | Cervix | CC | Pathogenic Escherichia coli infection | 63/1267 | 197/8465 | 9.28e-10 | 2.00e-08 | 1.19e-08 | 63 |
| hsa0453020 | Cervix | CC | Tight junction | 49/1267 | 169/8465 | 1.87e-06 | 1.78e-05 | 1.05e-05 | 49 |
| hsa0467020 | Cervix | CC | Leukocyte transendothelial migration | 36/1267 | 114/8465 | 5.22e-06 | 4.83e-05 | 2.86e-05 | 36 |
| hsa045147 | Cervix | CC | Cell adhesion molecules | 36/1267 | 157/8465 | 4.94e-03 | 1.67e-02 | 9.86e-03 | 36 |
| hsa05130110 | Cervix | CC | Pathogenic Escherichia coli infection | 63/1267 | 197/8465 | 9.28e-10 | 2.00e-08 | 1.19e-08 | 63 |
| hsa04530110 | Cervix | CC | Tight junction | 49/1267 | 169/8465 | 1.87e-06 | 1.78e-05 | 1.05e-05 | 49 |
| Page: 1 2 3 4 5 6 7 8 9 10 |
Top |
Cell-cell communication analysis |
| Identification of potential cell-cell interactions between two cell types and their ligand-receptor pairs for different disease states |
| Ligand | Receptor | LRpair | Pathway | Tissue | Disease Stage |
| Page: 1 |
Top |
Single-cell gene regulatory network inference analysis |
| Find out the significant the regulons (TFs) and the target genes of each regulon across cell types for different disease states |
| TF | Cell Type | Tissue | Disease Stage | Target Gene | RSS | Regulon Activity |
| ∗The dot plots of a searched regulon are shown for all cell subpopulations in each disease state of each tissue based on the regulon specific score inferred using pySCENIC and by calculating the average expression. |
| Page: 1 |
Top |
Somatic mutation of malignant transformation related genes |
| Annotation of somatic variants for genes involved in malignant transformation |
| Hugo Symbol | Variant Class | Variant Classification | dbSNP RS | HGVSc | HGVSp | HGVSp Short | SWISSPROT | BIOTYPE | SIFT | PolyPhen | Tumor Sample Barcode | Tissue | Histology | Sex | Age | Stage | Therapy Types | Drugs | Outcome |
| CLDN4 | SNV | Missense_Mutation | c.428N>C | p.Ile143Thr | p.I143T | O14493 | protein_coding | deleterious(0.03) | benign(0.137) | TCGA-BH-A18G-01 | Breast | breast invasive carcinoma | Female | >=65 | I/II | Unknown | Unknown | SD | |
| CLDN4 | SNV | Missense_Mutation | c.322C>A | p.Leu108Met | p.L108M | O14493 | protein_coding | tolerated(0.12) | benign(0.015) | TCGA-AZ-6601-01 | Colorectum | colon adenocarcinoma | Male | >=65 | I/II | Unknown | Unknown | PD | |
| CLDN4 | deletion | Frame_Shift_Del | c.532delN | p.Leu180CysfsTer115 | p.L180Cfs*115 | O14493 | protein_coding | TCGA-AD-A5EJ-01 | Colorectum | colon adenocarcinoma | Female | >=65 | I/II | Unknown | Unknown | SD | |||
| CLDN4 | deletion | Frame_Shift_Del | c.532delN | p.Leu180CysfsTer115 | p.L180Cfs*115 | O14493 | protein_coding | TCGA-CK-6746-01 | Colorectum | colon adenocarcinoma | Female | >=65 | I/II | Unknown | Unknown | SD | |||
| CLDN4 | SNV | Missense_Mutation | novel | c.259N>G | p.Ser87Gly | p.S87G | O14493 | protein_coding | deleterious(0.04) | benign(0.026) | TCGA-AP-A1DK-01 | Endometrium | uterine corpus endometrioid carcinoma | Female | <65 | I/II | Unknown | Unknown | SD |
| CLDN4 | SNV | Missense_Mutation | novel | c.133N>G | p.Thr45Ala | p.T45A | O14493 | protein_coding | deleterious(0.03) | benign(0.015) | TCGA-E6-A1M0-01 | Endometrium | uterine corpus endometrioid carcinoma | Female | <65 | III/IV | Chemotherapy | carboplatin | SD |
| CLDN4 | SNV | Missense_Mutation | rs782337604 | c.497N>C | p.Val166Ala | p.V166A | O14493 | protein_coding | deleterious(0) | benign(0.278) | TCGA-EC-A1QX-01 | Endometrium | uterine corpus endometrioid carcinoma | Female | >=65 | I/II | Chemotherapy | cyclophosphamide | PD |
| CLDN4 | SNV | Missense_Mutation | novel | c.370N>A | p.Val124Met | p.V124M | O14493 | protein_coding | tolerated(0.16) | benign(0.038) | TCGA-EO-A22U-01 | Endometrium | uterine corpus endometrioid carcinoma | Female | >=65 | I/II | Unknown | Unknown | SD |
| CLDN4 | SNV | Missense_Mutation | novel | c.327N>T | p.Glu109Asp | p.E109D | O14493 | protein_coding | tolerated(0.27) | benign(0.007) | TCGA-EO-A22X-01 | Endometrium | uterine corpus endometrioid carcinoma | Female | <65 | III/IV | Unspecific | Carboplatin | Complete Response |
| CLDN4 | SNV | Missense_Mutation | rs200176069 | c.488C>T | p.Ser163Leu | p.S163L | O14493 | protein_coding | deleterious(0.03) | possibly_damaging(0.686) | TCGA-EY-A4KR-01 | Endometrium | uterine corpus endometrioid carcinoma | Female | <65 | III/IV | Chemotherapy | carboplatin | PD |
| Page: 1 2 3 |
Top |
Related drugs of malignant transformation related genes |
| Identification of chemicals and drugs interact with genes involved in malignant transfromation |
| (DGIdb 4.0) |
| Entrez ID | Symbol | Category | Interaction Types | Drug Claim Name | Drug Name | PMIDs |
| Page: 1 |

Copyright 2023-Present -The University of Texas Health Science Center at Houston |