
|
|||||
|
 | |
| |
| |
| |
| |
| |
|
Gene: BICRAL |
Gene summary for BICRAL |
| Gene information | Species | Human | Gene symbol | BICRAL | Gene ID | 23506 |
| Gene name | BICRA like chromatin remodeling complex associated protein | |
| Gene Alias | GLTSCR1L | |
| Cytomap | 6p21.1 | |
| Gene Type | protein-coding | GO ID | GO:0006139 | UniProtAcc | Q6AI39 |
Top |
Malignant transformation analysis |
| Identification of the aberrant gene expression in precancerous and cancerous lesions by comparing the gene expression of stem-like cells in diseased tissues with normal stem cells |
| Entrez ID | Symbol | Replicates | Species | Organ | Tissue | Adj P-value | Log2FC | Malignancy |
| 23506 | BICRAL | CCI_1 | Human | Cervix | CC | 2.78e-04 | 4.85e-01 | 0.528 |
| 23506 | BICRAL | CCI_2 | Human | Cervix | CC | 1.70e-05 | 5.64e-01 | 0.5249 |
| 23506 | BICRAL | CCI_3 | Human | Cervix | CC | 6.58e-11 | 5.29e-01 | 0.516 |
| 23506 | BICRAL | Tumor | Human | Cervix | CC | 8.11e-04 | -7.17e-02 | 0.1241 |
| 23506 | BICRAL | HTA11_347_2000001011 | Human | Colorectum | AD | 4.49e-07 | 5.00e-01 | -0.1954 |
| 23506 | BICRAL | HTA11_99999970781_79442 | Human | Colorectum | MSS | 1.68e-40 | -7.23e-01 | 0.294 |
| 23506 | BICRAL | HTA11_99999965104_69814 | Human | Colorectum | MSS | 5.81e-13 | -7.23e-01 | 0.281 |
| 23506 | BICRAL | HTA11_99999971662_82457 | Human | Colorectum | MSS | 4.17e-37 | -7.23e-01 | 0.3859 |
| 23506 | BICRAL | HTA11_99999973899_84307 | Human | Colorectum | MSS | 7.58e-10 | -7.23e-01 | 0.2585 |
| 23506 | BICRAL | HTA11_99999974143_84620 | Human | Colorectum | MSS | 2.85e-36 | -7.23e-01 | 0.3005 |
| 23506 | BICRAL | A015-C-203 | Human | Colorectum | FAP | 8.15e-18 | -2.93e-01 | -0.1294 |
| 23506 | BICRAL | A002-C-201 | Human | Colorectum | FAP | 2.77e-03 | -1.49e-01 | 0.0324 |
| 23506 | BICRAL | A001-C-108 | Human | Colorectum | FAP | 4.45e-08 | -1.79e-01 | -0.0272 |
| 23506 | BICRAL | A002-C-205 | Human | Colorectum | FAP | 1.76e-14 | -4.47e-01 | -0.1236 |
| 23506 | BICRAL | A015-C-006 | Human | Colorectum | FAP | 4.99e-12 | -5.38e-01 | -0.0994 |
| 23506 | BICRAL | A015-C-106 | Human | Colorectum | FAP | 3.87e-05 | -1.57e-01 | -0.0511 |
| 23506 | BICRAL | A002-C-114 | Human | Colorectum | FAP | 3.73e-09 | -2.81e-01 | -0.1561 |
| 23506 | BICRAL | A015-C-104 | Human | Colorectum | FAP | 7.07e-22 | -3.23e-01 | -0.1899 |
| 23506 | BICRAL | A001-C-014 | Human | Colorectum | FAP | 8.13e-10 | -2.80e-01 | 0.0135 |
| 23506 | BICRAL | A002-C-016 | Human | Colorectum | FAP | 1.23e-16 | -3.59e-01 | 0.0521 |
| Page: 1 2 3 |
| Tissue | Expression Dynamics | Abbreviation |
| Cervix | 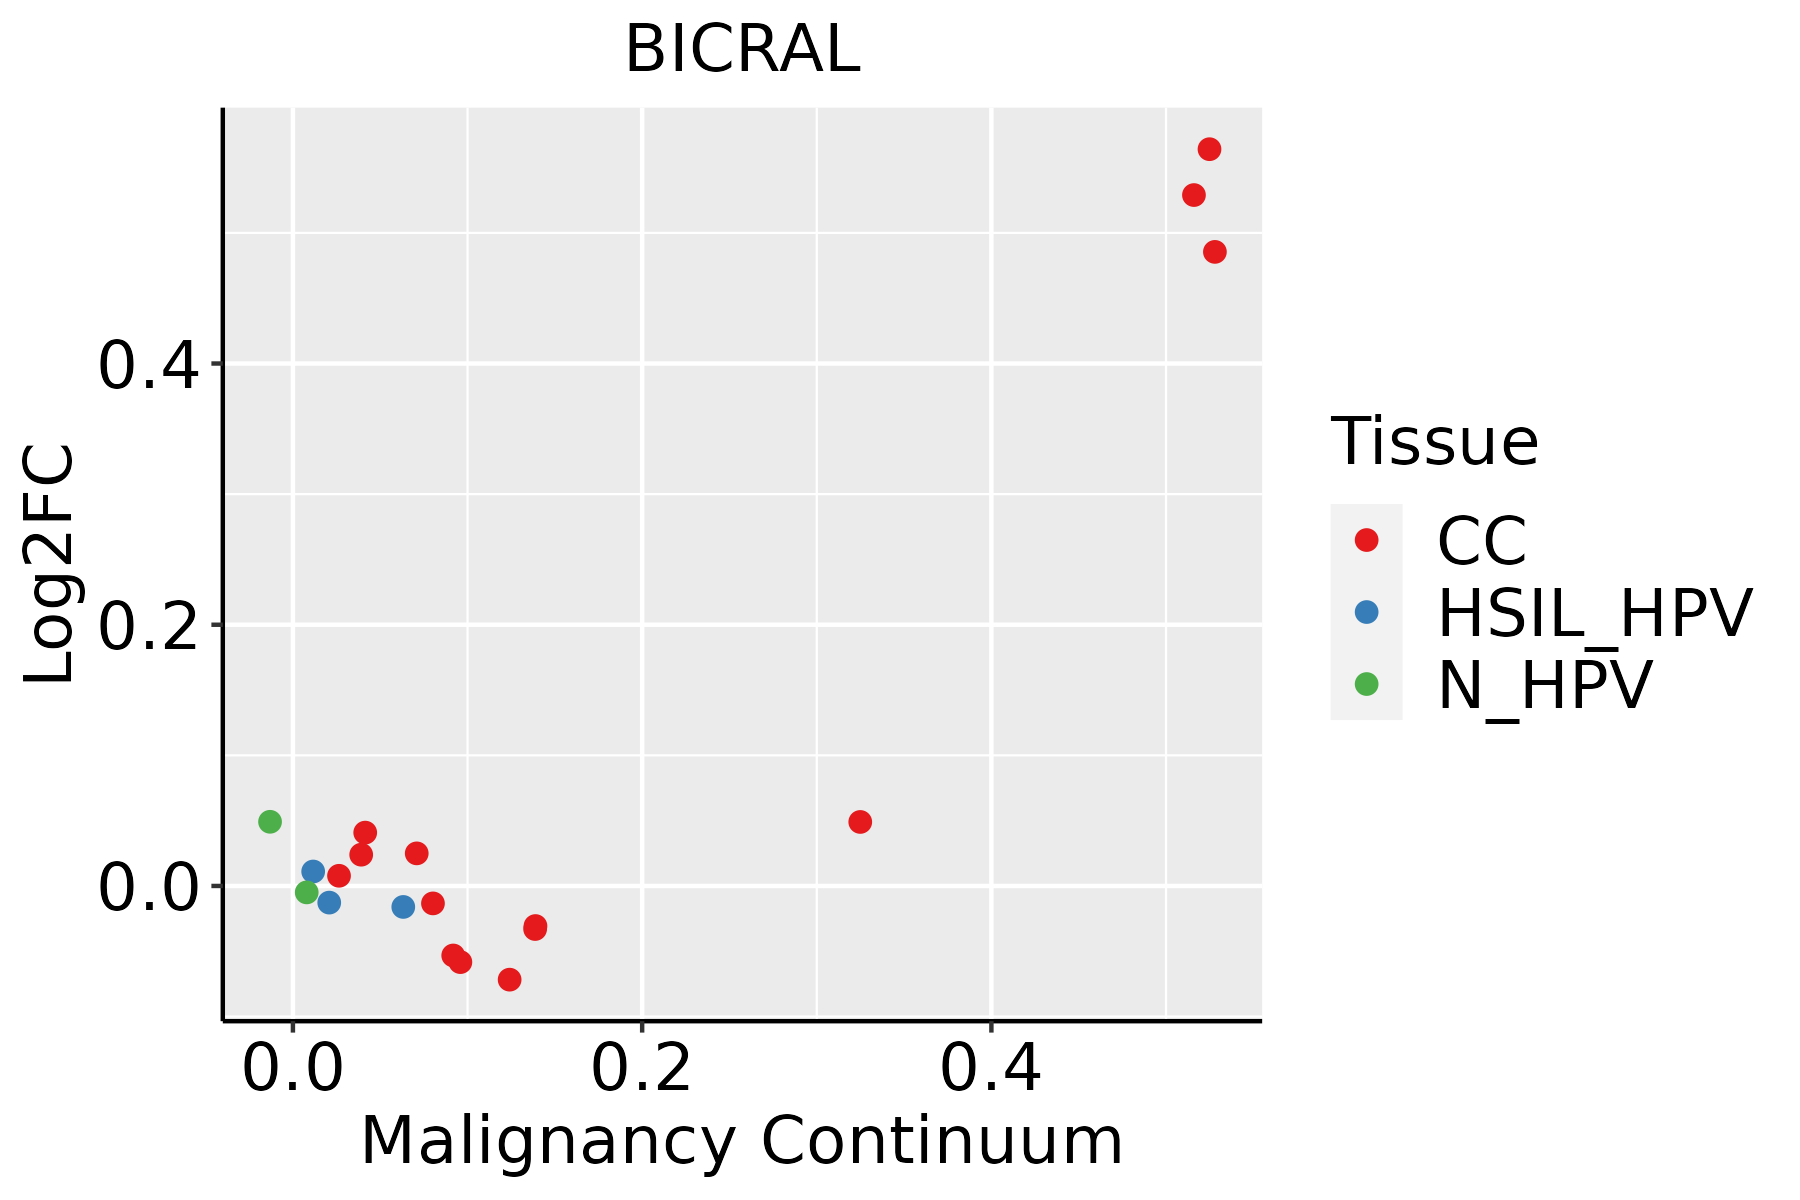 | CC: Cervix cancer |
| HSIL_HPV: HPV-infected high-grade squamous intraepithelial lesions | ||
| N_HPV: HPV-infected normal cervix | ||
| Colorectum (GSE201348) |  | FAP: Familial adenomatous polyposis |
| CRC: Colorectal cancer | ||
| Colorectum (HTA11) | 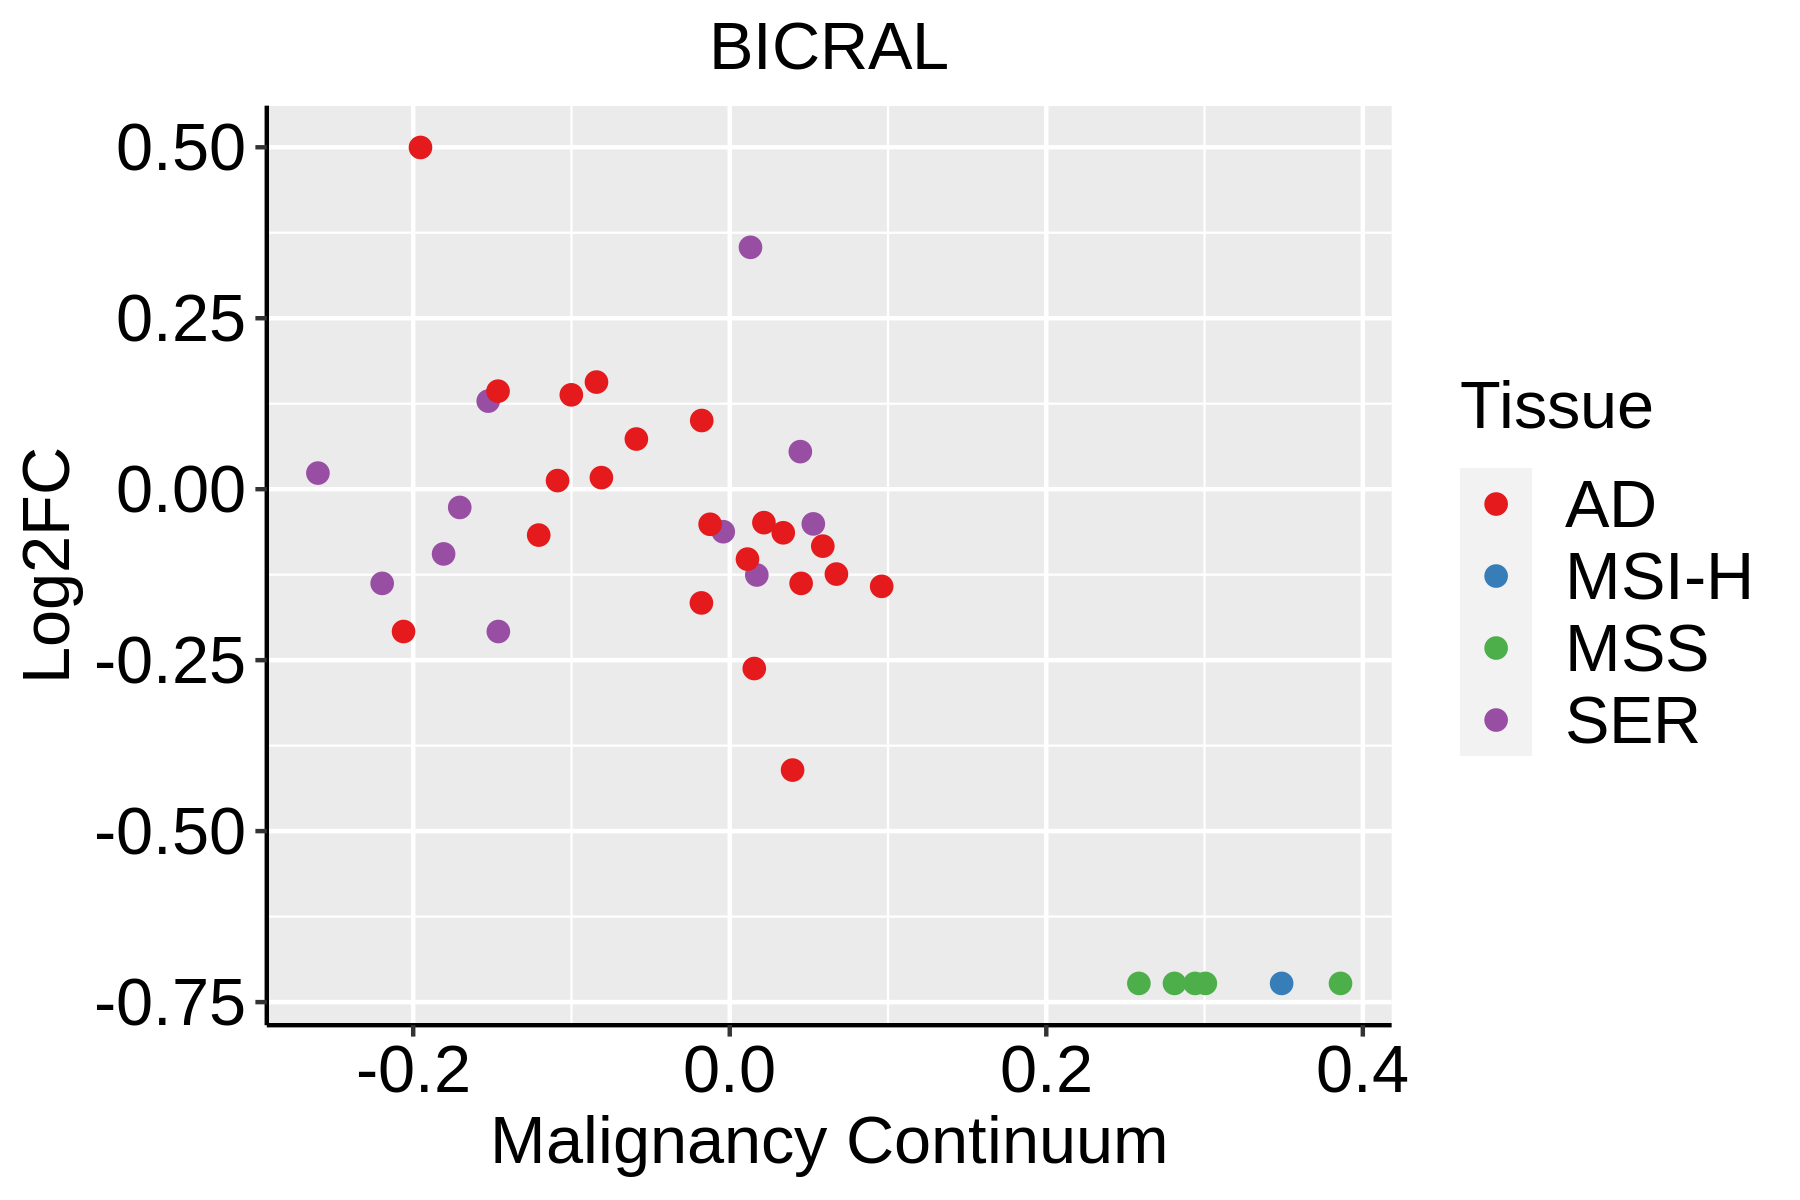 | AD: Adenomas |
| SER: Sessile serrated lesions | ||
| MSI-H: Microsatellite-high colorectal cancer | ||
| MSS: Microsatellite stable colorectal cancer | ||
| Lung | 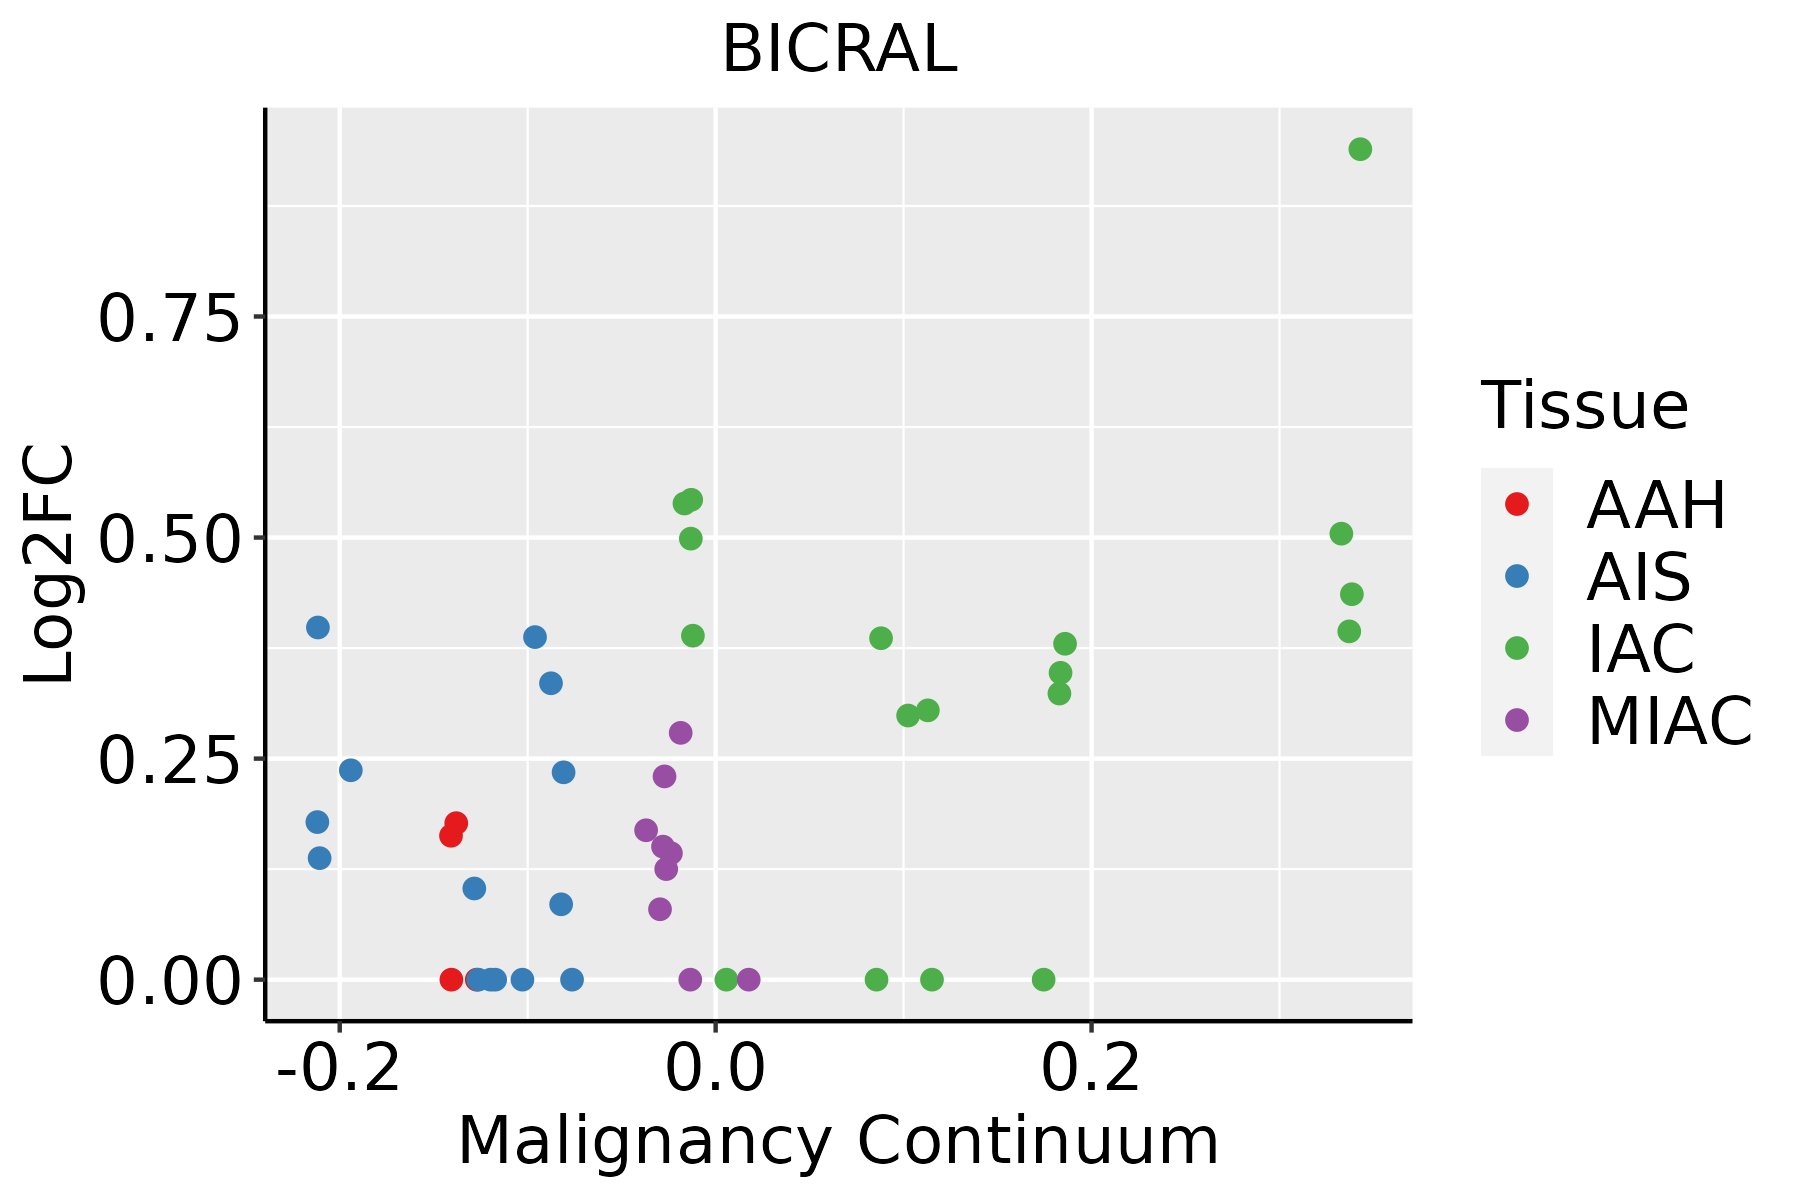 | AAH: Atypical adenomatous hyperplasia |
| AIS: Adenocarcinoma in situ | ||
| IAC: Invasive lung adenocarcinoma | ||
| MIA: Minimally invasive adenocarcinoma |
| ∗log2FC in expression of this searched gene in stem-like cells from each diseased tissue sample relative to stem-like cells in normal samples in each tissue plotted against the malignancy continuum. Samples are colored based on if they are from different disease stage. |
Top |
Malignant transformation related pathway analysis |
| Find out the enriched GO biological processes and KEGG pathways involved in transition from healthy to precancer to cancer |
| Tissue | Disease Stage | Enriched GO biological Processes |
| Breast | Precancer |  |
| Breast | IDC |  |
| Breast | DCIS |  |
| Cervix | CC |  |
| Cervix | HSIL_HPV |  |
| ∗Top 15 enriched GO BP terms are showed in the bar plot of each disease state in each tissue. Each row represents a significant GO biological process which is colored according to the -log10(p.adjust). |
| Page: 1 2 3 4 5 6 7 8 9 |
| GO ID | Tissue | Disease Stage | Description | Gene Ratio | Bg Ratio | pvalue | p.adjust | Count |
| Page: 1 |
| Pathway ID | Tissue | Disease Stage | Description | Gene Ratio | Bg Ratio | pvalue | p.adjust | qvalue | Count |
| Page: 1 |
Top |
Cell-cell communication analysis |
| Identification of potential cell-cell interactions between two cell types and their ligand-receptor pairs for different disease states |
| Ligand | Receptor | LRpair | Pathway | Tissue | Disease Stage |
| Page: 1 |
Top |
Single-cell gene regulatory network inference analysis |
| Find out the significant the regulons (TFs) and the target genes of each regulon across cell types for different disease states |
| TF | Cell Type | Tissue | Disease Stage | Target Gene | RSS | Regulon Activity |
| ∗The dot plots of a searched regulon are shown for all cell subpopulations in each disease state of each tissue based on the regulon specific score inferred using pySCENIC and by calculating the average expression. |
| Page: 1 |
Top |
Somatic mutation of malignant transformation related genes |
| Annotation of somatic variants for genes involved in malignant transformation |
| Hugo Symbol | Variant Class | Variant Classification | dbSNP RS | HGVSc | HGVSp | HGVSp Short | SWISSPROT | BIOTYPE | SIFT | PolyPhen | Tumor Sample Barcode | Tissue | Histology | Sex | Age | Stage | Therapy Types | Drugs | Outcome |
| Page: 1 |
Top |
Related drugs of malignant transformation related genes |
| Identification of chemicals and drugs interact with genes involved in malignant transfromation |
| (DGIdb 4.0) |
| Entrez ID | Symbol | Category | Interaction Types | Drug Claim Name | Drug Name | PMIDs |
| Page: 1 |

Copyright 2023-Present -The University of Texas Health Science Center at Houston |