
|
|||||
|
 | |
| |
| |
| |
| |
| |
|
Gene: ZNF581 |
Gene summary for ZNF581 |
| Gene information | Species | Human | Gene symbol | ZNF581 | Gene ID | 51545 |
| Gene name | zinc finger protein 581 | |
| Gene Alias | HSPC189 | |
| Cytomap | 19q13.42 | |
| Gene Type | protein-coding | GO ID | GO:0006139 | UniProtAcc | Q9P0T4 |
Top |
Malignant transformation analysis |
| Identification of the aberrant gene expression in precancerous and cancerous lesions by comparing the gene expression of stem-like cells in diseased tissues with normal stem cells |
| Entrez ID | Symbol | Replicates | Species | Organ | Tissue | Adj P-value | Log2FC | Malignancy |
| 51545 | ZNF581 | HTA11_3410_2000001011 | Human | Colorectum | AD | 9.84e-06 | 1.39e-01 | 0.0155 |
| 51545 | ZNF581 | HTA11_2487_2000001011 | Human | Colorectum | SER | 3.87e-02 | 1.35e-01 | -0.1808 |
| 51545 | ZNF581 | HTA11_1938_2000001011 | Human | Colorectum | AD | 9.49e-04 | 1.63e-01 | -0.0811 |
| 51545 | ZNF581 | HTA11_347_2000001011 | Human | Colorectum | AD | 3.95e-04 | 1.27e-01 | -0.1954 |
| 51545 | ZNF581 | HTA11_2112_2000001011 | Human | Colorectum | SER | 1.71e-03 | 2.44e-01 | -0.2196 |
| 51545 | ZNF581 | HTA11_696_2000001011 | Human | Colorectum | AD | 2.05e-06 | 1.63e-01 | -0.1464 |
| 51545 | ZNF581 | HTA11_866_2000001011 | Human | Colorectum | AD | 8.13e-03 | 1.19e-01 | -0.1001 |
| 51545 | ZNF581 | HTA11_1391_2000001011 | Human | Colorectum | AD | 3.65e-10 | 2.56e-01 | -0.059 |
| 51545 | ZNF581 | HTA11_866_3004761011 | Human | Colorectum | AD | 9.05e-12 | 2.77e-01 | 0.096 |
| 51545 | ZNF581 | HTA11_9408_2000001011 | Human | Colorectum | AD | 2.32e-08 | 5.56e-01 | 0.0451 |
| 51545 | ZNF581 | HTA11_8622_2000001021 | Human | Colorectum | SER | 3.19e-02 | 1.83e-01 | 0.0528 |
| 51545 | ZNF581 | HTA11_10623_2000001011 | Human | Colorectum | AD | 1.36e-03 | 1.87e-01 | -0.0177 |
| 51545 | ZNF581 | HTA11_10711_2000001011 | Human | Colorectum | AD | 6.48e-11 | 3.20e-01 | 0.0338 |
| 51545 | ZNF581 | HTA11_7696_3000711011 | Human | Colorectum | AD | 2.21e-31 | 5.96e-01 | 0.0674 |
| 51545 | ZNF581 | HTA11_6818_2000001011 | Human | Colorectum | AD | 4.13e-05 | 2.56e-01 | 0.0112 |
| 51545 | ZNF581 | HTA11_99999970781_79442 | Human | Colorectum | MSS | 7.11e-14 | 2.80e-01 | 0.294 |
| 51545 | ZNF581 | HTA11_99999971662_82457 | Human | Colorectum | MSS | 1.23e-23 | 4.08e-01 | 0.3859 |
| 51545 | ZNF581 | HTA11_99999973899_84307 | Human | Colorectum | MSS | 2.92e-03 | 1.84e-01 | 0.2585 |
| 51545 | ZNF581 | HTA11_99999974143_84620 | Human | Colorectum | MSS | 2.10e-17 | 3.50e-01 | 0.3005 |
| 51545 | ZNF581 | LZE4T | Human | Esophagus | ESCC | 6.73e-13 | 3.42e-01 | 0.0811 |
| Page: 1 2 3 4 5 6 7 |
| Tissue | Expression Dynamics | Abbreviation |
| Colorectum (GSE201348) |  | FAP: Familial adenomatous polyposis |
| CRC: Colorectal cancer | ||
| Colorectum (HTA11) |  | AD: Adenomas |
| SER: Sessile serrated lesions | ||
| MSI-H: Microsatellite-high colorectal cancer | ||
| MSS: Microsatellite stable colorectal cancer | ||
| Esophagus | 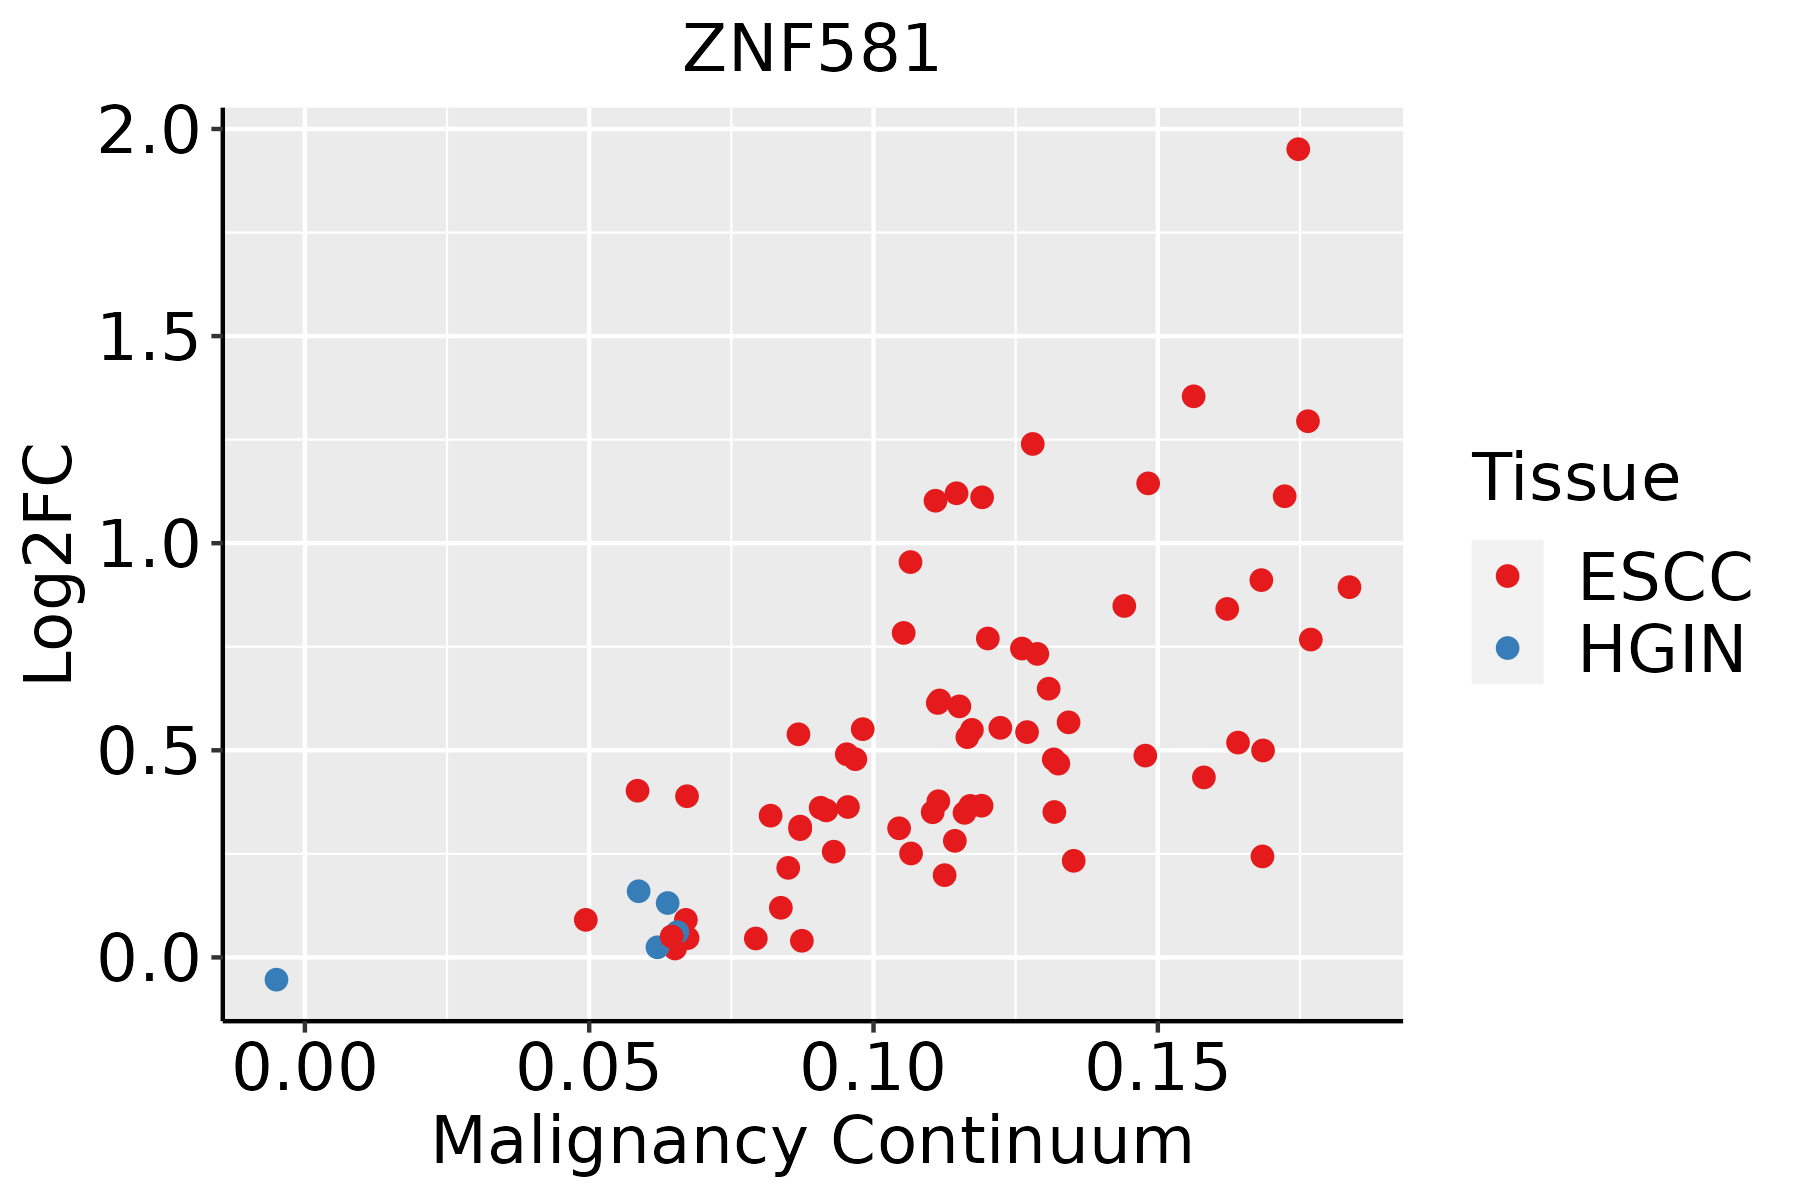 | ESCC: Esophageal squamous cell carcinoma |
| HGIN: High-grade intraepithelial neoplasias | ||
| LGIN: Low-grade intraepithelial neoplasias | ||
| Liver | 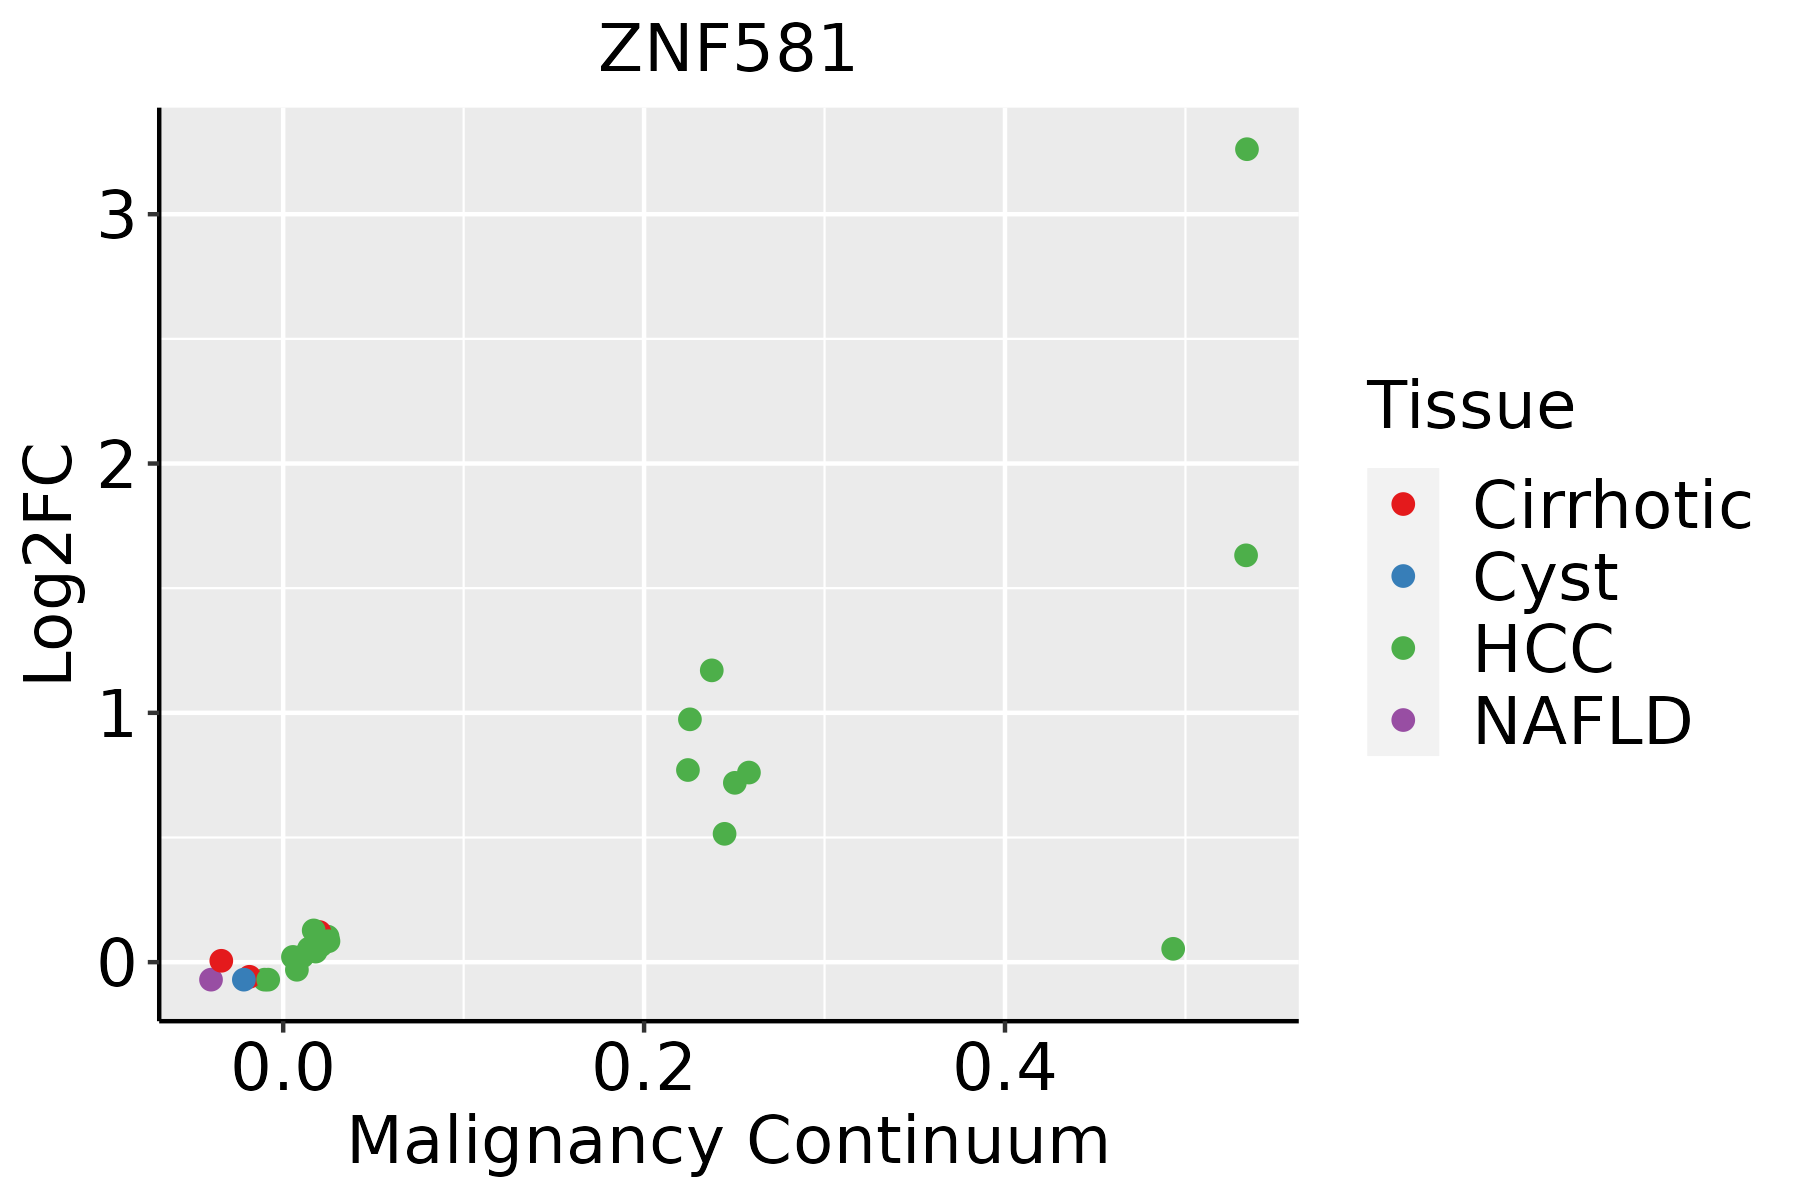 | HCC: Hepatocellular carcinoma |
| NAFLD: Non-alcoholic fatty liver disease | ||
| Oral Cavity | 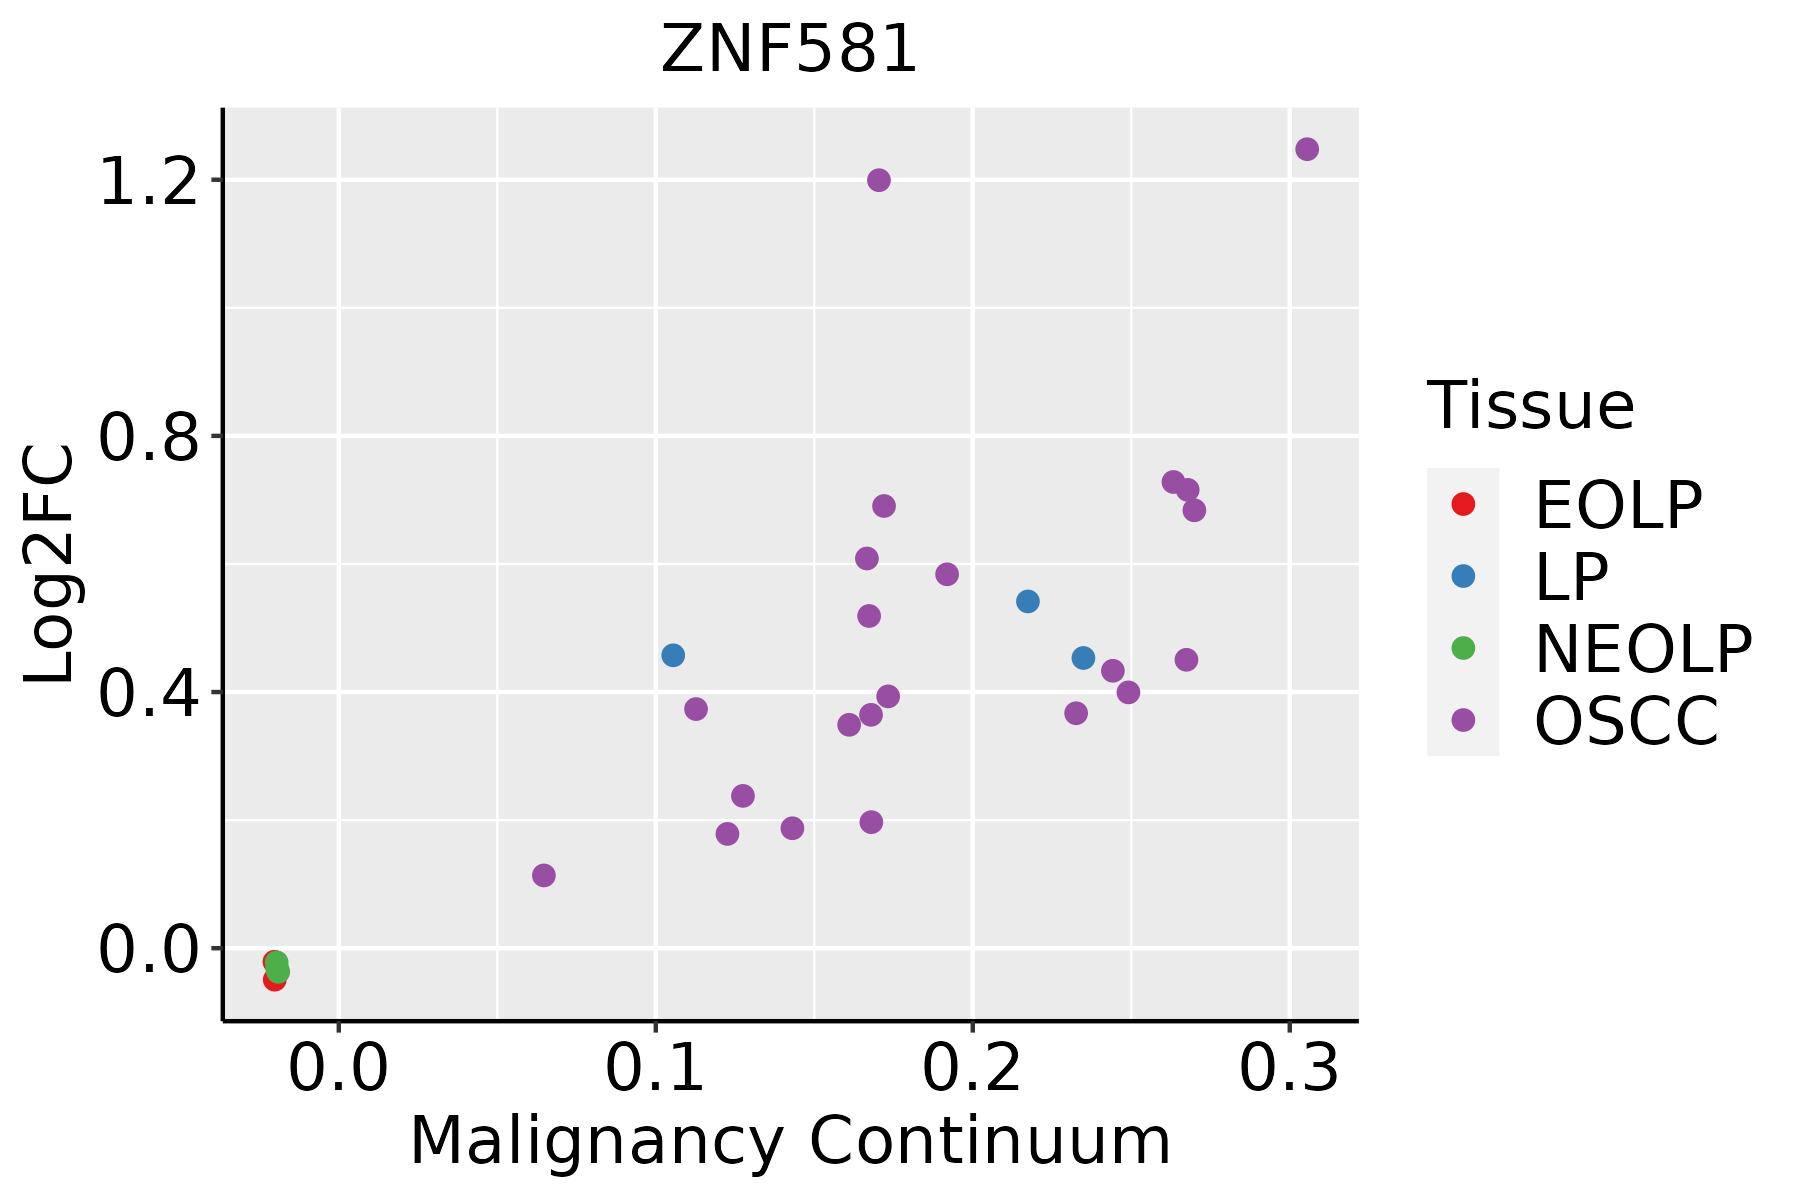 | EOLP: Erosive Oral lichen planus |
| LP: leukoplakia | ||
| NEOLP: Non-erosive oral lichen planus | ||
| OSCC: Oral squamous cell carcinoma | ||
| Thyroid |  | ATC: Anaplastic thyroid cancer |
| HT: Hashimoto's thyroiditis | ||
| PTC: Papillary thyroid cancer |
| ∗log2FC in expression of this searched gene in stem-like cells from each diseased tissue sample relative to stem-like cells in normal samples in each tissue plotted against the malignancy continuum. Samples are colored based on if they are from different disease stage. |
Top |
Malignant transformation related pathway analysis |
| Find out the enriched GO biological processes and KEGG pathways involved in transition from healthy to precancer to cancer |
| Tissue | Disease Stage | Enriched GO biological Processes |
| Liver | Cyst |  |
| Lung | IAC |  |
| Lung | AIS |  |
| Lung | AAH |  |
| Lung | MIAC |  |
| ∗Top 15 enriched GO BP terms are showed in the bar plot of each disease state in each tissue. Each row represents a significant GO biological process which is colored according to the -log10(p.adjust). |
| Page: 1 2 3 4 5 6 7 8 9 |
| GO ID | Tissue | Disease Stage | Description | Gene Ratio | Bg Ratio | pvalue | p.adjust | Count |
| Page: 1 |
| Pathway ID | Tissue | Disease Stage | Description | Gene Ratio | Bg Ratio | pvalue | p.adjust | qvalue | Count |
| Page: 1 |
Top |
Cell-cell communication analysis |
| Identification of potential cell-cell interactions between two cell types and their ligand-receptor pairs for different disease states |
| Ligand | Receptor | LRpair | Pathway | Tissue | Disease Stage |
| Page: 1 |
Top |
Single-cell gene regulatory network inference analysis |
| Find out the significant the regulons (TFs) and the target genes of each regulon across cell types for different disease states |
| TF | Cell Type | Tissue | Disease Stage | Target Gene | RSS | Regulon Activity |
| ZNF581 | MAST | Cervix | ADJ | TPSAB1,TCEAL3,SIGLEC6, etc. | 4.32e-01 |  |
| ZNF581 | MAST | Cervix | CC | TPSAB1,TCEAL3,SIGLEC6, etc. | 8.90e-02 |  |
| ZNF581 | BN | Cervix | Healthy | TPSAB1,TCEAL3,SIGLEC6, etc. | 8.13e-02 |  |
| ZNF581 | MAST | Cervix | HSIL_HPV | TPSAB1,TCEAL3,SIGLEC6, etc. | 2.57e-01 |  |
| ZNF581 | BN | Cervix | N_HPV | TPSAB1,TCEAL3,SIGLEC6, etc. | 1.23e-01 |  |
| ZNF581 | M2MAC | Esophagus | ADJ | BOD1,DVL1,MRPL48, etc. | 2.37e-01 |  |
| ZNF581 | M2MAC | Esophagus | ESCC | BOD1,DVL1,MRPL48, etc. | 2.39e-01 |  |
| ZNF581 | SEC | Liver | Cirrhotic | METTL18,GEMIN4,FCN2, etc. | 1.11e-01 |  |
| ZNF581 | SEC | Liver | HCC | METTL18,GEMIN4,FCN2, etc. | 1.43e-01 |  |
| ZNF581 | PVA | Liver | HCC | METTL18,GEMIN4,FCN2, etc. | 1.88e-02 | |
| ∗The dot plots of a searched regulon are shown for all cell subpopulations in each disease state of each tissue based on the regulon specific score inferred using pySCENIC and by calculating the average expression. |
| Page: 1 |
Top |
Somatic mutation of malignant transformation related genes |
| Annotation of somatic variants for genes involved in malignant transformation |
| Hugo Symbol | Variant Class | Variant Classification | dbSNP RS | HGVSc | HGVSp | HGVSp Short | SWISSPROT | BIOTYPE | SIFT | PolyPhen | Tumor Sample Barcode | Tissue | Histology | Sex | Age | Stage | Therapy Types | Drugs | Outcome |
| ZNF581 | insertion | In_Frame_Ins | novel | c.221_222insGCCAGGGGCCAGTGTGGCTCCAGGCCAGAAAAAGTGCAACAGCTG | p.Ser78_Gly79insValAlaProGlyGlnLysLysCysAsnSerTrpProGlyAlaSer | p.S78_G79insVAPGQKKCNSWPGAS | Q9P0T4 | protein_coding | TCGA-A7-A0DB-01 | Breast | breast invasive carcinoma | Female | <65 | I/II | Hormone Therapy | arimidex | SD | ||
| ZNF581 | SNV | Missense_Mutation | novel | c.47C>T | p.Ser16Phe | p.S16F | Q9P0T4 | protein_coding | tolerated(0.08) | possibly_damaging(0.837) | TCGA-C5-A2LV-01 | Cervix | cervical & endocervical cancer | Female | <65 | I/II | Unknown | Unknown | SD |
| ZNF581 | SNV | Missense_Mutation | c.329N>G | p.Ser110Trp | p.S110W | Q9P0T4 | protein_coding | deleterious(0) | probably_damaging(1) | TCGA-EA-A439-01 | Cervix | cervical & endocervical cancer | Female | <65 | I/II | Unknown | Unknown | PD | |
| ZNF581 | SNV | Missense_Mutation | novel | c.142N>T | p.Pro48Ser | p.P48S | Q9P0T4 | protein_coding | tolerated(0.53) | benign(0) | TCGA-HM-A4S6-01 | Cervix | cervical & endocervical cancer | Female | <65 | III/IV | Chemotherapy | cisplatin | CR |
| ZNF581 | SNV | Missense_Mutation | c.289G>A | p.Glu97Lys | p.E97K | Q9P0T4 | protein_coding | tolerated(0.35) | benign(0.148) | TCGA-AA-3984-01 | Colorectum | colon adenocarcinoma | Female | <65 | I/II | Unknown | Unknown | SD | |
| ZNF581 | SNV | Missense_Mutation | novel | c.63G>T | p.Glu21Asp | p.E21D | Q9P0T4 | protein_coding | tolerated(0.2) | benign(0.005) | TCGA-AA-A010-01 | Colorectum | colon adenocarcinoma | Female | <65 | I/II | Chemotherapy | folinic | CR |
| ZNF581 | deletion | Frame_Shift_Del | c.17delN | p.Cys8AlafsTer105 | p.C8Afs*105 | Q9P0T4 | protein_coding | TCGA-DM-A1HB-01 | Colorectum | colon adenocarcinoma | Male | >=65 | III/IV | Unknown | Unknown | SD | |||
| ZNF581 | SNV | Missense_Mutation | novel | c.63G>T | p.Glu21Asp | p.E21D | Q9P0T4 | protein_coding | tolerated(0.2) | benign(0.005) | TCGA-A5-A0G2-01 | Endometrium | uterine corpus endometrioid carcinoma | Female | <65 | III/IV | Unknown | Unknown | SD |
| ZNF581 | SNV | Missense_Mutation | novel | c.238G>A | p.Ala80Thr | p.A80T | Q9P0T4 | protein_coding | tolerated(0.53) | benign(0.006) | TCGA-AP-A1DK-01 | Endometrium | uterine corpus endometrioid carcinoma | Female | <65 | I/II | Unknown | Unknown | SD |
| ZNF581 | SNV | Missense_Mutation | novel | c.339N>T | p.Lys113Asn | p.K113N | Q9P0T4 | protein_coding | deleterious(0) | probably_damaging(0.996) | TCGA-AX-A0J1-01 | Endometrium | uterine corpus endometrioid carcinoma | Female | >=65 | I/II | Unknown | Unknown | SD |
| Page: 1 2 3 |
Top |
Related drugs of malignant transformation related genes |
| Identification of chemicals and drugs interact with genes involved in malignant transfromation |
| (DGIdb 4.0) |
| Entrez ID | Symbol | Category | Interaction Types | Drug Claim Name | Drug Name | PMIDs |
| Page: 1 |

Copyright 2023-Present -The University of Texas Health Science Center at Houston |