
|
|||||
|
 | |
| |
| |
| |
| |
| |
|
Gene: TCEB1 |
Gene summary for TCEB1 |
| Gene information | Species | Human | Gene symbol | TCEB1 | Gene ID | 6921 |
| Gene name | elongin C | |
| Gene Alias | SIII | |
| Cytomap | 8q21.11 | |
| Gene Type | protein-coding | GO ID | GO:0006139 | UniProtAcc | A0A024R7Y5 |
Top |
Malignant transformation analysis |
| Identification of the aberrant gene expression in precancerous and cancerous lesions by comparing the gene expression of stem-like cells in diseased tissues with normal stem cells |
| Entrez ID | Symbol | Replicates | Species | Organ | Tissue | Adj P-value | Log2FC | Malignancy |
| 6921 | TCEB1 | AEH-subject1 | Human | Endometrium | AEH | 1.03e-42 | -6.09e-01 | -0.3059 |
| 6921 | TCEB1 | AEH-subject2 | Human | Endometrium | AEH | 2.41e-40 | -6.09e-01 | -0.2525 |
| 6921 | TCEB1 | AEH-subject3 | Human | Endometrium | AEH | 8.08e-46 | -6.09e-01 | -0.2576 |
| 6921 | TCEB1 | AEH-subject4 | Human | Endometrium | AEH | 1.30e-31 | -6.09e-01 | -0.2657 |
| 6921 | TCEB1 | AEH-subject5 | Human | Endometrium | AEH | 8.08e-46 | -6.09e-01 | -0.2953 |
| 6921 | TCEB1 | EEC-subject1 | Human | Endometrium | EEC | 2.82e-42 | -6.09e-01 | -0.2682 |
| 6921 | TCEB1 | EEC-subject2 | Human | Endometrium | EEC | 4.92e-44 | -6.09e-01 | -0.2607 |
| 6921 | TCEB1 | EEC-subject3 | Human | Endometrium | EEC | 3.75e-43 | -6.09e-01 | -0.2525 |
| 6921 | TCEB1 | EEC-subject4 | Human | Endometrium | EEC | 1.03e-42 | -6.09e-01 | -0.2571 |
| 6921 | TCEB1 | EEC-subject5 | Human | Endometrium | EEC | 2.82e-42 | -6.09e-01 | -0.249 |
| 6921 | TCEB1 | GSM5276934 | Human | Endometrium | EEC | 4.92e-44 | -6.09e-01 | -0.0913 |
| 6921 | TCEB1 | GSM5276935 | Human | Endometrium | EEC | 1.03e-42 | -6.09e-01 | -0.123 |
| 6921 | TCEB1 | GSM5276937 | Human | Endometrium | EEC | 4.70e-38 | -6.09e-01 | -0.0897 |
| 6921 | TCEB1 | GSM6177620_NYU_UCEC1_lib1_lib1 | Human | Endometrium | EEC | 2.51e-33 | -6.09e-01 | -0.1869 |
| 6921 | TCEB1 | GSM6177620_NYU_UCEC1_lib2_lib2 | Human | Endometrium | EEC | 7.55e-30 | -6.09e-01 | -0.1875 |
| 6921 | TCEB1 | GSM6177620_NYU_UCEC1_lib3_lib3 | Human | Endometrium | EEC | 1.93e-34 | -6.09e-01 | -0.1883 |
| 6921 | TCEB1 | GSM6177621_NYU_UCEC2_lib1_lib1 | Human | Endometrium | EEC | 2.82e-42 | -6.09e-01 | -0.1934 |
| 6921 | TCEB1 | GSM6177622_NYU_UCEC3_lib1_lib1 | Human | Endometrium | EEC | 1.77e-44 | -6.09e-01 | -0.1917 |
| 6921 | TCEB1 | GSM6177622_NYU_UCEC3_lib2_lib2 | Human | Endometrium | EEC | 5.68e-44 | -6.09e-01 | -0.1916 |
| 6921 | TCEB1 | GSM6177623_NYU_UCEC3_Vis | Human | Endometrium | EEC | 1.03e-42 | -6.09e-01 | -0.1269 |
| Page: 1 2 3 4 5 6 7 8 9 10 11 |
| Tissue | Expression Dynamics | Abbreviation |
| Endometrium | 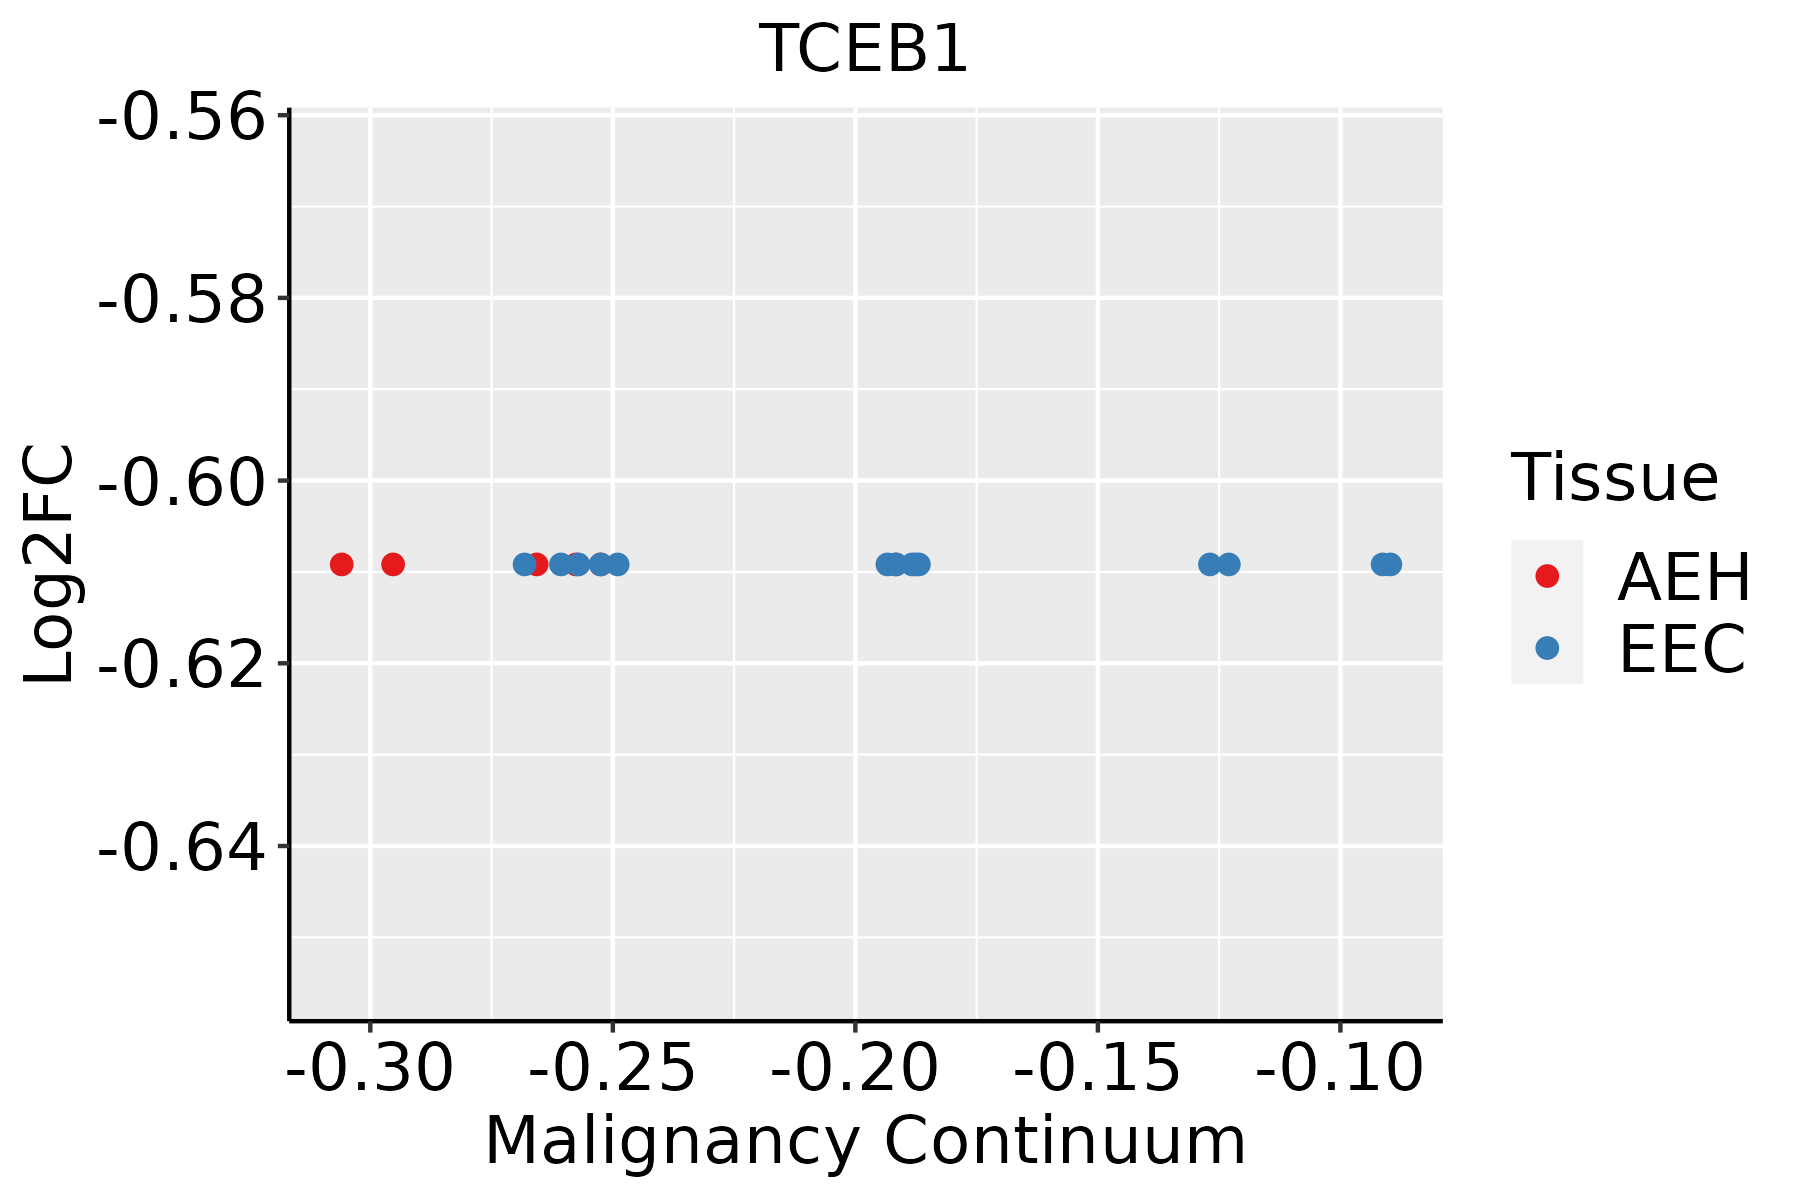 | AEH: Atypical endometrial hyperplasia |
| EEC: Endometrioid Cancer | ||
| Esophagus | 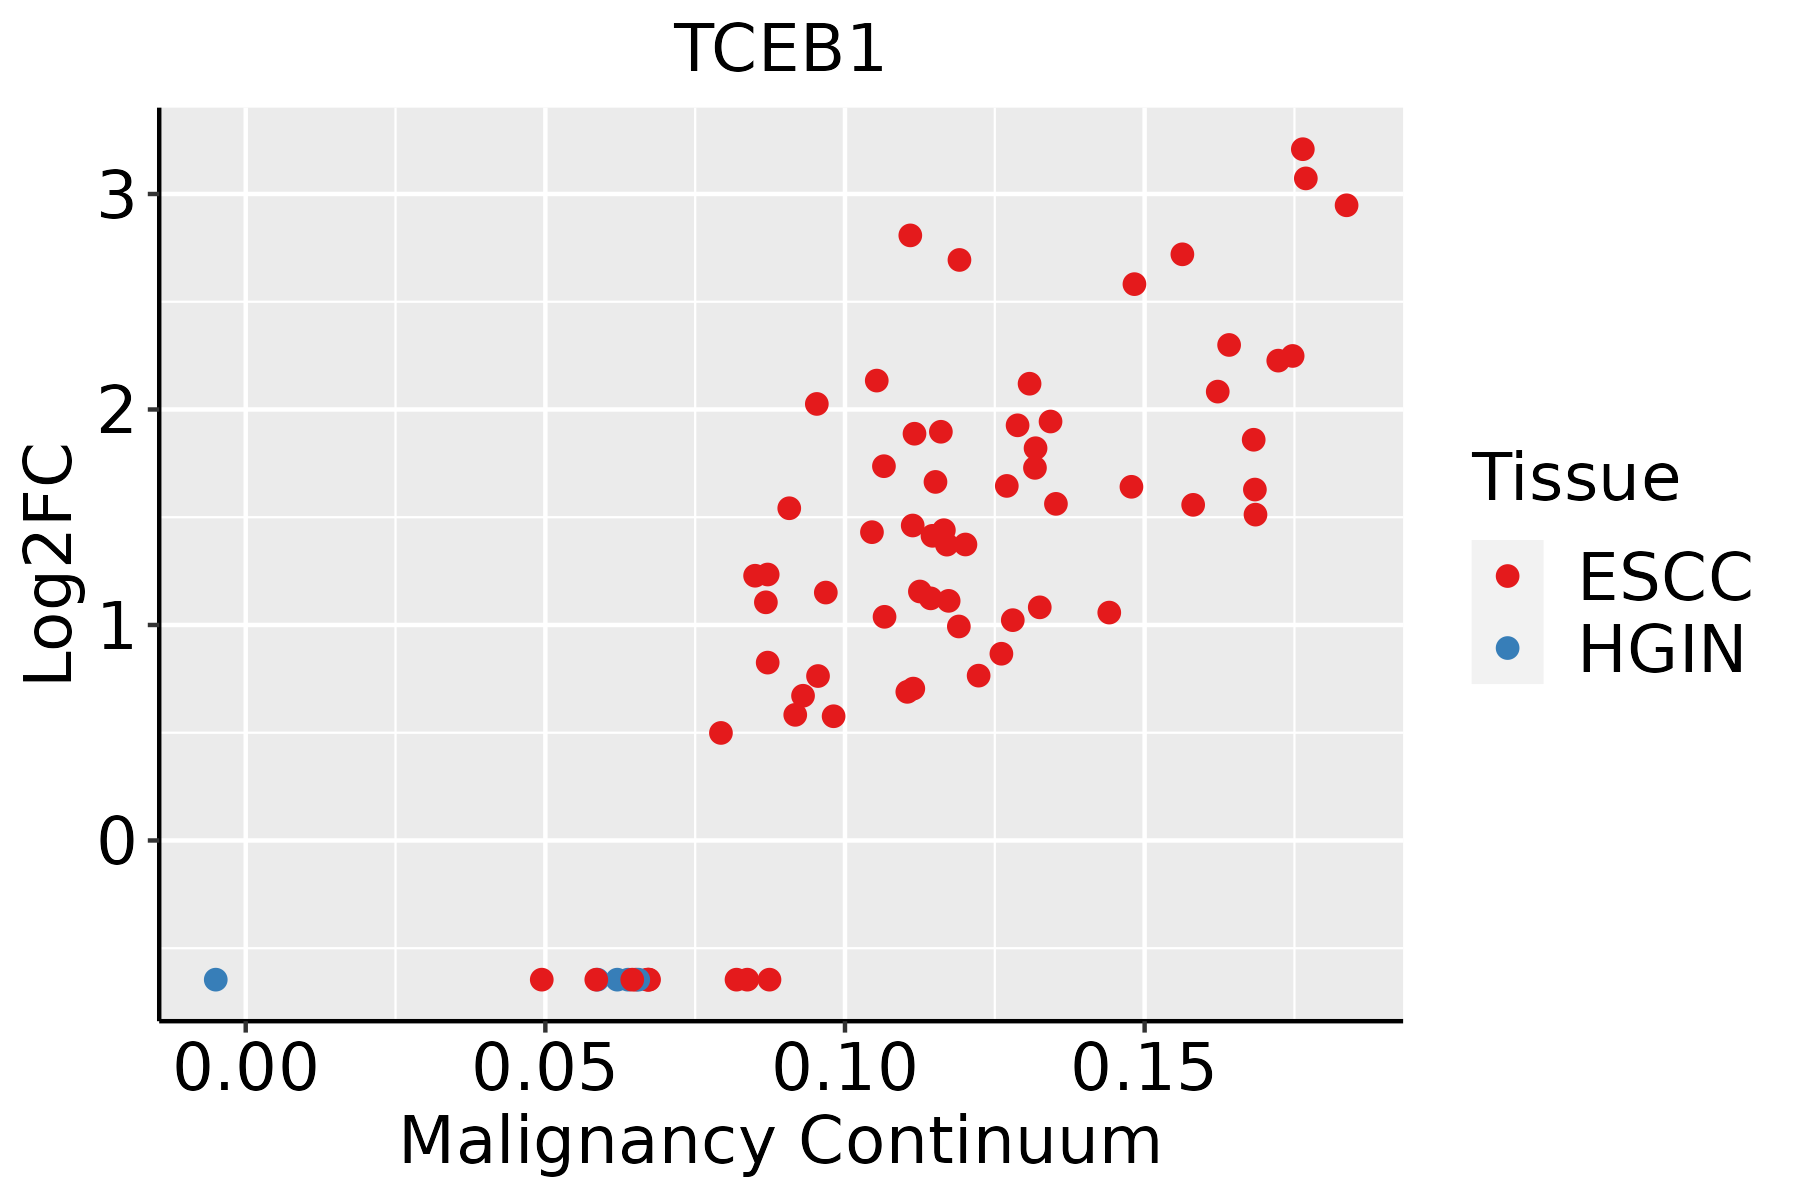 | ESCC: Esophageal squamous cell carcinoma |
| HGIN: High-grade intraepithelial neoplasias | ||
| LGIN: Low-grade intraepithelial neoplasias | ||
| GC | 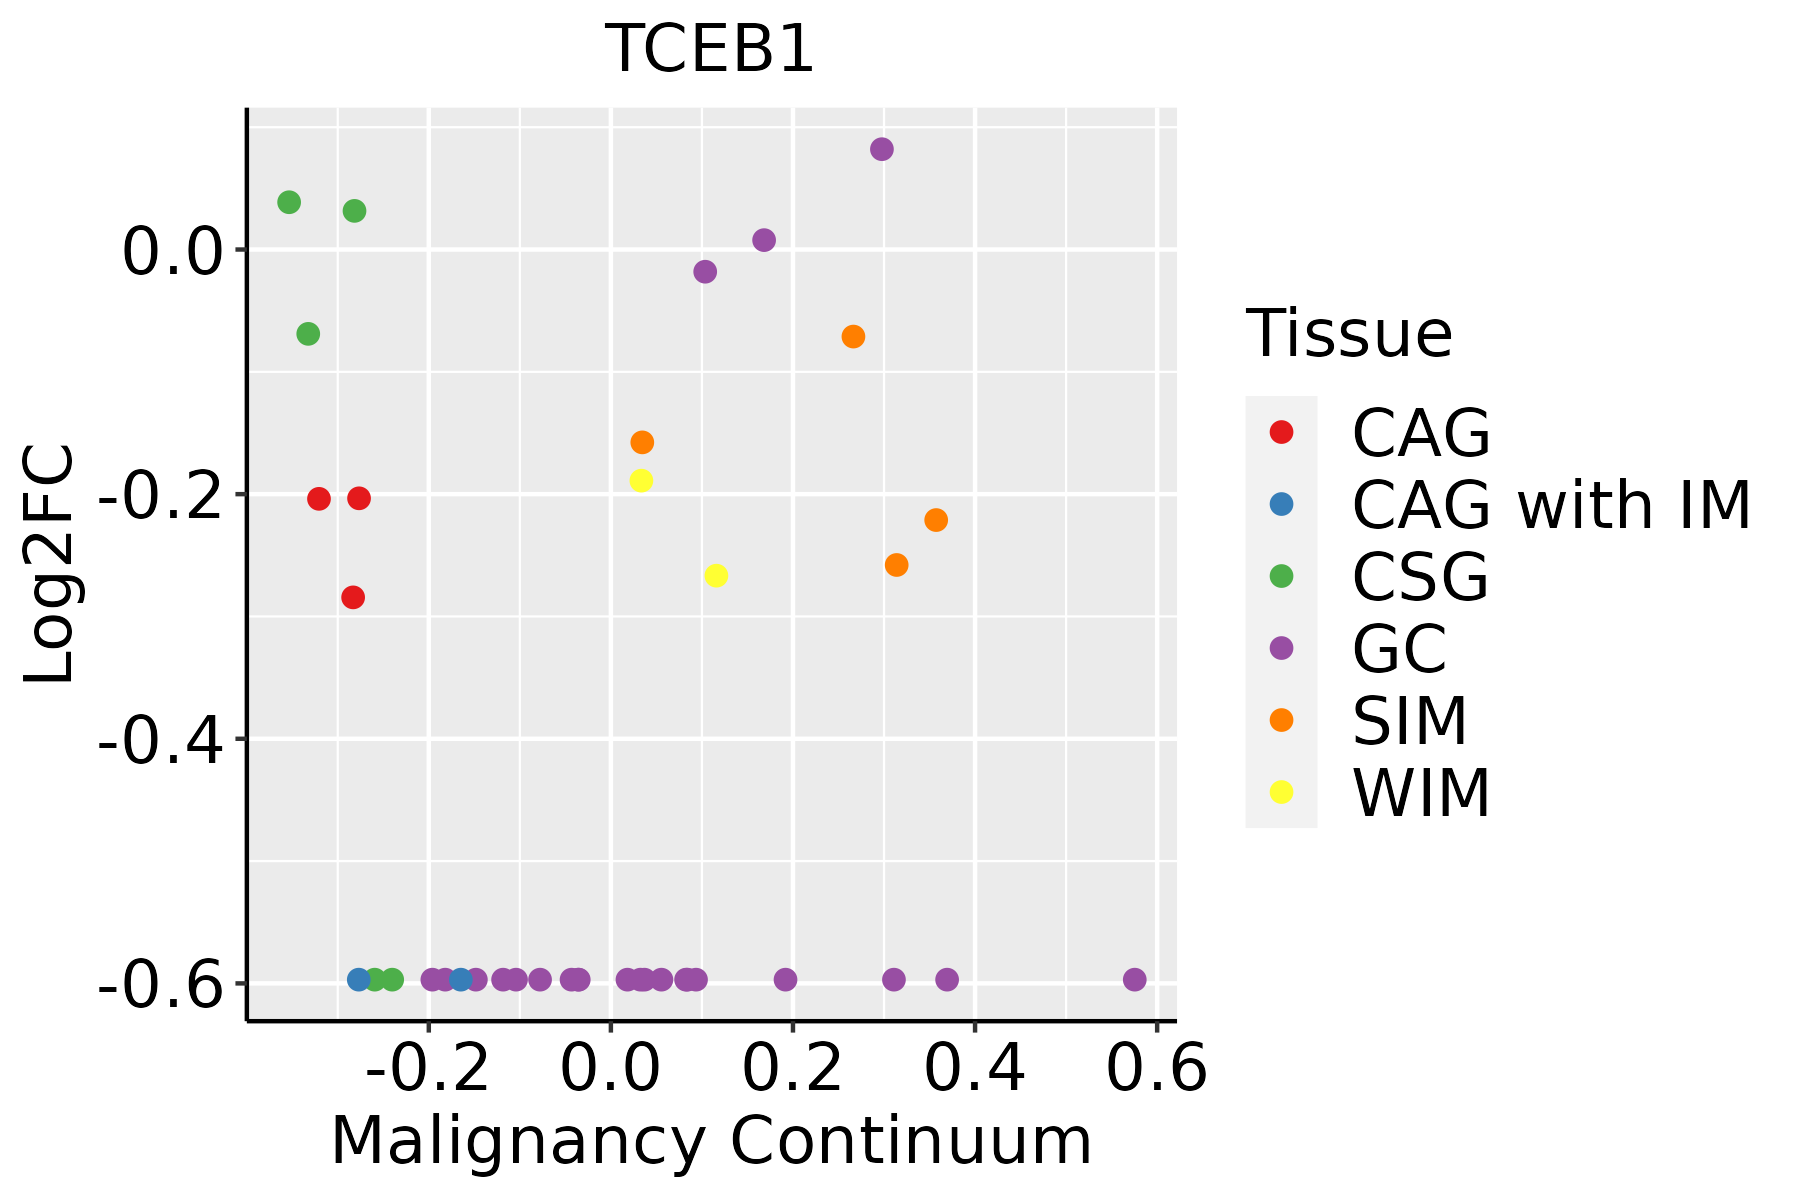 | CAG: Chronic atrophic gastritis |
| CAG with IM: Chronic atrophic gastritis with intestinal metaplasia | ||
| CSG: Chronic superficial gastritis | ||
| GC: Gastric cancer | ||
| SIM: Severe intestinal metaplasia | ||
| WIM: Wild intestinal metaplasia | ||
| Liver |  | HCC: Hepatocellular carcinoma |
| NAFLD: Non-alcoholic fatty liver disease | ||
| Oral Cavity | 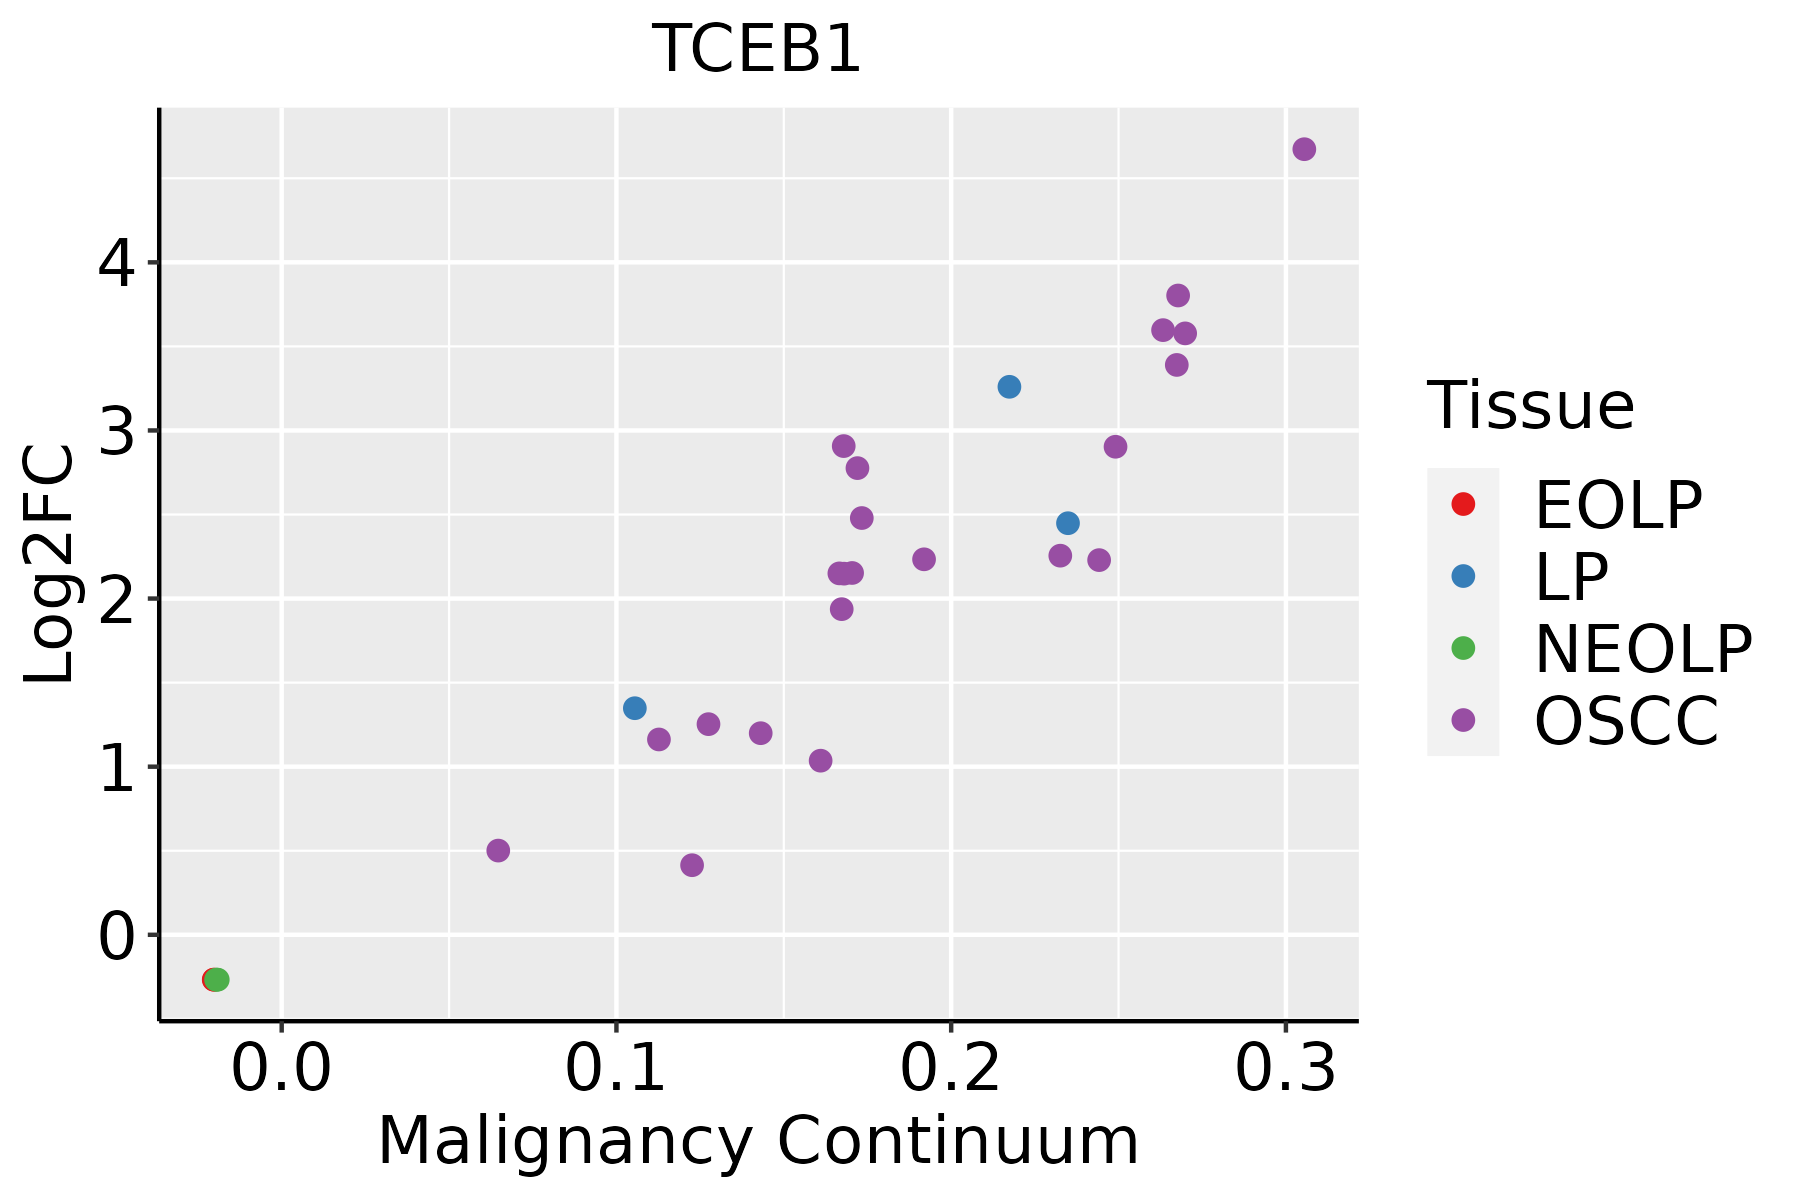 | EOLP: Erosive Oral lichen planus |
| LP: leukoplakia | ||
| NEOLP: Non-erosive oral lichen planus | ||
| OSCC: Oral squamous cell carcinoma | ||
| Prostate | 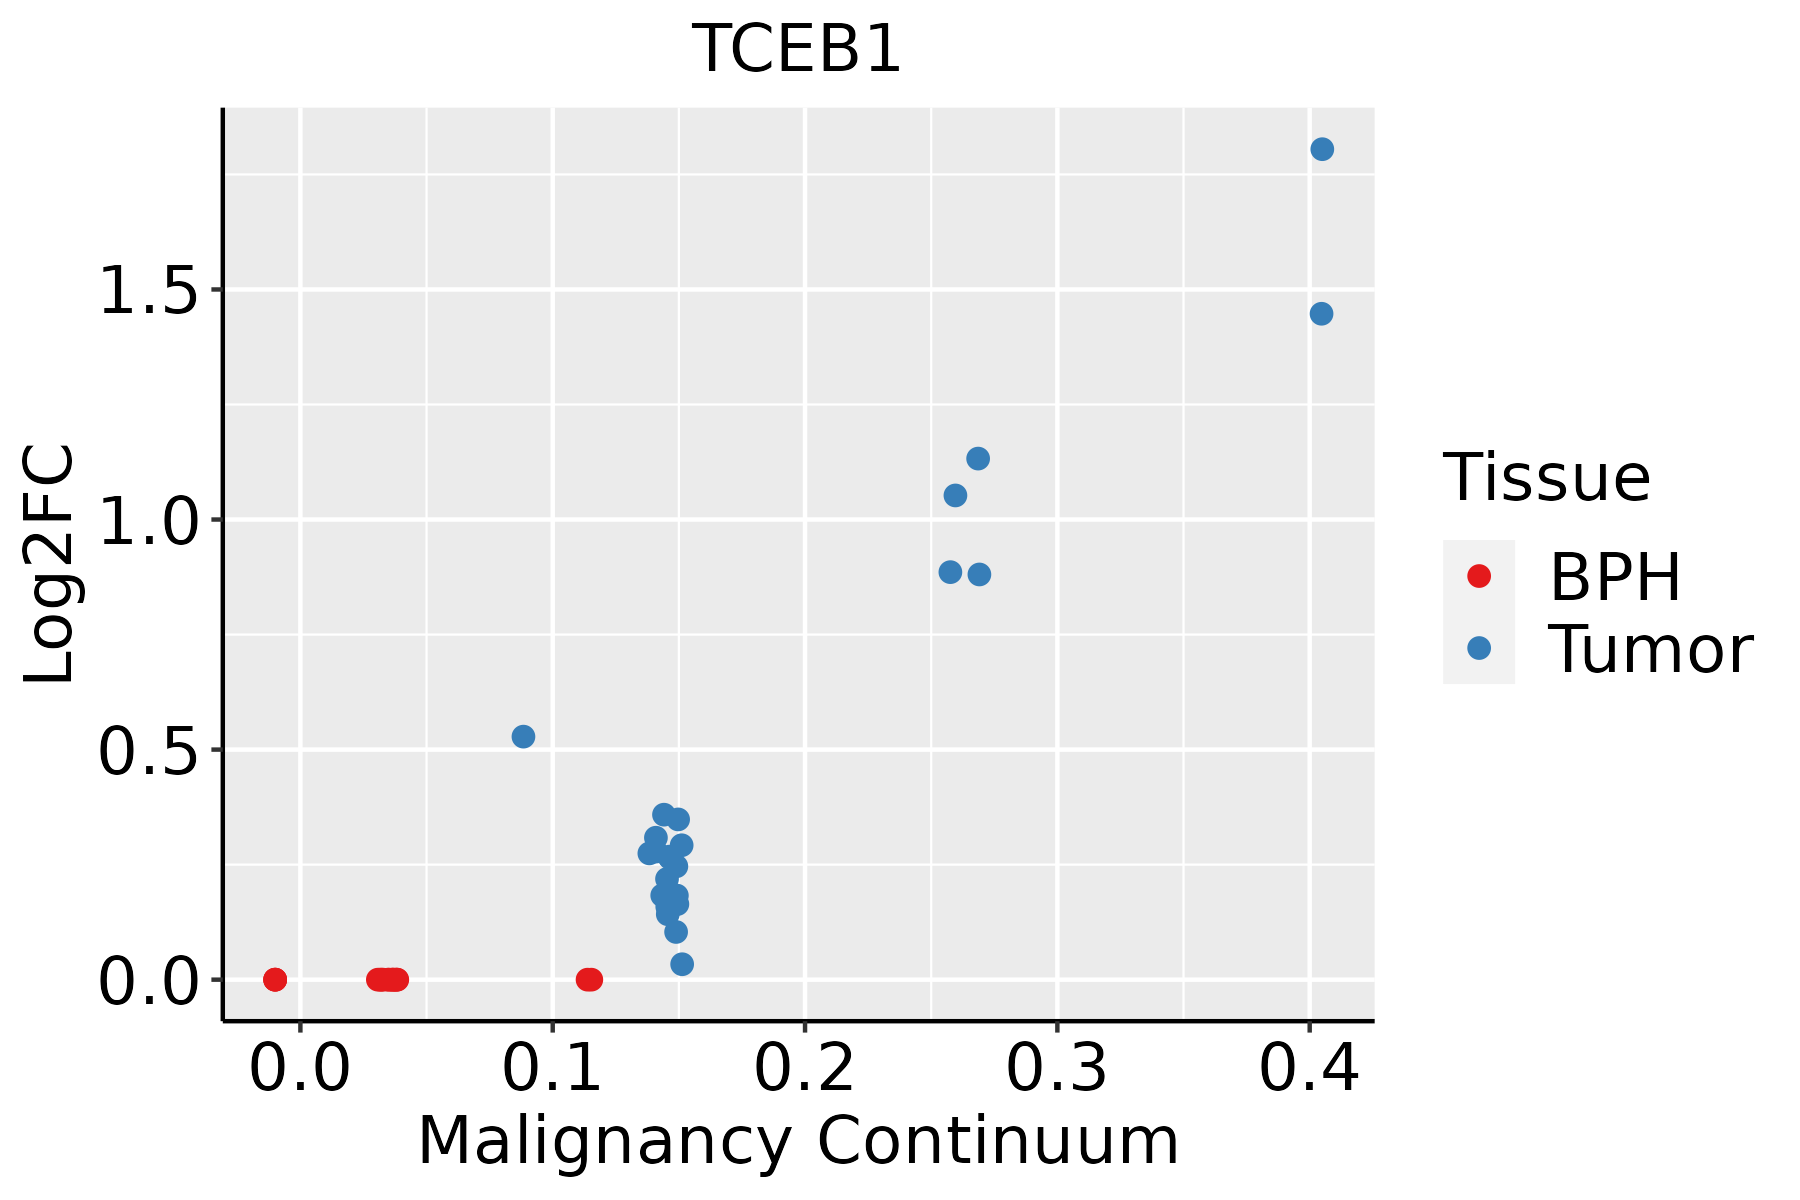 | BPH: Benign Prostatic Hyperplasia |
| Skin | 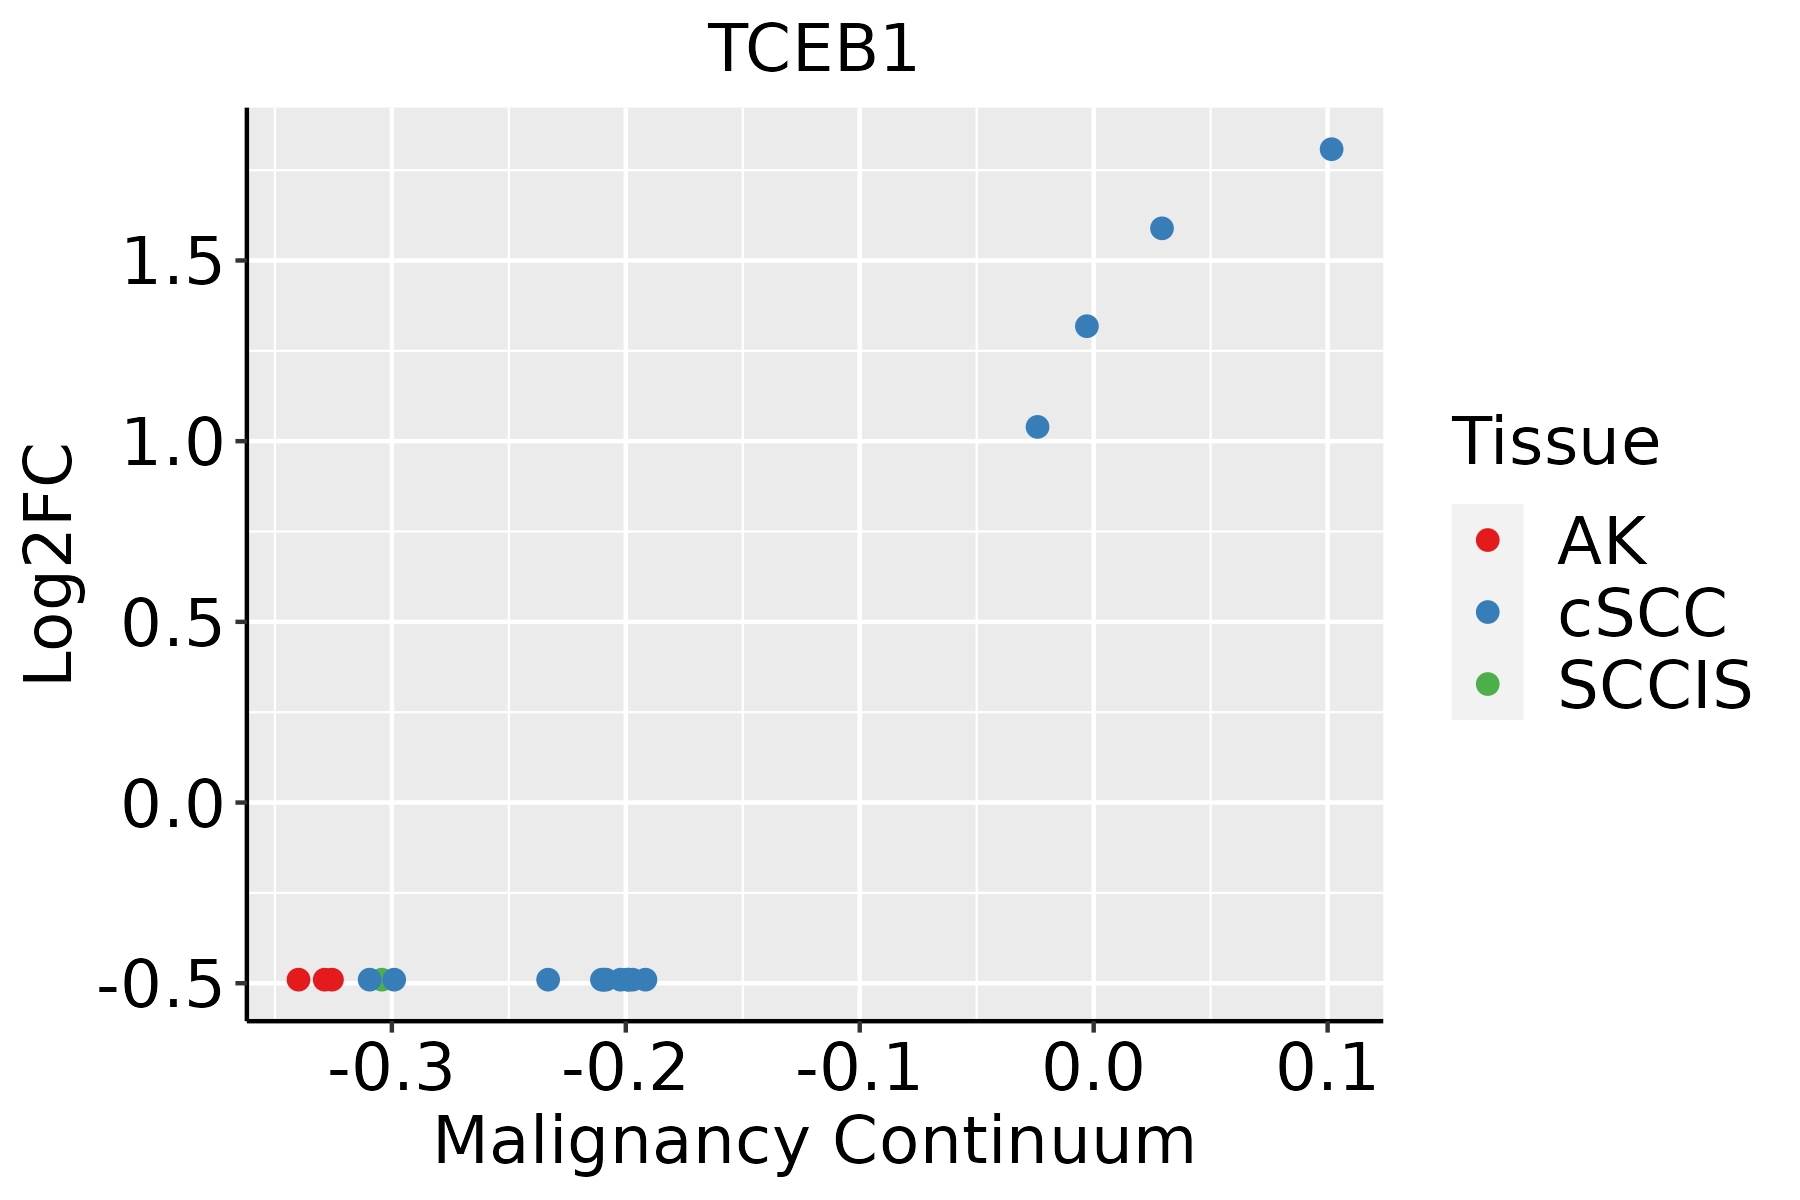 | AK: Actinic keratosis |
| cSCC: Cutaneous squamous cell carcinoma | ||
| SCCIS:squamous cell carcinoma in situ | ||
| Thyroid |  | ATC: Anaplastic thyroid cancer |
| HT: Hashimoto's thyroiditis | ||
| PTC: Papillary thyroid cancer |
| ∗log2FC in expression of this searched gene in stem-like cells from each diseased tissue sample relative to stem-like cells in normal samples in each tissue plotted against the malignancy continuum. Samples are colored based on if they are from different disease stage. |
Top |
Malignant transformation related pathway analysis |
| Find out the enriched GO biological processes and KEGG pathways involved in transition from healthy to precancer to cancer |
| Tissue | Disease Stage | Enriched GO biological Processes |
| Liver | Cyst |  |
| Lung | IAC |  |
| Lung | AIS |  |
| Lung | AAH |  |
| Lung | MIAC |  |
| ∗Top 15 enriched GO BP terms are showed in the bar plot of each disease state in each tissue. Each row represents a significant GO biological process which is colored according to the -log10(p.adjust). |
| Page: 1 2 3 4 5 6 7 8 9 |
| GO ID | Tissue | Disease Stage | Description | Gene Ratio | Bg Ratio | pvalue | p.adjust | Count |
| Page: 1 |
| Pathway ID | Tissue | Disease Stage | Description | Gene Ratio | Bg Ratio | pvalue | p.adjust | qvalue | Count |
| hsa0406616 | Breast | Precancer | HIF-1 signaling pathway | 23/684 | 109/8465 | 1.51e-05 | 1.59e-04 | 1.22e-04 | 23 |
| hsa0406617 | Breast | Precancer | HIF-1 signaling pathway | 23/684 | 109/8465 | 1.51e-05 | 1.59e-04 | 1.22e-04 | 23 |
| hsa0406623 | Breast | IDC | HIF-1 signaling pathway | 22/867 | 109/8465 | 1.36e-03 | 1.00e-02 | 7.50e-03 | 22 |
| hsa052118 | Breast | IDC | Renal cell carcinoma | 14/867 | 69/8465 | 9.16e-03 | 4.37e-02 | 3.27e-02 | 14 |
| hsa0517014 | Breast | IDC | Human immunodeficiency virus 1 infection | 33/867 | 212/8465 | 9.28e-03 | 4.37e-02 | 3.27e-02 | 33 |
| hsa0406633 | Breast | IDC | HIF-1 signaling pathway | 22/867 | 109/8465 | 1.36e-03 | 1.00e-02 | 7.50e-03 | 22 |
| hsa0521113 | Breast | IDC | Renal cell carcinoma | 14/867 | 69/8465 | 9.16e-03 | 4.37e-02 | 3.27e-02 | 14 |
| hsa0517015 | Breast | IDC | Human immunodeficiency virus 1 infection | 33/867 | 212/8465 | 9.28e-03 | 4.37e-02 | 3.27e-02 | 33 |
| hsa0406642 | Breast | DCIS | HIF-1 signaling pathway | 22/846 | 109/8465 | 9.83e-04 | 7.05e-03 | 5.20e-03 | 22 |
| hsa0517024 | Breast | DCIS | Human immunodeficiency virus 1 infection | 33/846 | 212/8465 | 6.49e-03 | 3.22e-02 | 2.37e-02 | 33 |
| hsa0521123 | Breast | DCIS | Renal cell carcinoma | 14/846 | 69/8465 | 7.42e-03 | 3.48e-02 | 2.56e-02 | 14 |
| hsa0406652 | Breast | DCIS | HIF-1 signaling pathway | 22/846 | 109/8465 | 9.83e-04 | 7.05e-03 | 5.20e-03 | 22 |
| hsa0517034 | Breast | DCIS | Human immunodeficiency virus 1 infection | 33/846 | 212/8465 | 6.49e-03 | 3.22e-02 | 2.37e-02 | 33 |
| hsa0521133 | Breast | DCIS | Renal cell carcinoma | 14/846 | 69/8465 | 7.42e-03 | 3.48e-02 | 2.56e-02 | 14 |
| hsa0412016 | Endometrium | AEH | Ubiquitin mediated proteolysis | 41/1197 | 142/8465 | 3.42e-06 | 4.27e-05 | 3.13e-05 | 41 |
| hsa0406620 | Endometrium | AEH | HIF-1 signaling pathway | 29/1197 | 109/8465 | 4.23e-04 | 3.11e-03 | 2.27e-03 | 29 |
| hsa0517018 | Endometrium | AEH | Human immunodeficiency virus 1 infection | 43/1197 | 212/8465 | 8.19e-03 | 4.22e-02 | 3.09e-02 | 43 |
| hsa0412017 | Endometrium | AEH | Ubiquitin mediated proteolysis | 41/1197 | 142/8465 | 3.42e-06 | 4.27e-05 | 3.13e-05 | 41 |
| hsa04066110 | Endometrium | AEH | HIF-1 signaling pathway | 29/1197 | 109/8465 | 4.23e-04 | 3.11e-03 | 2.27e-03 | 29 |
| hsa0517019 | Endometrium | AEH | Human immunodeficiency virus 1 infection | 43/1197 | 212/8465 | 8.19e-03 | 4.22e-02 | 3.09e-02 | 43 |
| Page: 1 2 3 4 5 |
Top |
Cell-cell communication analysis |
| Identification of potential cell-cell interactions between two cell types and their ligand-receptor pairs for different disease states |
| Ligand | Receptor | LRpair | Pathway | Tissue | Disease Stage |
| Page: 1 |
Top |
Single-cell gene regulatory network inference analysis |
| Find out the significant the regulons (TFs) and the target genes of each regulon across cell types for different disease states |
| TF | Cell Type | Tissue | Disease Stage | Target Gene | RSS | Regulon Activity |
| ∗The dot plots of a searched regulon are shown for all cell subpopulations in each disease state of each tissue based on the regulon specific score inferred using pySCENIC and by calculating the average expression. |
| Page: 1 |
Top |
Somatic mutation of malignant transformation related genes |
| Annotation of somatic variants for genes involved in malignant transformation |
| Hugo Symbol | Variant Class | Variant Classification | dbSNP RS | HGVSc | HGVSp | HGVSp Short | SWISSPROT | BIOTYPE | SIFT | PolyPhen | Tumor Sample Barcode | Tissue | Histology | Sex | Age | Stage | Therapy Types | Drugs | Outcome |
| Page: 1 |
Top |
Related drugs of malignant transformation related genes |
| Identification of chemicals and drugs interact with genes involved in malignant transfromation |
| (DGIdb 4.0) |
| Entrez ID | Symbol | Category | Interaction Types | Drug Claim Name | Drug Name | PMIDs |
| Page: 1 |

Copyright 2023-Present -The University of Texas Health Science Center at Houston |