
|
|||||
|
 | |
| |
| |
| |
| |
| |
|
Gene: SUPT5H |
Gene summary for SUPT5H |
| Gene information | Species | Human | Gene symbol | SUPT5H | Gene ID | 6829 |
| Gene name | SPT5 homolog, DSIF elongation factor subunit | |
| Gene Alias | SPT5 | |
| Cytomap | 19q13.2 | |
| Gene Type | protein-coding | GO ID | GO:0000122 | UniProtAcc | O00267 |
Top |
Malignant transformation analysis |
| Identification of the aberrant gene expression in precancerous and cancerous lesions by comparing the gene expression of stem-like cells in diseased tissues with normal stem cells |
| Entrez ID | Symbol | Replicates | Species | Organ | Tissue | Adj P-value | Log2FC | Malignancy |
| 6829 | SUPT5H | HTA11_3410_2000001011 | Human | Colorectum | AD | 8.86e-05 | 2.13e-01 | 0.0155 |
| 6829 | SUPT5H | HTA11_2487_2000001011 | Human | Colorectum | SER | 1.67e-05 | 3.00e-01 | -0.1808 |
| 6829 | SUPT5H | HTA11_1938_2000001011 | Human | Colorectum | AD | 5.10e-04 | 3.27e-01 | -0.0811 |
| 6829 | SUPT5H | HTA11_347_2000001011 | Human | Colorectum | AD | 3.88e-19 | 5.01e-01 | -0.1954 |
| 6829 | SUPT5H | HTA11_411_2000001011 | Human | Colorectum | SER | 1.79e-02 | 7.50e-01 | -0.2602 |
| 6829 | SUPT5H | HTA11_3361_2000001011 | Human | Colorectum | AD | 1.81e-02 | 3.10e-01 | -0.1207 |
| 6829 | SUPT5H | HTA11_696_2000001011 | Human | Colorectum | AD | 3.58e-15 | 6.20e-01 | -0.1464 |
| 6829 | SUPT5H | HTA11_866_2000001011 | Human | Colorectum | AD | 8.05e-08 | 4.51e-01 | -0.1001 |
| 6829 | SUPT5H | HTA11_1391_2000001011 | Human | Colorectum | AD | 8.17e-16 | 6.18e-01 | -0.059 |
| 6829 | SUPT5H | HTA11_2992_2000001011 | Human | Colorectum | SER | 3.10e-02 | 3.77e-01 | -0.1706 |
| 6829 | SUPT5H | HTA11_546_2000001011 | Human | Colorectum | AD | 4.90e-07 | 5.93e-01 | -0.0842 |
| 6829 | SUPT5H | HTA11_866_3004761011 | Human | Colorectum | AD | 2.34e-06 | 3.41e-01 | 0.096 |
| 6829 | SUPT5H | HTA11_10623_2000001011 | Human | Colorectum | AD | 1.08e-03 | 3.80e-01 | -0.0177 |
| 6829 | SUPT5H | HTA11_10711_2000001011 | Human | Colorectum | AD | 1.29e-03 | 3.62e-01 | 0.0338 |
| 6829 | SUPT5H | HTA11_7696_3000711011 | Human | Colorectum | AD | 3.34e-19 | 6.95e-01 | 0.0674 |
| 6829 | SUPT5H | HTA11_6818_2000001011 | Human | Colorectum | AD | 7.95e-03 | 4.35e-01 | 0.0112 |
| 6829 | SUPT5H | HTA11_6818_2000001021 | Human | Colorectum | AD | 6.64e-03 | 3.39e-01 | 0.0588 |
| 6829 | SUPT5H | HTA11_99999970781_79442 | Human | Colorectum | MSS | 1.66e-02 | 2.91e-01 | 0.294 |
| 6829 | SUPT5H | HTA11_99999965104_69814 | Human | Colorectum | MSS | 2.45e-07 | 5.07e-01 | 0.281 |
| 6829 | SUPT5H | HTA11_99999971662_82457 | Human | Colorectum | MSS | 1.35e-12 | 7.14e-01 | 0.3859 |
| Page: 1 2 3 4 5 6 7 8 |
| Tissue | Expression Dynamics | Abbreviation |
| Colorectum (GSE201348) | 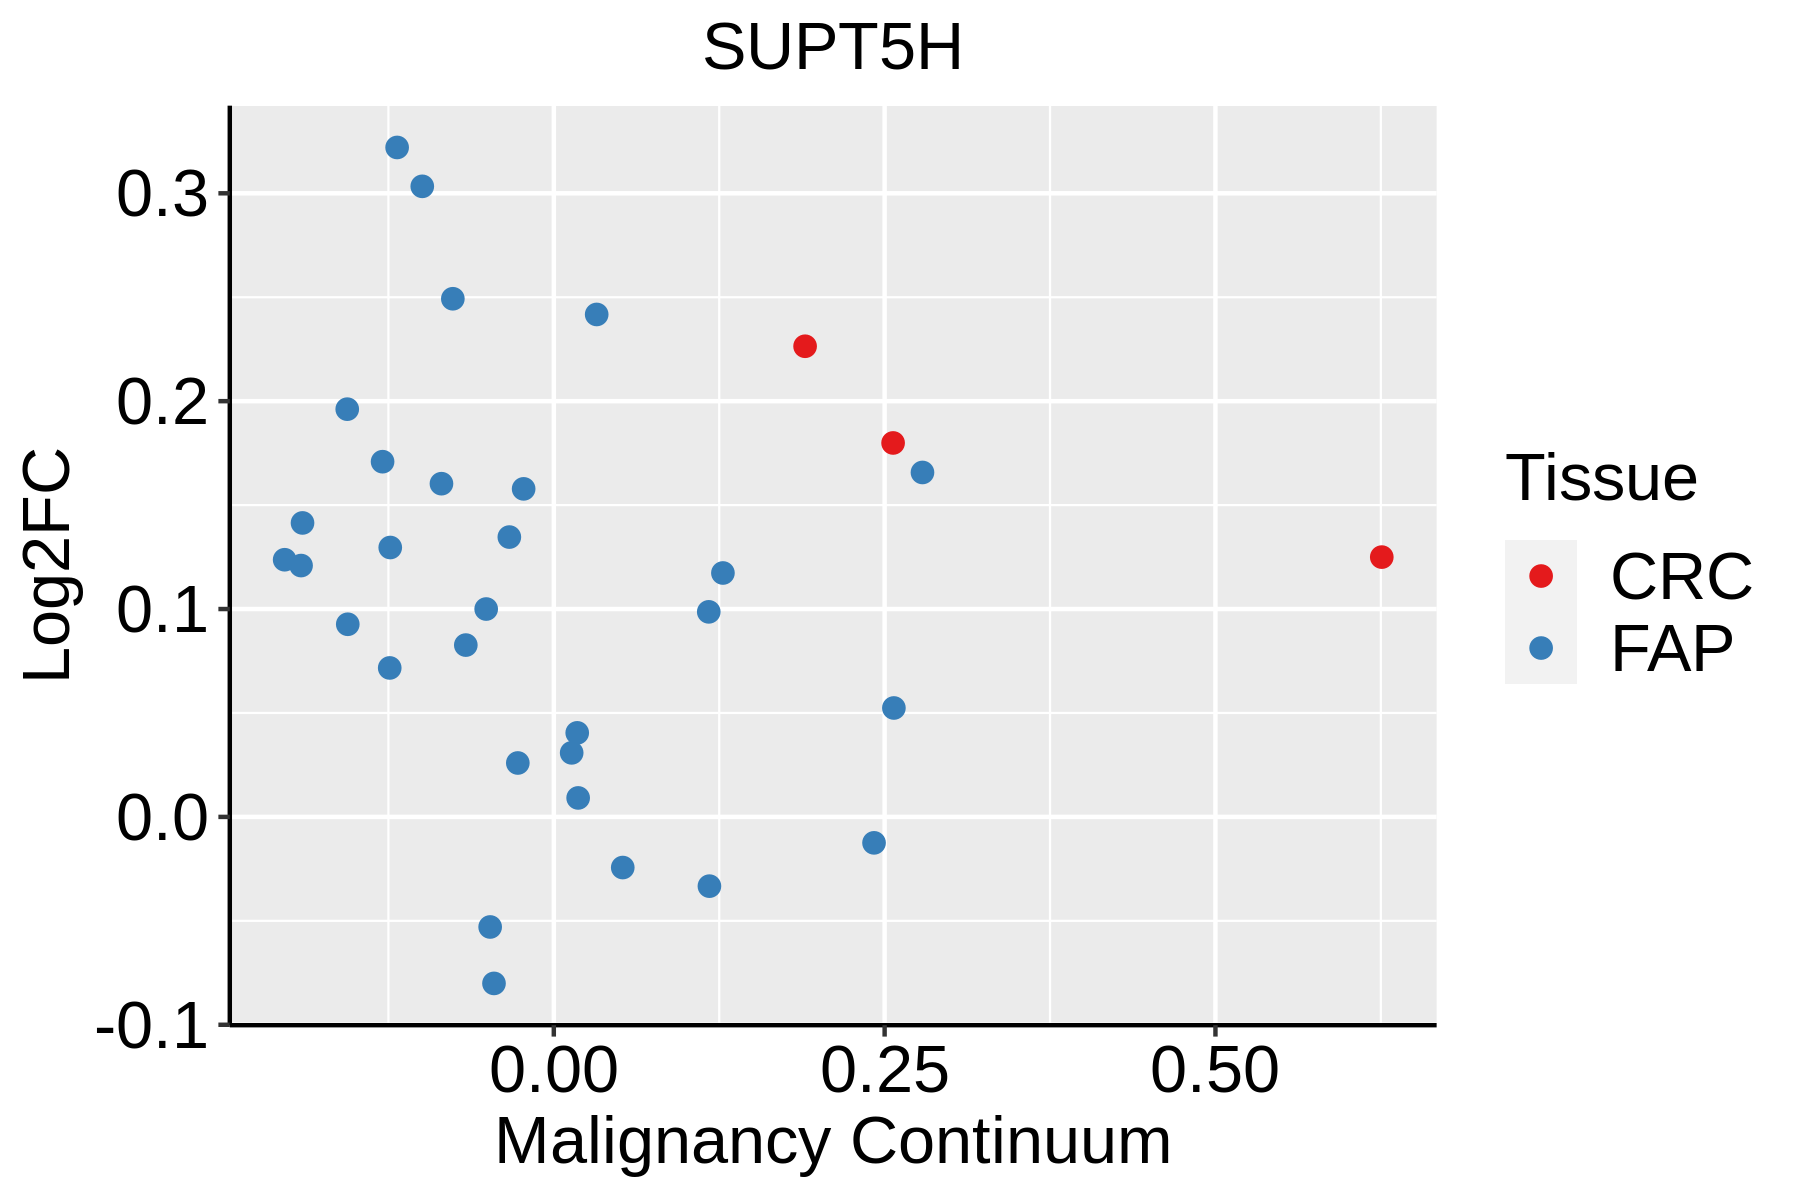 | FAP: Familial adenomatous polyposis |
| CRC: Colorectal cancer | ||
| Colorectum (HTA11) |  | AD: Adenomas |
| SER: Sessile serrated lesions | ||
| MSI-H: Microsatellite-high colorectal cancer | ||
| MSS: Microsatellite stable colorectal cancer | ||
| Esophagus | 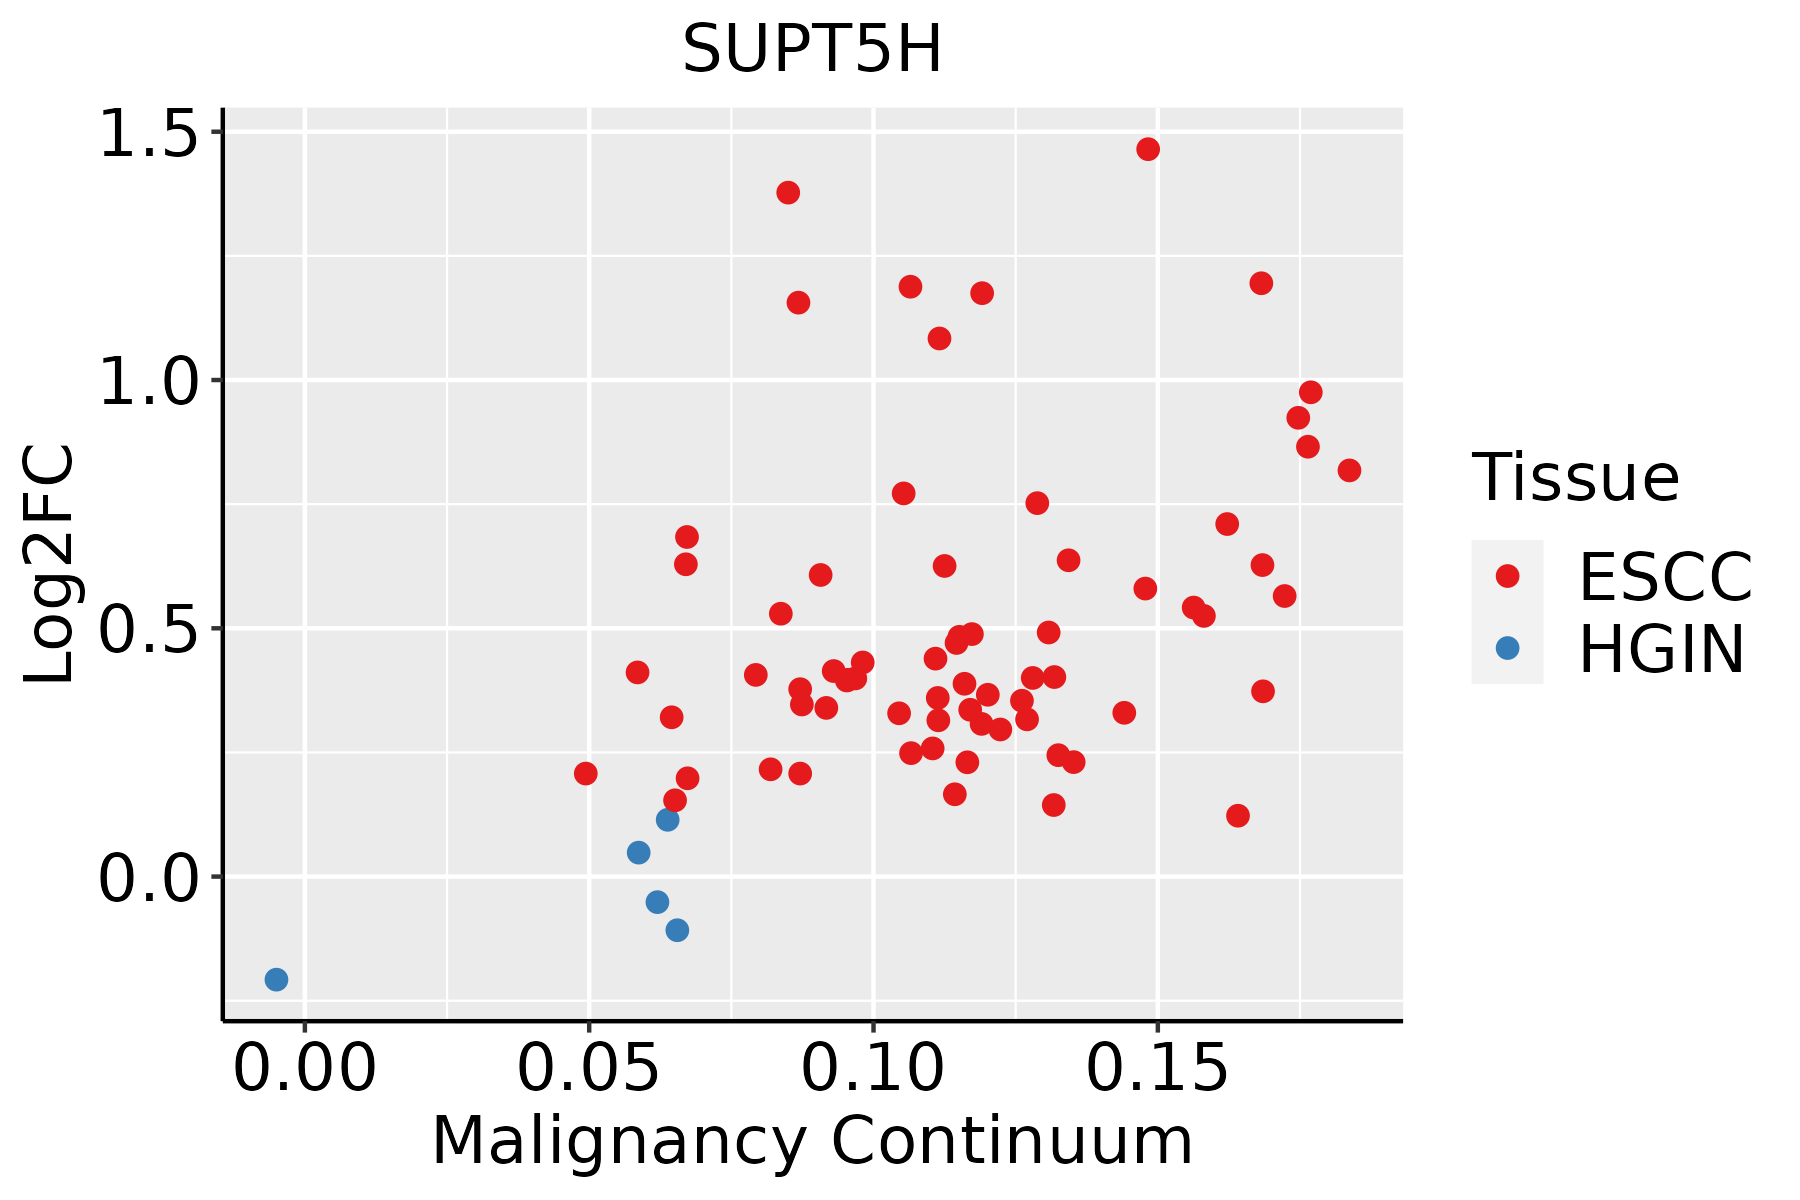 | ESCC: Esophageal squamous cell carcinoma |
| HGIN: High-grade intraepithelial neoplasias | ||
| LGIN: Low-grade intraepithelial neoplasias | ||
| Liver |  | HCC: Hepatocellular carcinoma |
| NAFLD: Non-alcoholic fatty liver disease | ||
| Oral Cavity | 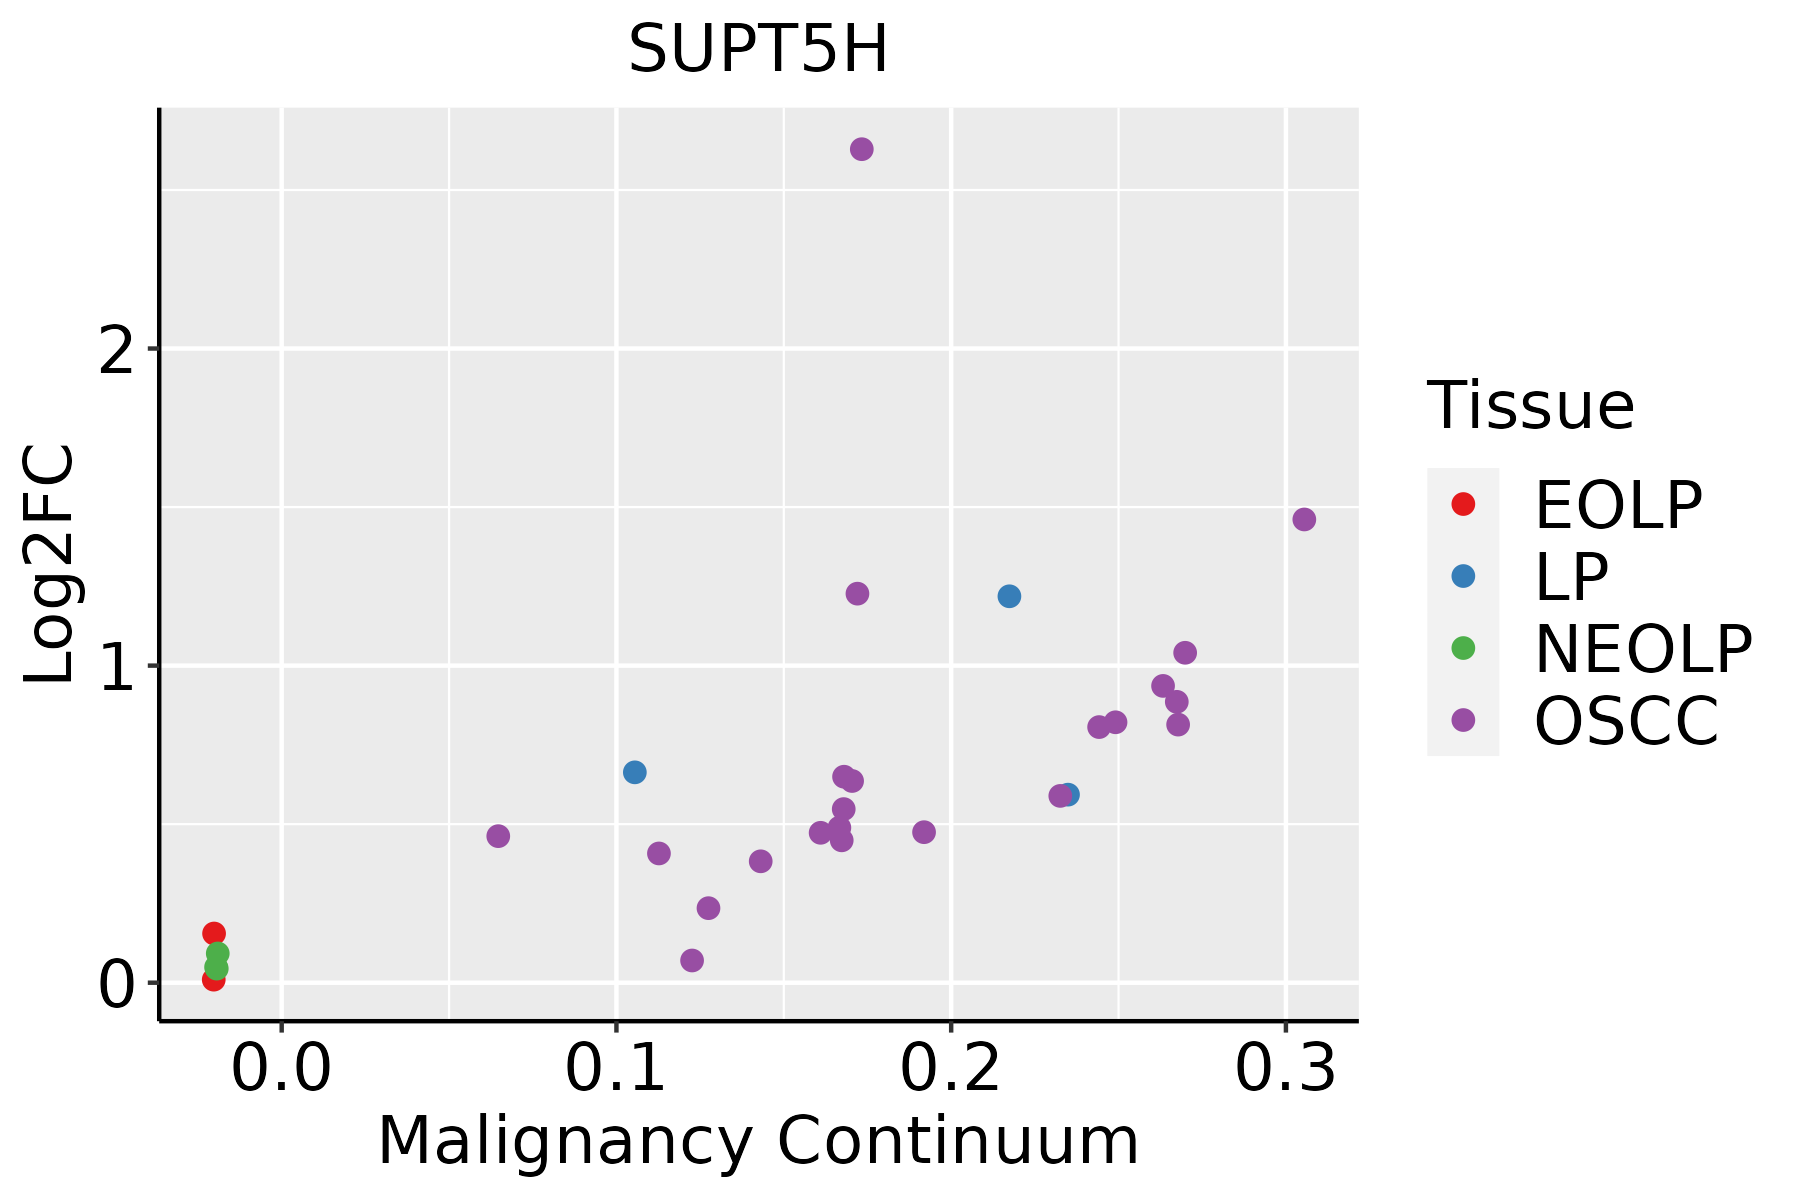 | EOLP: Erosive Oral lichen planus |
| LP: leukoplakia | ||
| NEOLP: Non-erosive oral lichen planus | ||
| OSCC: Oral squamous cell carcinoma | ||
| Prostate | 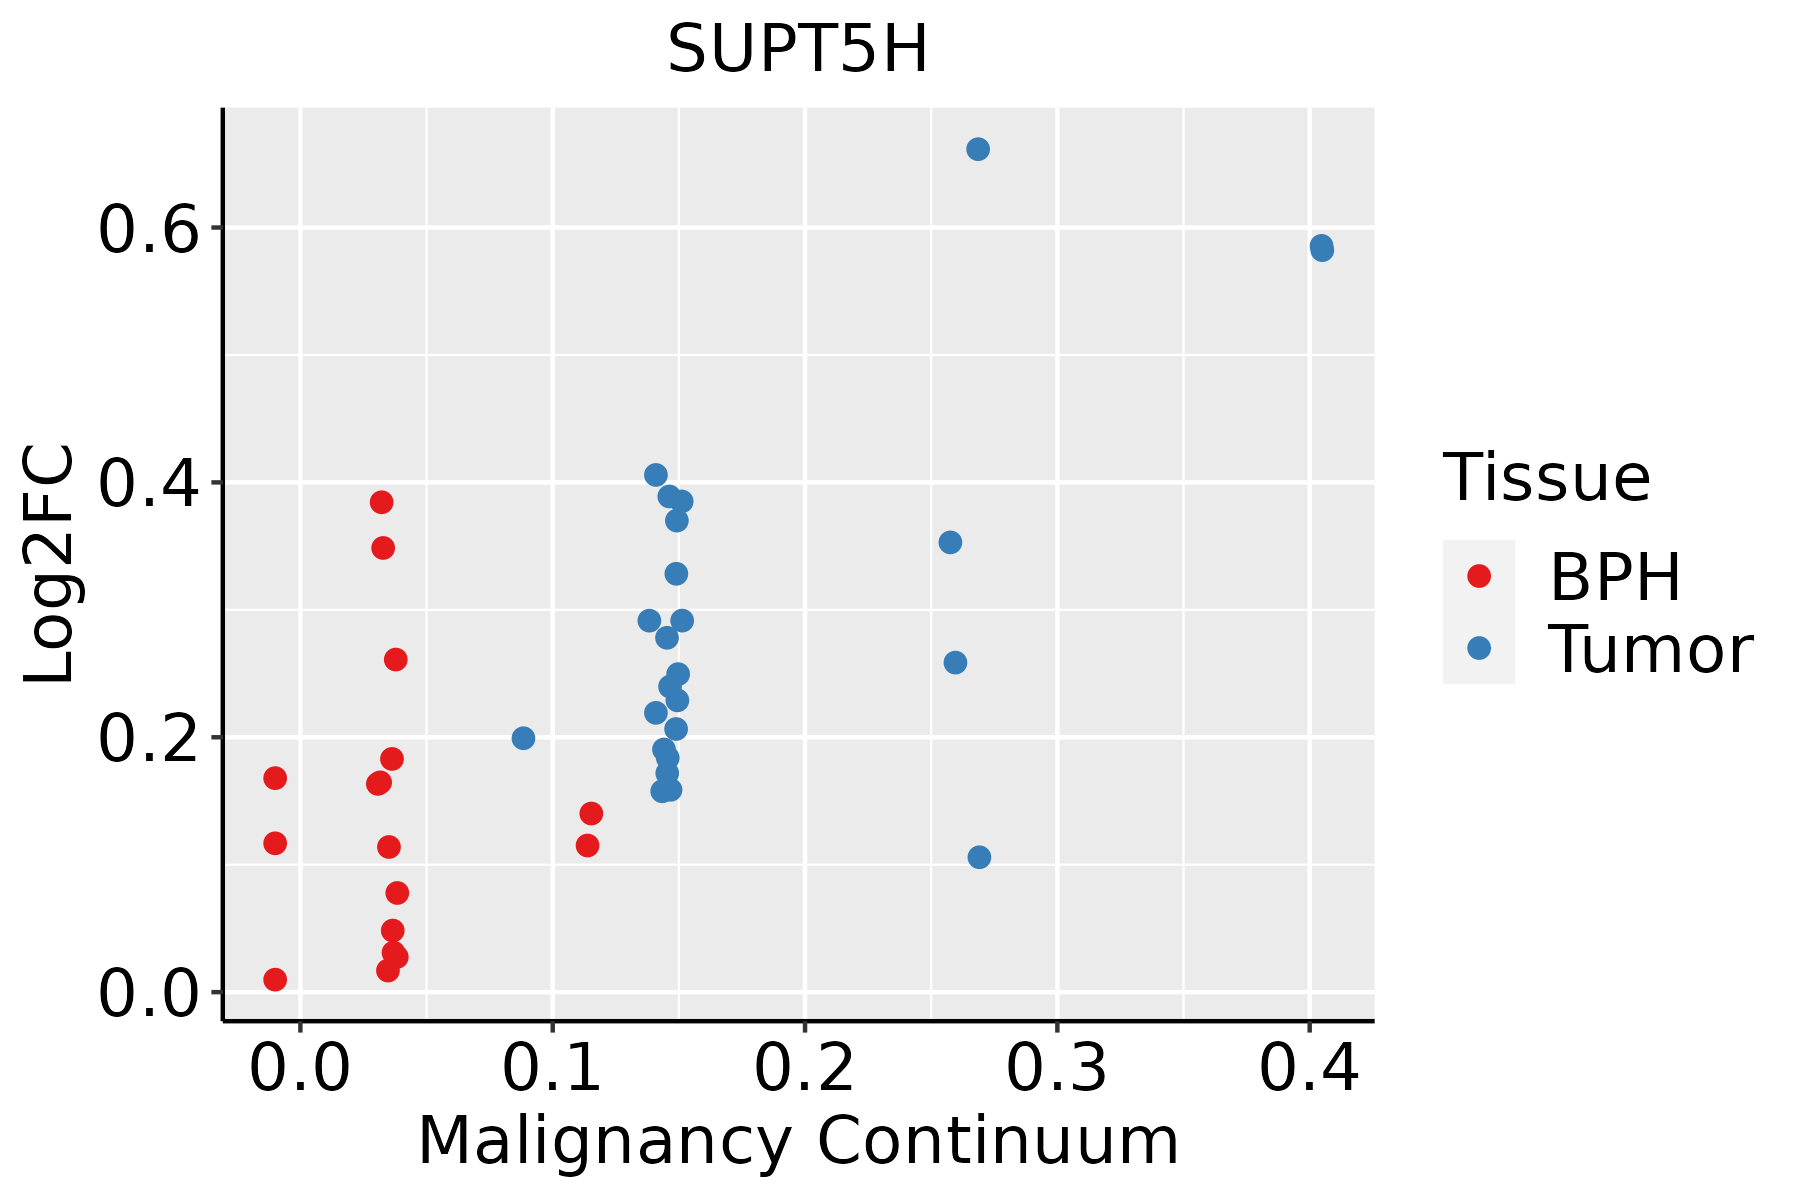 | BPH: Benign Prostatic Hyperplasia |
| Skin | 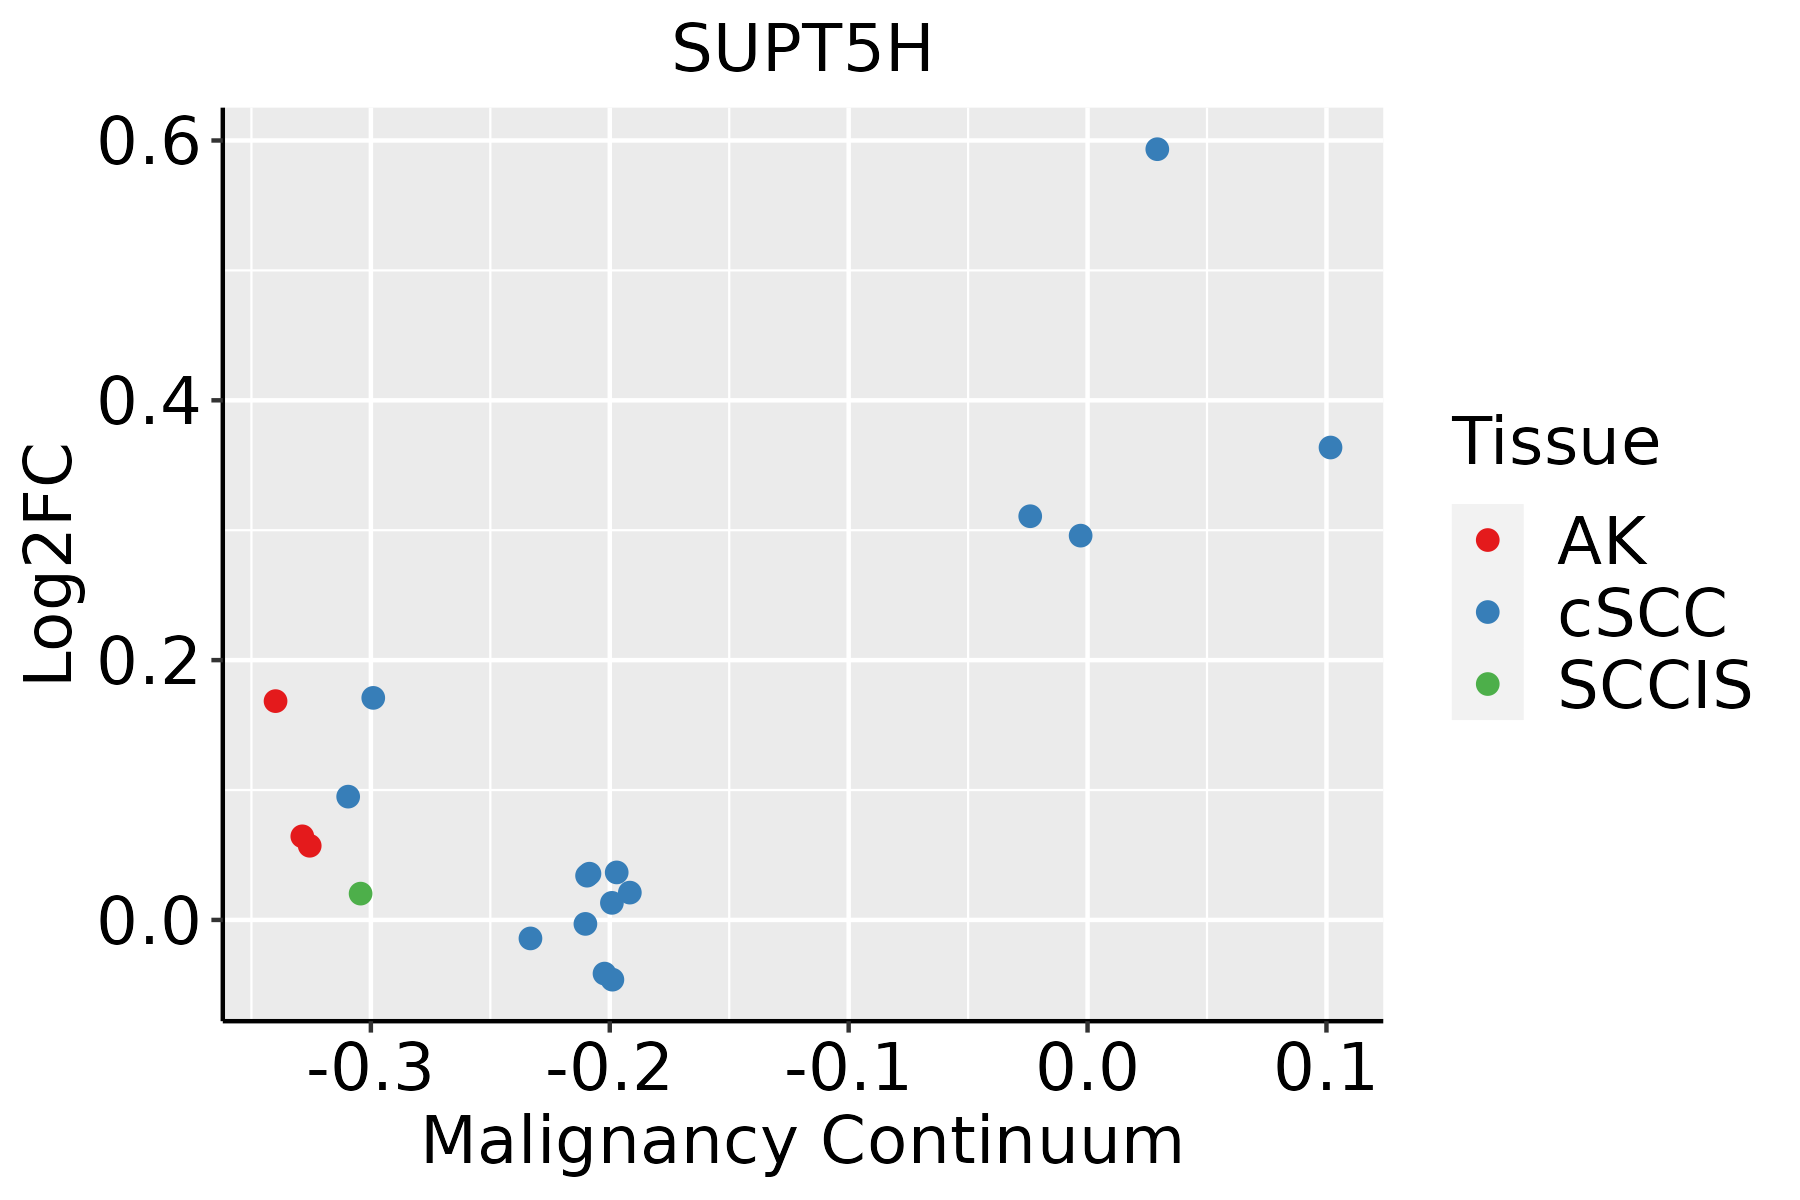 | AK: Actinic keratosis |
| cSCC: Cutaneous squamous cell carcinoma | ||
| SCCIS:squamous cell carcinoma in situ | ||
| Thyroid | 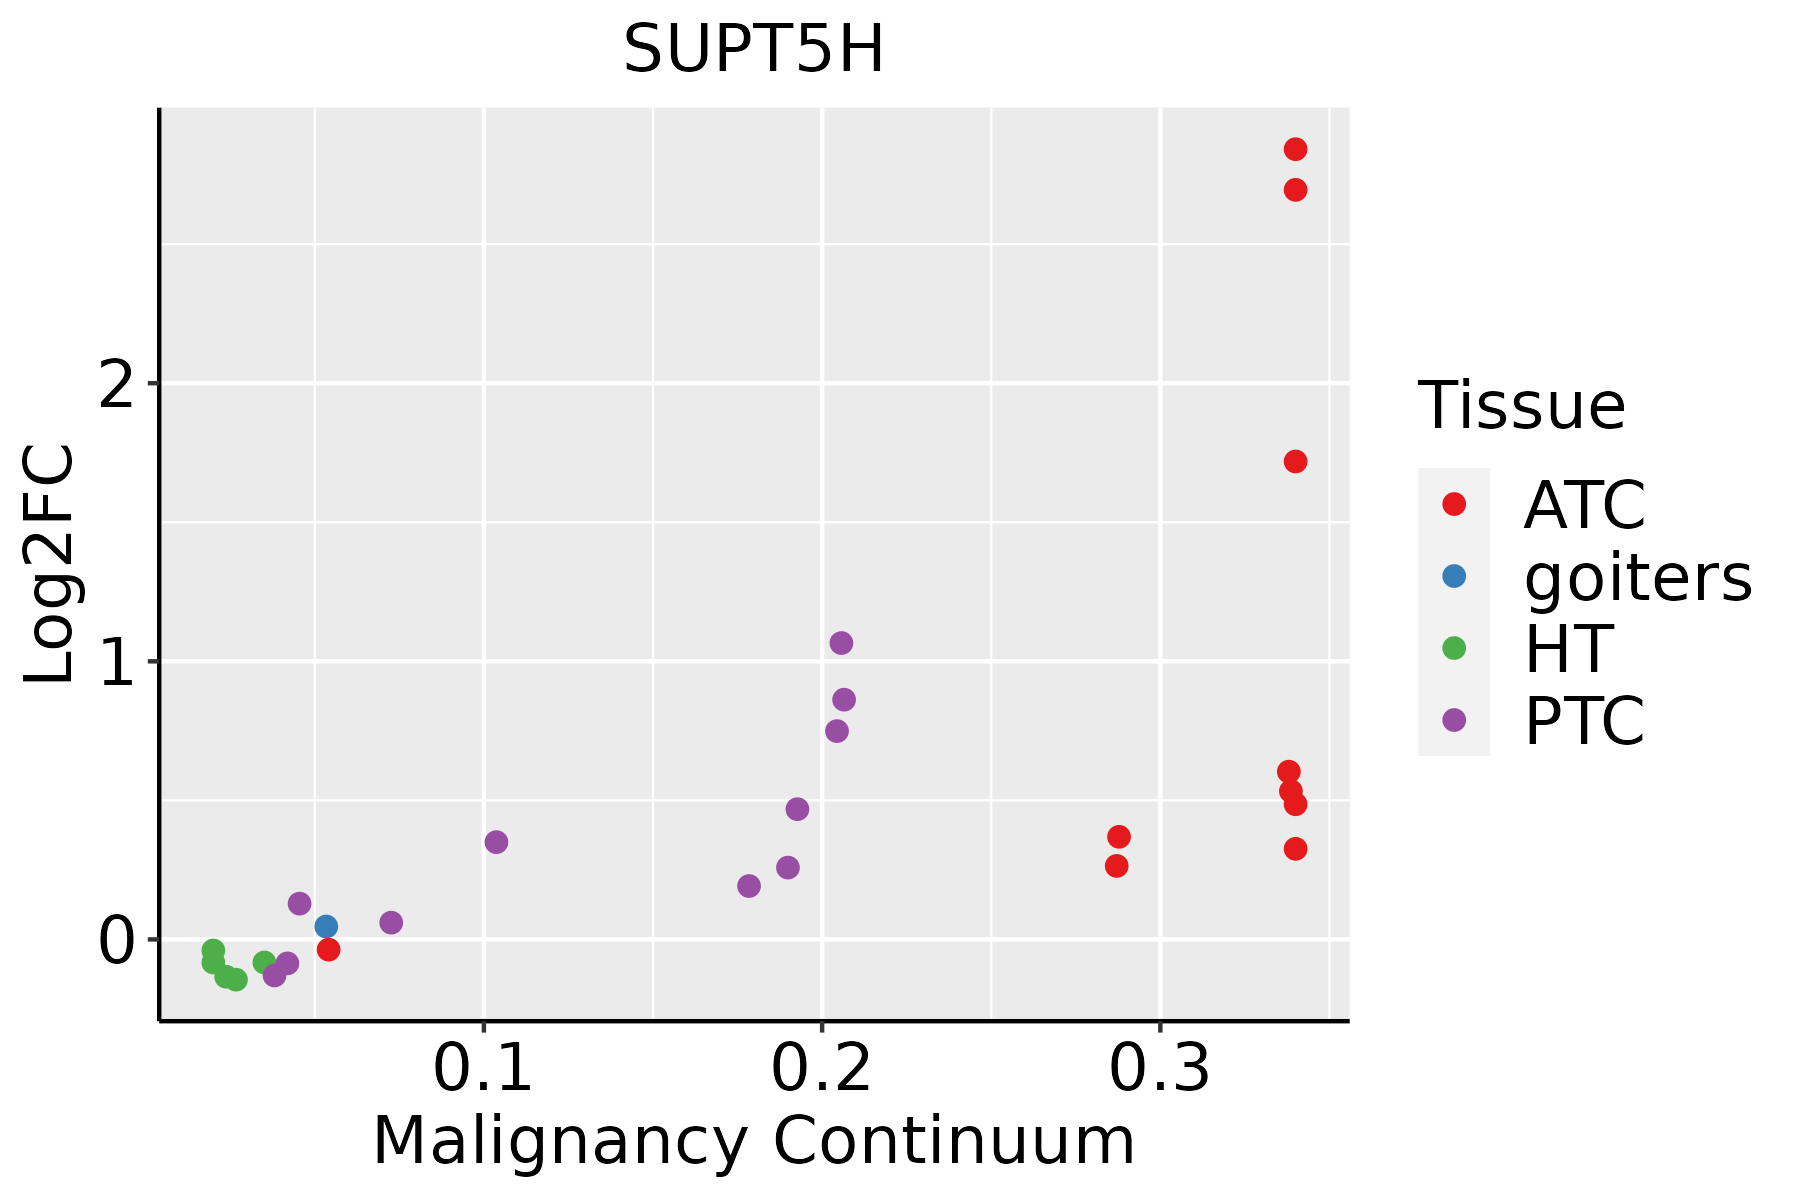 | ATC: Anaplastic thyroid cancer |
| HT: Hashimoto's thyroiditis | ||
| PTC: Papillary thyroid cancer |
| ∗log2FC in expression of this searched gene in stem-like cells from each diseased tissue sample relative to stem-like cells in normal samples in each tissue plotted against the malignancy continuum. Samples are colored based on if they are from different disease stage. |
Top |
Malignant transformation related pathway analysis |
| Find out the enriched GO biological processes and KEGG pathways involved in transition from healthy to precancer to cancer |
| Tissue | Disease Stage | Enriched GO biological Processes |
| Liver | Cyst |  |
| Lung | IAC |  |
| Lung | AIS |  |
| Lung | AAH |  |
| Lung | MIAC |  |
| ∗Top 15 enriched GO BP terms are showed in the bar plot of each disease state in each tissue. Each row represents a significant GO biological process which is colored according to the -log10(p.adjust). |
| Page: 1 2 3 4 5 6 7 8 9 |
| GO ID | Tissue | Disease Stage | Description | Gene Ratio | Bg Ratio | pvalue | p.adjust | Count |
| GO:0009896 | Colorectum | AD | positive regulation of catabolic process | 180/3918 | 492/18723 | 4.33e-16 | 1.94e-13 | 180 |
| GO:1903311 | Colorectum | AD | regulation of mRNA metabolic process | 117/3918 | 288/18723 | 1.69e-14 | 4.23e-12 | 117 |
| GO:0031331 | Colorectum | AD | positive regulation of cellular catabolic process | 156/3918 | 427/18723 | 4.68e-14 | 1.05e-11 | 156 |
| GO:0050684 | Colorectum | AD | regulation of mRNA processing | 61/3918 | 137/18723 | 4.23e-10 | 3.58e-08 | 61 |
| GO:0010506 | Colorectum | AD | regulation of autophagy | 111/3918 | 317/18723 | 3.57e-09 | 2.35e-07 | 111 |
| GO:0016236 | Colorectum | AD | macroautophagy | 103/3918 | 291/18723 | 6.76e-09 | 4.15e-07 | 103 |
| GO:1903312 | Colorectum | AD | negative regulation of mRNA metabolic process | 37/3918 | 92/18723 | 1.95e-05 | 4.01e-04 | 37 |
| GO:0016241 | Colorectum | AD | regulation of macroautophagy | 50/3918 | 141/18723 | 4.55e-05 | 7.92e-04 | 50 |
| GO:0010508 | Colorectum | AD | positive regulation of autophagy | 43/3918 | 124/18723 | 2.64e-04 | 3.27e-03 | 43 |
| GO:0032786 | Colorectum | AD | positive regulation of DNA-templated transcription, elongation | 13/3918 | 27/18723 | 1.47e-03 | 1.25e-02 | 13 |
| GO:0006354 | Colorectum | AD | DNA-templated transcription, elongation | 31/3918 | 91/18723 | 2.46e-03 | 1.90e-02 | 31 |
| GO:0050686 | Colorectum | AD | negative regulation of mRNA processing | 13/3918 | 29/18723 | 3.26e-03 | 2.39e-02 | 13 |
| GO:0006368 | Colorectum | AD | transcription elongation from RNA polymerase II promoter | 24/3918 | 69/18723 | 5.35e-03 | 3.52e-02 | 24 |
| GO:00098961 | Colorectum | SER | positive regulation of catabolic process | 132/2897 | 492/18723 | 4.16e-11 | 6.72e-09 | 132 |
| GO:00313311 | Colorectum | SER | positive regulation of cellular catabolic process | 114/2897 | 427/18723 | 1.22e-09 | 1.27e-07 | 114 |
| GO:00162361 | Colorectum | SER | macroautophagy | 79/2897 | 291/18723 | 1.97e-07 | 1.10e-05 | 79 |
| GO:19033111 | Colorectum | SER | regulation of mRNA metabolic process | 78/2897 | 288/18723 | 2.61e-07 | 1.43e-05 | 78 |
| GO:00506841 | Colorectum | SER | regulation of mRNA processing | 42/2897 | 137/18723 | 5.57e-06 | 2.01e-04 | 42 |
| GO:00105061 | Colorectum | SER | regulation of autophagy | 74/2897 | 317/18723 | 1.39e-04 | 2.77e-03 | 74 |
| GO:19033121 | Colorectum | SER | negative regulation of mRNA metabolic process | 26/2897 | 92/18723 | 1.25e-03 | 1.41e-02 | 26 |
| Page: 1 2 3 4 5 6 7 8 9 10 11 12 13 |
| Pathway ID | Tissue | Disease Stage | Description | Gene Ratio | Bg Ratio | pvalue | p.adjust | qvalue | Count |
| hsa03250 | Colorectum | MSS | Viral life cycle - HIV-1 | 23/1875 | 63/8465 | 6.55e-03 | 2.64e-02 | 1.62e-02 | 23 |
| hsa032501 | Colorectum | MSS | Viral life cycle - HIV-1 | 23/1875 | 63/8465 | 6.55e-03 | 2.64e-02 | 1.62e-02 | 23 |
| hsa032509 | Esophagus | ESCC | Viral life cycle - HIV-1 | 54/4205 | 63/8465 | 2.01e-09 | 2.17e-08 | 1.11e-08 | 54 |
| hsa0325014 | Esophagus | ESCC | Viral life cycle - HIV-1 | 54/4205 | 63/8465 | 2.01e-09 | 2.17e-08 | 1.11e-08 | 54 |
| hsa032502 | Liver | HCC | Viral life cycle - HIV-1 | 46/4020 | 63/8465 | 3.25e-05 | 1.88e-04 | 1.04e-04 | 46 |
| hsa0325011 | Liver | HCC | Viral life cycle - HIV-1 | 46/4020 | 63/8465 | 3.25e-05 | 1.88e-04 | 1.04e-04 | 46 |
| hsa032508 | Oral cavity | OSCC | Viral life cycle - HIV-1 | 45/3704 | 63/8465 | 7.62e-06 | 3.59e-05 | 1.83e-05 | 45 |
| hsa0325013 | Oral cavity | OSCC | Viral life cycle - HIV-1 | 45/3704 | 63/8465 | 7.62e-06 | 3.59e-05 | 1.83e-05 | 45 |
| hsa0325022 | Oral cavity | LP | Viral life cycle - HIV-1 | 32/2418 | 63/8465 | 1.55e-04 | 9.08e-04 | 5.86e-04 | 32 |
| hsa0325031 | Oral cavity | LP | Viral life cycle - HIV-1 | 32/2418 | 63/8465 | 1.55e-04 | 9.08e-04 | 5.86e-04 | 32 |
| hsa032504 | Prostate | BPH | Viral life cycle - HIV-1 | 24/1718 | 63/8465 | 8.32e-04 | 3.98e-03 | 2.46e-03 | 24 |
| hsa0325012 | Prostate | BPH | Viral life cycle - HIV-1 | 24/1718 | 63/8465 | 8.32e-04 | 3.98e-03 | 2.46e-03 | 24 |
| hsa0325021 | Prostate | Tumor | Viral life cycle - HIV-1 | 25/1791 | 63/8465 | 6.13e-04 | 3.07e-03 | 1.91e-03 | 25 |
| hsa032503 | Prostate | Tumor | Viral life cycle - HIV-1 | 25/1791 | 63/8465 | 6.13e-04 | 3.07e-03 | 1.91e-03 | 25 |
| Page: 1 |
Top |
Cell-cell communication analysis |
| Identification of potential cell-cell interactions between two cell types and their ligand-receptor pairs for different disease states |
| Ligand | Receptor | LRpair | Pathway | Tissue | Disease Stage |
| Page: 1 |
Top |
Single-cell gene regulatory network inference analysis |
| Find out the significant the regulons (TFs) and the target genes of each regulon across cell types for different disease states |
| TF | Cell Type | Tissue | Disease Stage | Target Gene | RSS | Regulon Activity |
| ∗The dot plots of a searched regulon are shown for all cell subpopulations in each disease state of each tissue based on the regulon specific score inferred using pySCENIC and by calculating the average expression. |
| Page: 1 |
Top |
Somatic mutation of malignant transformation related genes |
| Annotation of somatic variants for genes involved in malignant transformation |
| Hugo Symbol | Variant Class | Variant Classification | dbSNP RS | HGVSc | HGVSp | HGVSp Short | SWISSPROT | BIOTYPE | SIFT | PolyPhen | Tumor Sample Barcode | Tissue | Histology | Sex | Age | Stage | Therapy Types | Drugs | Outcome |
| SUPT5H | SNV | Missense_Mutation | c.1913N>T | p.Cys638Phe | p.C638F | O00267 | protein_coding | deleterious(0) | possibly_damaging(0.67) | TCGA-A8-A079-01 | Breast | breast invasive carcinoma | Female | >=65 | III/IV | Chemotherapy | 5-fluorouracil | SD | |
| SUPT5H | SNV | Missense_Mutation | c.2287T>G | p.Ser763Ala | p.S763A | O00267 | protein_coding | deleterious(0.03) | benign(0.217) | TCGA-A8-A08R-01 | Breast | breast invasive carcinoma | Female | <65 | I/II | Unknown | Unknown | SD | |
| SUPT5H | SNV | Missense_Mutation | c.865G>A | p.Asp289Asn | p.D289N | O00267 | protein_coding | deleterious(0) | probably_damaging(1) | TCGA-AN-A0G0-01 | Breast | breast invasive carcinoma | Female | <65 | I/II | Unknown | Unknown | SD | |
| SUPT5H | SNV | Missense_Mutation | c.1289N>C | p.Glu430Ala | p.E430A | O00267 | protein_coding | tolerated(0.12) | benign(0.17) | TCGA-AR-A24R-01 | Breast | breast invasive carcinoma | Female | <65 | III/IV | Chemotherapy | cytoxan | SD | |
| SUPT5H | SNV | Missense_Mutation | c.400G>A | p.Glu134Lys | p.E134K | O00267 | protein_coding | deleterious(0) | probably_damaging(0.993) | TCGA-B6-A0WT-01 | Breast | breast invasive carcinoma | Female | <65 | I/II | Unknown | Unknown | PD | |
| SUPT5H | SNV | Missense_Mutation | rs771718317 | c.207A>C | p.Lys69Asn | p.K69N | O00267 | protein_coding | tolerated(0.08) | benign(0.031) | TCGA-BH-A1EX-01 | Breast | breast invasive carcinoma | Female | >=65 | I/II | Unknown | Unknown | PD |
| SUPT5H | SNV | Missense_Mutation | rs771718317 | c.207A>C | p.Lys69Asn | p.K69N | O00267 | protein_coding | tolerated(0.08) | benign(0.031) | TCGA-BH-A1FH-01 | Breast | breast invasive carcinoma | Female | <65 | III/IV | Unknown | Unknown | PD |
| SUPT5H | SNV | Missense_Mutation | c.436G>A | p.Ala146Thr | p.A146T | O00267 | protein_coding | deleterious(0.02) | benign(0.152) | TCGA-C8-A12Y-01 | Breast | breast invasive carcinoma | Female | <65 | I/II | Unknown | Unknown | SD | |
| SUPT5H | SNV | Missense_Mutation | rs770412349 | c.2267N>A | p.Arg756Gln | p.R756Q | O00267 | protein_coding | tolerated(0.62) | benign(0.046) | TCGA-D8-A1XQ-01 | Breast | breast invasive carcinoma | Female | >=65 | I/II | Unknown | Unknown | SD |
| SUPT5H | SNV | Missense_Mutation | rs771718317 | c.207A>C | p.Lys69Asn | p.K69N | O00267 | protein_coding | tolerated(0.08) | benign(0.031) | TCGA-E9-A22A-01 | Breast | breast invasive carcinoma | Female | >=65 | I/II | Hormone Therapy | tamoxiphen | SD |
| Page: 1 2 3 4 5 6 7 8 9 10 11 12 13 14 15 |
Top |
Related drugs of malignant transformation related genes |
| Identification of chemicals and drugs interact with genes involved in malignant transfromation |
| (DGIdb 4.0) |
| Entrez ID | Symbol | Category | Interaction Types | Drug Claim Name | Drug Name | PMIDs |
| Page: 1 |

Copyright 2023-Present -The University of Texas Health Science Center at Houston |