
|
|||||
|
 | |
| |
| |
| |
| |
| |
|
Gene: SLC7A5 |
Gene summary for SLC7A5 |
| Gene information | Species | Human | Gene symbol | SLC7A5 | Gene ID | 8140 |
| Gene name | solute carrier family 7 member 5 | |
| Gene Alias | 4F2LC | |
| Cytomap | 16q24.2 | |
| Gene Type | protein-coding | GO ID | GO:0001816 | UniProtAcc | Q01650 |
Top |
Malignant transformation analysis |
| Identification of the aberrant gene expression in precancerous and cancerous lesions by comparing the gene expression of stem-like cells in diseased tissues with normal stem cells |
| Entrez ID | Symbol | Replicates | Species | Organ | Tissue | Adj P-value | Log2FC | Malignancy |
| 8140 | SLC7A5 | HTA11_7696_3000711011 | Human | Colorectum | AD | 2.08e-08 | 4.15e-01 | 0.0674 |
| 8140 | SLC7A5 | HTA11_99999970781_79442 | Human | Colorectum | MSS | 3.39e-19 | 5.88e-01 | 0.294 |
| 8140 | SLC7A5 | HTA11_99999965104_69814 | Human | Colorectum | MSS | 4.83e-09 | 4.64e-01 | 0.281 |
| 8140 | SLC7A5 | HTA11_99999971662_82457 | Human | Colorectum | MSS | 6.67e-39 | 1.02e+00 | 0.3859 |
| 8140 | SLC7A5 | HTA11_99999973899_84307 | Human | Colorectum | MSS | 1.53e-03 | 2.66e-01 | 0.2585 |
| 8140 | SLC7A5 | HTA11_99999974143_84620 | Human | Colorectum | MSS | 2.59e-65 | 1.27e+00 | 0.3005 |
| 8140 | SLC7A5 | AEH-subject1 | Human | Endometrium | AEH | 1.25e-23 | 5.87e-01 | -0.3059 |
| 8140 | SLC7A5 | AEH-subject2 | Human | Endometrium | AEH | 1.85e-07 | 3.42e-01 | -0.2525 |
| 8140 | SLC7A5 | AEH-subject3 | Human | Endometrium | AEH | 1.69e-10 | 4.46e-01 | -0.2576 |
| 8140 | SLC7A5 | AEH-subject4 | Human | Endometrium | AEH | 1.04e-03 | 2.61e-01 | -0.2657 |
| 8140 | SLC7A5 | AEH-subject5 | Human | Endometrium | AEH | 2.11e-04 | 3.12e-01 | -0.2953 |
| 8140 | SLC7A5 | EEC-subject2 | Human | Endometrium | EEC | 4.02e-02 | 2.39e-01 | -0.2607 |
| 8140 | SLC7A5 | EEC-subject3 | Human | Endometrium | EEC | 1.61e-02 | 3.34e-01 | -0.2525 |
| 8140 | SLC7A5 | EEC-subject4 | Human | Endometrium | EEC | 9.09e-05 | 2.95e-01 | -0.2571 |
| 8140 | SLC7A5 | EEC-subject5 | Human | Endometrium | EEC | 1.03e-16 | 5.75e-01 | -0.249 |
| 8140 | SLC7A5 | GSM5276935 | Human | Endometrium | EEC | 9.69e-10 | 3.36e-01 | -0.123 |
| 8140 | SLC7A5 | LZE2T | Human | Esophagus | ESCC | 1.28e-02 | 7.04e-01 | 0.082 |
| 8140 | SLC7A5 | LZE4T | Human | Esophagus | ESCC | 1.77e-10 | -4.55e-02 | 0.0811 |
| 8140 | SLC7A5 | LZE7T | Human | Esophagus | ESCC | 9.79e-10 | 1.59e-02 | 0.0667 |
| 8140 | SLC7A5 | LZE8T | Human | Esophagus | ESCC | 9.52e-08 | -2.59e-01 | 0.067 |
| Page: 1 2 3 4 5 6 |
| Tissue | Expression Dynamics | Abbreviation |
| Colorectum (GSE201348) |  | FAP: Familial adenomatous polyposis |
| CRC: Colorectal cancer | ||
| Colorectum (HTA11) |  | AD: Adenomas |
| SER: Sessile serrated lesions | ||
| MSI-H: Microsatellite-high colorectal cancer | ||
| MSS: Microsatellite stable colorectal cancer | ||
| Endometrium |  | AEH: Atypical endometrial hyperplasia |
| EEC: Endometrioid Cancer | ||
| Esophagus | 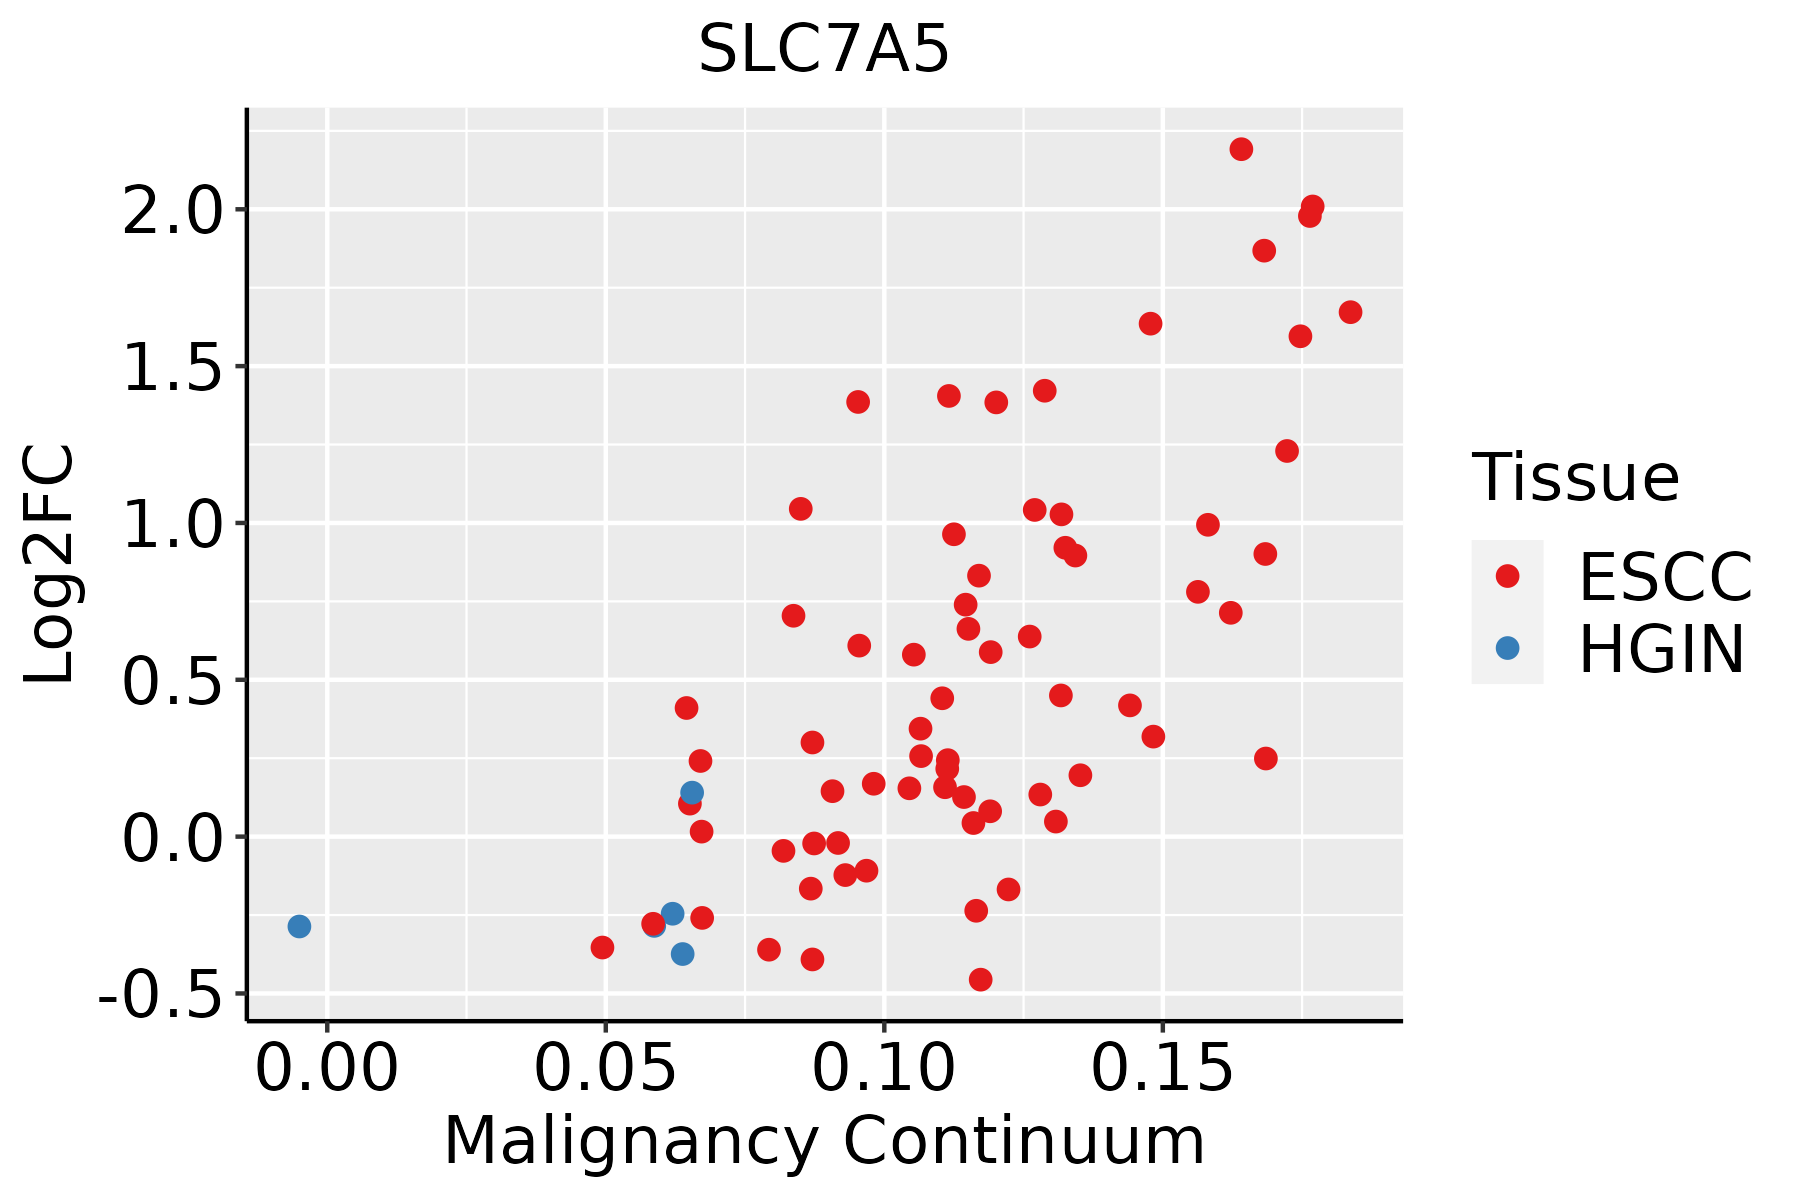 | ESCC: Esophageal squamous cell carcinoma |
| HGIN: High-grade intraepithelial neoplasias | ||
| LGIN: Low-grade intraepithelial neoplasias | ||
| Liver |  | HCC: Hepatocellular carcinoma |
| NAFLD: Non-alcoholic fatty liver disease | ||
| Oral Cavity | 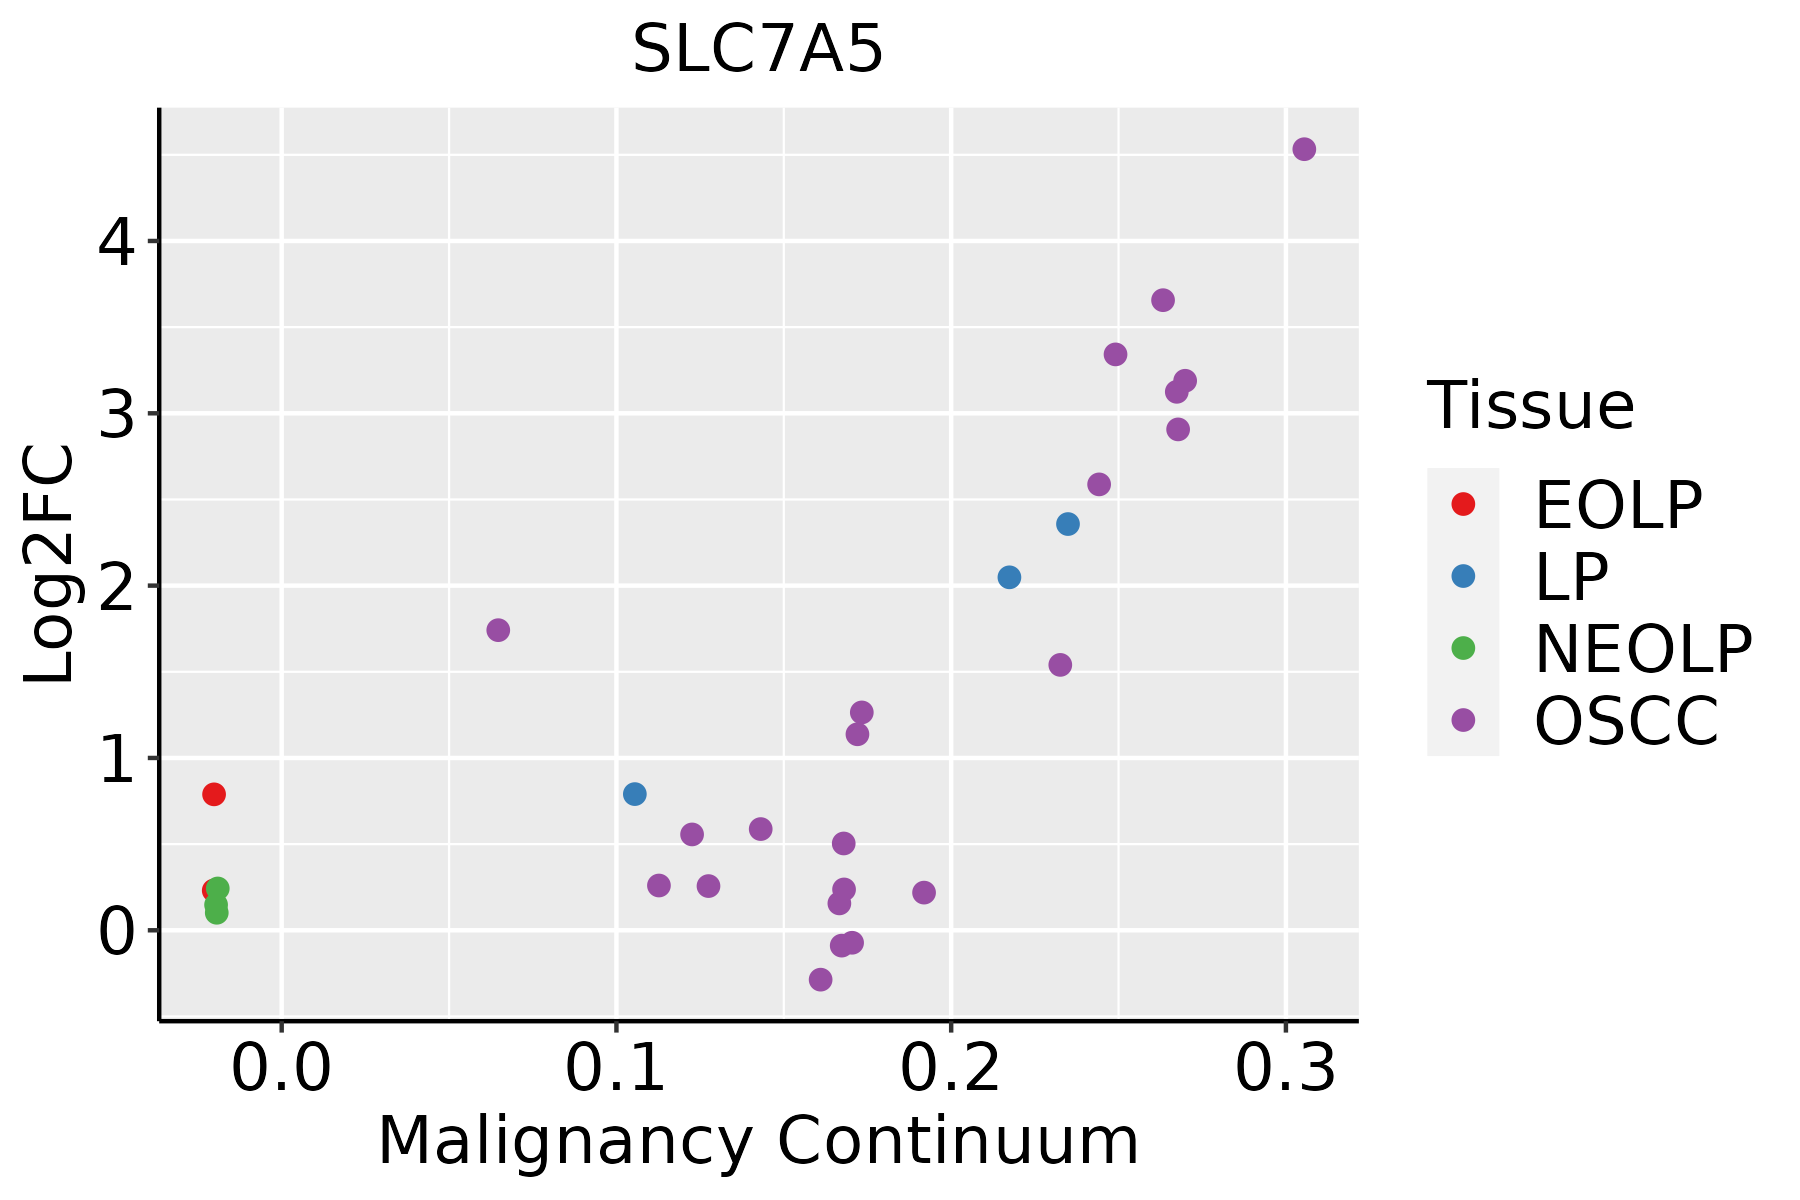 | EOLP: Erosive Oral lichen planus |
| LP: leukoplakia | ||
| NEOLP: Non-erosive oral lichen planus | ||
| OSCC: Oral squamous cell carcinoma | ||
| Skin | 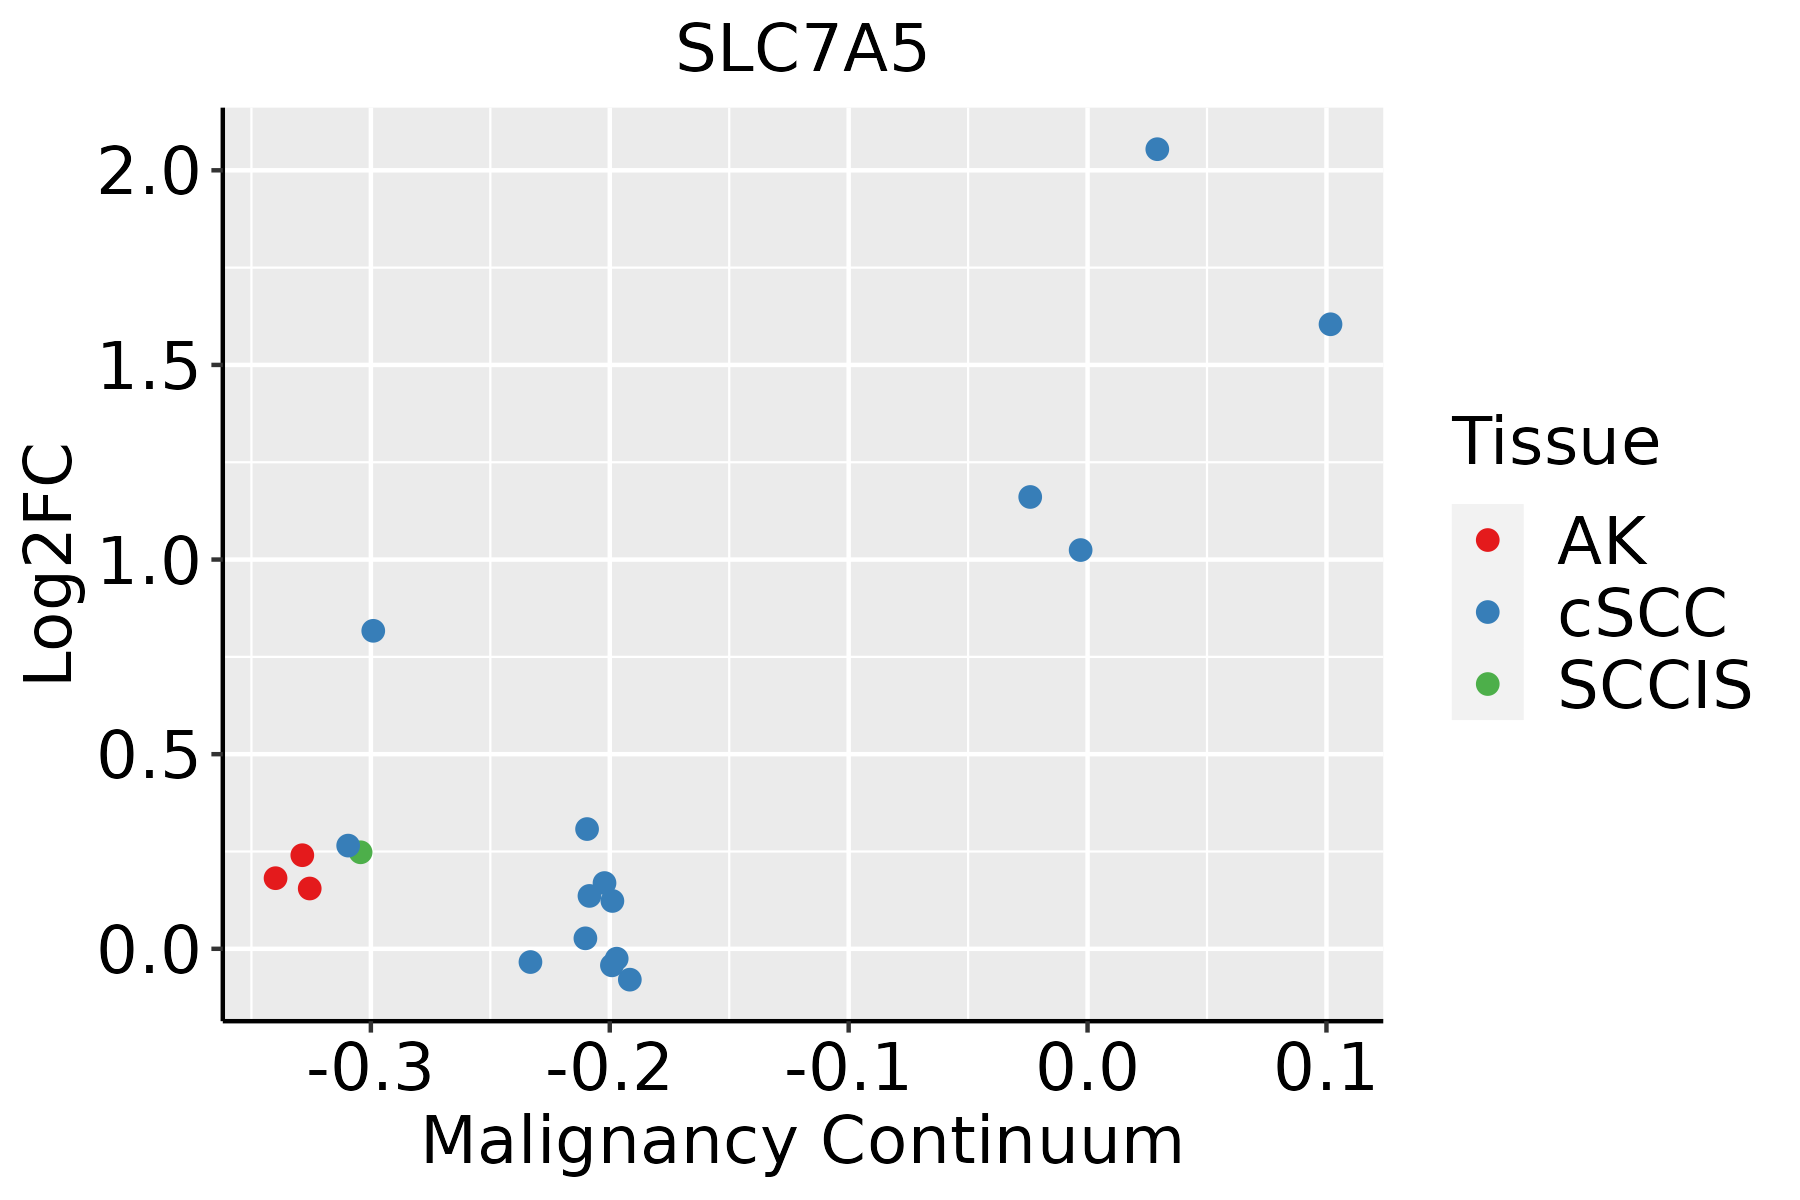 | AK: Actinic keratosis |
| cSCC: Cutaneous squamous cell carcinoma | ||
| SCCIS:squamous cell carcinoma in situ | ||
| Thyroid |  | ATC: Anaplastic thyroid cancer |
| HT: Hashimoto's thyroiditis | ||
| PTC: Papillary thyroid cancer |
| ∗log2FC in expression of this searched gene in stem-like cells from each diseased tissue sample relative to stem-like cells in normal samples in each tissue plotted against the malignancy continuum. Samples are colored based on if they are from different disease stage. |
Top |
Malignant transformation related pathway analysis |
| Find out the enriched GO biological processes and KEGG pathways involved in transition from healthy to precancer to cancer |
| Tissue | Disease Stage | Enriched GO biological Processes |
| Liver | Cyst |  |
| Lung | IAC |  |
| Lung | AIS |  |
| Lung | AAH |  |
| Lung | MIAC |  |
| ∗Top 15 enriched GO BP terms are showed in the bar plot of each disease state in each tissue. Each row represents a significant GO biological process which is colored according to the -log10(p.adjust). |
| Page: 1 2 3 4 5 6 7 8 9 |
| GO ID | Tissue | Disease Stage | Description | Gene Ratio | Bg Ratio | pvalue | p.adjust | Count |
| GO:0150104 | Colorectum | MSS | transport across blood-brain barrier | 28/3467 | 87/18723 | 1.54e-03 | 1.41e-02 | 28 |
| GO:0010232 | Colorectum | MSS | vascular transport | 28/3467 | 88/18723 | 1.87e-03 | 1.64e-02 | 28 |
| GO:00018198 | Endometrium | AEH | positive regulation of cytokine production | 71/2100 | 467/18723 | 4.76e-03 | 3.02e-02 | 71 |
| GO:000181913 | Endometrium | EEC | positive regulation of cytokine production | 73/2168 | 467/18723 | 4.64e-03 | 2.97e-02 | 73 |
| GO:000181916 | Esophagus | ESCC | positive regulation of cytokine production | 244/8552 | 467/18723 | 2.29e-03 | 1.01e-02 | 244 |
| GO:015010411 | Liver | HCC | transport across blood-brain barrier | 50/7958 | 87/18723 | 3.42e-03 | 1.55e-02 | 50 |
| GO:001023211 | Liver | HCC | vascular transport | 50/7958 | 88/18723 | 4.69e-03 | 2.02e-02 | 50 |
| GO:000181910 | Oral cavity | OSCC | positive regulation of cytokine production | 213/7305 | 467/18723 | 1.93e-03 | 8.96e-03 | 213 |
| GO:00027022 | Oral cavity | OSCC | positive regulation of production of molecular mediator of immune response | 58/7305 | 117/18723 | 1.28e-02 | 4.27e-02 | 58 |
| GO:000181915 | Oral cavity | EOLP | positive regulation of cytokine production | 87/2218 | 467/18723 | 1.08e-05 | 1.92e-04 | 87 |
| GO:00026974 | Oral cavity | EOLP | regulation of immune effector process | 61/2218 | 339/18723 | 5.48e-04 | 4.68e-03 | 61 |
| GO:0002700 | Oral cavity | EOLP | regulation of production of molecular mediator of immune response | 32/2218 | 164/18723 | 2.98e-03 | 1.75e-02 | 32 |
| GO:00027203 | Oral cavity | EOLP | positive regulation of cytokine production involved in immune response | 15/2218 | 65/18723 | 7.93e-03 | 3.76e-02 | 15 |
| GO:00027021 | Oral cavity | EOLP | positive regulation of production of molecular mediator of immune response | 23/2218 | 117/18723 | 9.76e-03 | 4.42e-02 | 23 |
| GO:000181917 | Skin | AK | positive regulation of cytokine production | 67/1910 | 467/18723 | 2.59e-03 | 1.67e-02 | 67 |
| GO:000181918 | Skin | SCCIS | positive regulation of cytokine production | 38/919 | 467/18723 | 1.63e-03 | 1.81e-02 | 38 |
| GO:000181924 | Thyroid | ATC | positive regulation of cytokine production | 189/6293 | 467/18723 | 1.00e-03 | 5.31e-03 | 189 |
| Page: 1 |
| Pathway ID | Tissue | Disease Stage | Description | Gene Ratio | Bg Ratio | pvalue | p.adjust | qvalue | Count |
| hsa052304 | Colorectum | MSS | Central carbon metabolism in cancer | 25/1875 | 70/8465 | 6.50e-03 | 2.64e-02 | 1.62e-02 | 25 |
| hsa04150 | Colorectum | MSS | mTOR signaling pathway | 47/1875 | 156/8465 | 1.19e-02 | 3.99e-02 | 2.44e-02 | 47 |
| hsa052305 | Colorectum | MSS | Central carbon metabolism in cancer | 25/1875 | 70/8465 | 6.50e-03 | 2.64e-02 | 1.62e-02 | 25 |
| hsa041501 | Colorectum | MSS | mTOR signaling pathway | 47/1875 | 156/8465 | 1.19e-02 | 3.99e-02 | 2.44e-02 | 47 |
| hsa0523018 | Esophagus | ESCC | Central carbon metabolism in cancer | 50/4205 | 70/8465 | 1.70e-04 | 6.62e-04 | 3.39e-04 | 50 |
| hsa041505 | Esophagus | ESCC | mTOR signaling pathway | 98/4205 | 156/8465 | 5.81e-04 | 1.95e-03 | 9.97e-04 | 98 |
| hsa0523019 | Esophagus | ESCC | Central carbon metabolism in cancer | 50/4205 | 70/8465 | 1.70e-04 | 6.62e-04 | 3.39e-04 | 50 |
| hsa0415013 | Esophagus | ESCC | mTOR signaling pathway | 98/4205 | 156/8465 | 5.81e-04 | 1.95e-03 | 9.97e-04 | 98 |
| hsa041502 | Liver | HCC | mTOR signaling pathway | 95/4020 | 156/8465 | 4.70e-04 | 1.99e-03 | 1.11e-03 | 95 |
| hsa0415011 | Liver | HCC | mTOR signaling pathway | 95/4020 | 156/8465 | 4.70e-04 | 1.99e-03 | 1.11e-03 | 95 |
| hsa0523016 | Oral cavity | OSCC | Central carbon metabolism in cancer | 49/3704 | 70/8465 | 7.57e-06 | 3.59e-05 | 1.83e-05 | 49 |
| hsa041504 | Oral cavity | OSCC | mTOR signaling pathway | 90/3704 | 156/8465 | 2.87e-04 | 9.15e-04 | 4.66e-04 | 90 |
| hsa0523017 | Oral cavity | OSCC | Central carbon metabolism in cancer | 49/3704 | 70/8465 | 7.57e-06 | 3.59e-05 | 1.83e-05 | 49 |
| hsa0415012 | Oral cavity | OSCC | mTOR signaling pathway | 90/3704 | 156/8465 | 2.87e-04 | 9.15e-04 | 4.66e-04 | 90 |
| hsa0523023 | Oral cavity | LP | Central carbon metabolism in cancer | 31/2418 | 70/8465 | 3.50e-03 | 1.46e-02 | 9.40e-03 | 31 |
| hsa0523033 | Oral cavity | LP | Central carbon metabolism in cancer | 31/2418 | 70/8465 | 3.50e-03 | 1.46e-02 | 9.40e-03 | 31 |
| hsa0415021 | Oral cavity | EOLP | mTOR signaling pathway | 34/1218 | 156/8465 | 7.59e-03 | 2.17e-02 | 1.28e-02 | 34 |
| hsa041503 | Oral cavity | EOLP | mTOR signaling pathway | 34/1218 | 156/8465 | 7.59e-03 | 2.17e-02 | 1.28e-02 | 34 |
| Page: 1 |
Top |
Cell-cell communication analysis |
| Identification of potential cell-cell interactions between two cell types and their ligand-receptor pairs for different disease states |
| Ligand | Receptor | LRpair | Pathway | Tissue | Disease Stage |
| Page: 1 |
Top |
Single-cell gene regulatory network inference analysis |
| Find out the significant the regulons (TFs) and the target genes of each regulon across cell types for different disease states |
| TF | Cell Type | Tissue | Disease Stage | Target Gene | RSS | Regulon Activity |
| ∗The dot plots of a searched regulon are shown for all cell subpopulations in each disease state of each tissue based on the regulon specific score inferred using pySCENIC and by calculating the average expression. |
| Page: 1 |
Top |
Somatic mutation of malignant transformation related genes |
| Annotation of somatic variants for genes involved in malignant transformation |
| Hugo Symbol | Variant Class | Variant Classification | dbSNP RS | HGVSc | HGVSp | HGVSp Short | SWISSPROT | BIOTYPE | SIFT | PolyPhen | Tumor Sample Barcode | Tissue | Histology | Sex | Age | Stage | Therapy Types | Drugs | Outcome |
| SLC7A5 | SNV | Missense_Mutation | c.679C>G | p.Leu227Val | p.L227V | Q01650 | protein_coding | deleterious(0.02) | possibly_damaging(0.783) | TCGA-D8-A1JK-01 | Breast | breast invasive carcinoma | Female | >=65 | I/II | Unknown | Unknown | SD | |
| SLC7A5 | insertion | In_Frame_Ins | novel | c.724_725insGGCGGCTGAGCCCTGCGGCCCCTTTCCTCC | p.Asn242delinsArgArgLeuSerProAlaAlaProPheLeuHis | p.N242delinsRRLSPAAPFLH | Q01650 | protein_coding | TCGA-B6-A0RE-01 | Breast | breast invasive carcinoma | Female | <65 | I/II | Unknown | Unknown | SD | ||
| SLC7A5 | SNV | Missense_Mutation | novel | c.1123C>T | p.Pro375Ser | p.P375S | Q01650 | protein_coding | deleterious(0) | probably_damaging(1) | TCGA-2W-A8YY-01 | Cervix | cervical & endocervical cancer | Female | <65 | I/II | Chemotherapy | cisplatin | CR |
| SLC7A5 | SNV | Missense_Mutation | novel | c.868G>A | p.Val290Met | p.V290M | Q01650 | protein_coding | deleterious(0.02) | probably_damaging(0.997) | TCGA-2W-A8YY-01 | Cervix | cervical & endocervical cancer | Female | <65 | I/II | Chemotherapy | cisplatin | CR |
| SLC7A5 | SNV | Missense_Mutation | novel | c.788T>C | p.Val263Ala | p.V263A | Q01650 | protein_coding | deleterious(0.01) | probably_damaging(0.978) | TCGA-EA-A410-01 | Cervix | cervical & endocervical cancer | Female | <65 | I/II | Unknown | Unknown | SD |
| SLC7A5 | SNV | Missense_Mutation | rs547150259 | c.658N>A | p.Gly220Arg | p.G220R | Q01650 | protein_coding | tolerated(0.31) | possibly_damaging(0.603) | TCGA-VS-A9UO-01 | Cervix | cervical & endocervical cancer | Female | <65 | I/II | Chemotherapy | cisplatin | CR |
| SLC7A5 | SNV | Missense_Mutation | rs183791552 | c.1132N>A | p.Val378Met | p.V378M | Q01650 | protein_coding | tolerated(0.06) | benign(0.121) | TCGA-AA-3811-01 | Colorectum | colon adenocarcinoma | Female | >=65 | III/IV | Unknown | Unknown | PD |
| SLC7A5 | SNV | Missense_Mutation | rs200265403 | c.1480N>A | p.Val494Ile | p.V494I | Q01650 | protein_coding | tolerated(0.43) | benign(0.003) | TCGA-AA-A01T-01 | Colorectum | colon adenocarcinoma | Female | <65 | III/IV | Chemotherapy | 5-fluorouracil | CR |
| SLC7A5 | SNV | Missense_Mutation | c.693C>A | p.Phe231Leu | p.F231L | Q01650 | protein_coding | tolerated(0.64) | benign(0) | TCGA-CA-6717-01 | Colorectum | colon adenocarcinoma | Male | <65 | I/II | Chemotherapy | oxaliplatin | CR | |
| SLC7A5 | SNV | Missense_Mutation | rs200265403 | c.1480N>A | p.Val494Ile | p.V494I | Q01650 | protein_coding | tolerated(0.43) | benign(0.003) | TCGA-CK-5913-01 | Colorectum | colon adenocarcinoma | Female | <65 | I/II | Unknown | Unknown | SD |
| Page: 1 2 3 4 5 |
Top |
Related drugs of malignant transformation related genes |
| Identification of chemicals and drugs interact with genes involved in malignant transfromation |
| (DGIdb 4.0) |
| Entrez ID | Symbol | Category | Interaction Types | Drug Claim Name | Drug Name | PMIDs |
| 8140 | SLC7A5 | TRANSPORTER, EXTERNAL SIDE OF PLASMA MEMBRANE, DRUGGABLE GENOME | inhibitor | 328083449 | ||
| 8140 | SLC7A5 | TRANSPORTER, EXTERNAL SIDE OF PLASMA MEMBRANE, DRUGGABLE GENOME | melphalan | MELPHALAN |
| Page: 1 |

Copyright 2023-Present -The University of Texas Health Science Center at Houston |