
|
|||||
|
 | |
| |
| |
| |
| |
| |
|
Gene: SHROOM1 |
Gene summary for SHROOM1 |
| Gene information | Species | Human | Gene symbol | SHROOM1 | Gene ID | 134549 |
| Gene name | shroom family member 1 | |
| Gene Alias | APXL2 | |
| Cytomap | 5q31.1 | |
| Gene Type | protein-coding | GO ID | GO:0000902 | UniProtAcc | Q2M3G4 |
Top |
Malignant transformation analysis |
| Identification of the aberrant gene expression in precancerous and cancerous lesions by comparing the gene expression of stem-like cells in diseased tissues with normal stem cells |
| Entrez ID | Symbol | Replicates | Species | Organ | Tissue | Adj P-value | Log2FC | Malignancy |
| 134549 | SHROOM1 | HTA11_2487_2000001011 | Human | Colorectum | SER | 2.79e-08 | 4.56e-01 | -0.1808 |
| 134549 | SHROOM1 | HTA11_1938_2000001011 | Human | Colorectum | AD | 8.31e-15 | 6.52e-01 | -0.0811 |
| 134549 | SHROOM1 | HTA11_78_2000001011 | Human | Colorectum | AD | 5.59e-07 | 5.11e-01 | -0.1088 |
| 134549 | SHROOM1 | HTA11_347_2000001011 | Human | Colorectum | AD | 2.87e-16 | 5.40e-01 | -0.1954 |
| 134549 | SHROOM1 | HTA11_2112_2000001011 | Human | Colorectum | SER | 1.93e-06 | 6.25e-01 | -0.2196 |
| 134549 | SHROOM1 | HTA11_3361_2000001011 | Human | Colorectum | AD | 8.02e-04 | 4.34e-01 | -0.1207 |
| 134549 | SHROOM1 | HTA11_83_2000001011 | Human | Colorectum | SER | 5.67e-05 | 4.44e-01 | -0.1526 |
| 134549 | SHROOM1 | HTA11_696_2000001011 | Human | Colorectum | AD | 1.63e-08 | 4.09e-01 | -0.1464 |
| 134549 | SHROOM1 | HTA11_866_2000001011 | Human | Colorectum | AD | 1.18e-06 | 3.65e-01 | -0.1001 |
| 134549 | SHROOM1 | HTA11_1391_2000001011 | Human | Colorectum | AD | 7.96e-06 | 3.52e-01 | -0.059 |
| 134549 | SHROOM1 | HTA11_866_3004761011 | Human | Colorectum | AD | 2.67e-05 | 1.99e-01 | 0.096 |
| 134549 | SHROOM1 | HTA11_10711_2000001011 | Human | Colorectum | AD | 2.00e-08 | 3.80e-01 | 0.0338 |
| 134549 | SHROOM1 | HTA11_7696_3000711011 | Human | Colorectum | AD | 3.87e-04 | 2.63e-01 | 0.0674 |
| 134549 | SHROOM1 | HTA11_6818_2000001021 | Human | Colorectum | AD | 4.58e-06 | 4.50e-01 | 0.0588 |
| 134549 | SHROOM1 | HTA11_99999973899_84307 | Human | Colorectum | MSS | 7.23e-03 | 3.91e-01 | 0.2585 |
| 134549 | SHROOM1 | A002-C-203 | Human | Colorectum | FAP | 3.08e-03 | 4.38e-01 | 0.2786 |
| 134549 | SHROOM1 | A002-C-021 | Human | Colorectum | FAP | 1.88e-05 | 3.35e-01 | 0.1171 |
| 134549 | SHROOM1 | A015-C-104 | Human | Colorectum | FAP | 2.07e-02 | 1.72e-01 | -0.1899 |
| 134549 | SHROOM1 | S43 | Human | Liver | Cirrhotic | 3.59e-08 | -1.44e-01 | -0.0187 |
| 134549 | SHROOM1 | HCC1_Meng | Human | Liver | HCC | 9.36e-47 | -9.07e-02 | 0.0246 |
| Page: 1 2 |
| Tissue | Expression Dynamics | Abbreviation |
| Colorectum (GSE201348) | 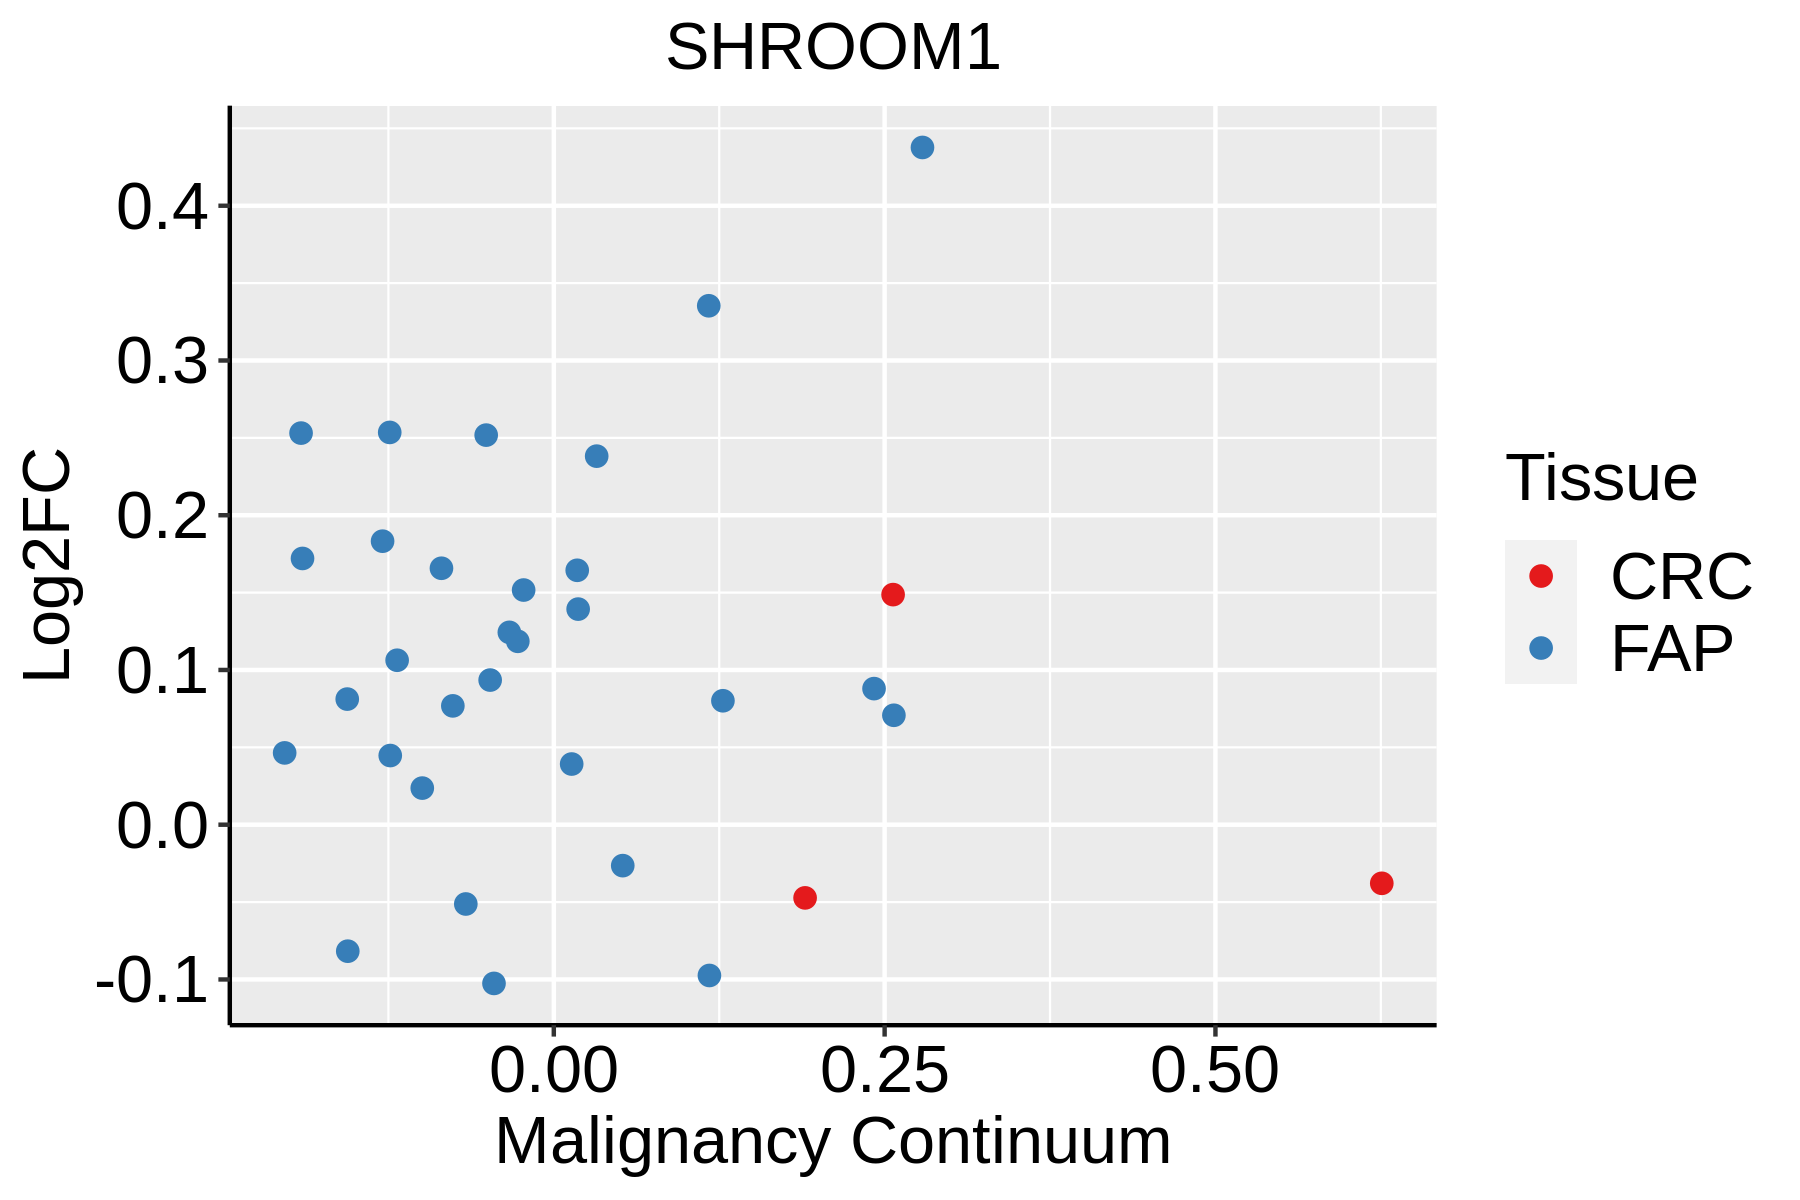 | FAP: Familial adenomatous polyposis |
| CRC: Colorectal cancer | ||
| Colorectum (HTA11) |  | AD: Adenomas |
| SER: Sessile serrated lesions | ||
| MSI-H: Microsatellite-high colorectal cancer | ||
| MSS: Microsatellite stable colorectal cancer | ||
| Liver | 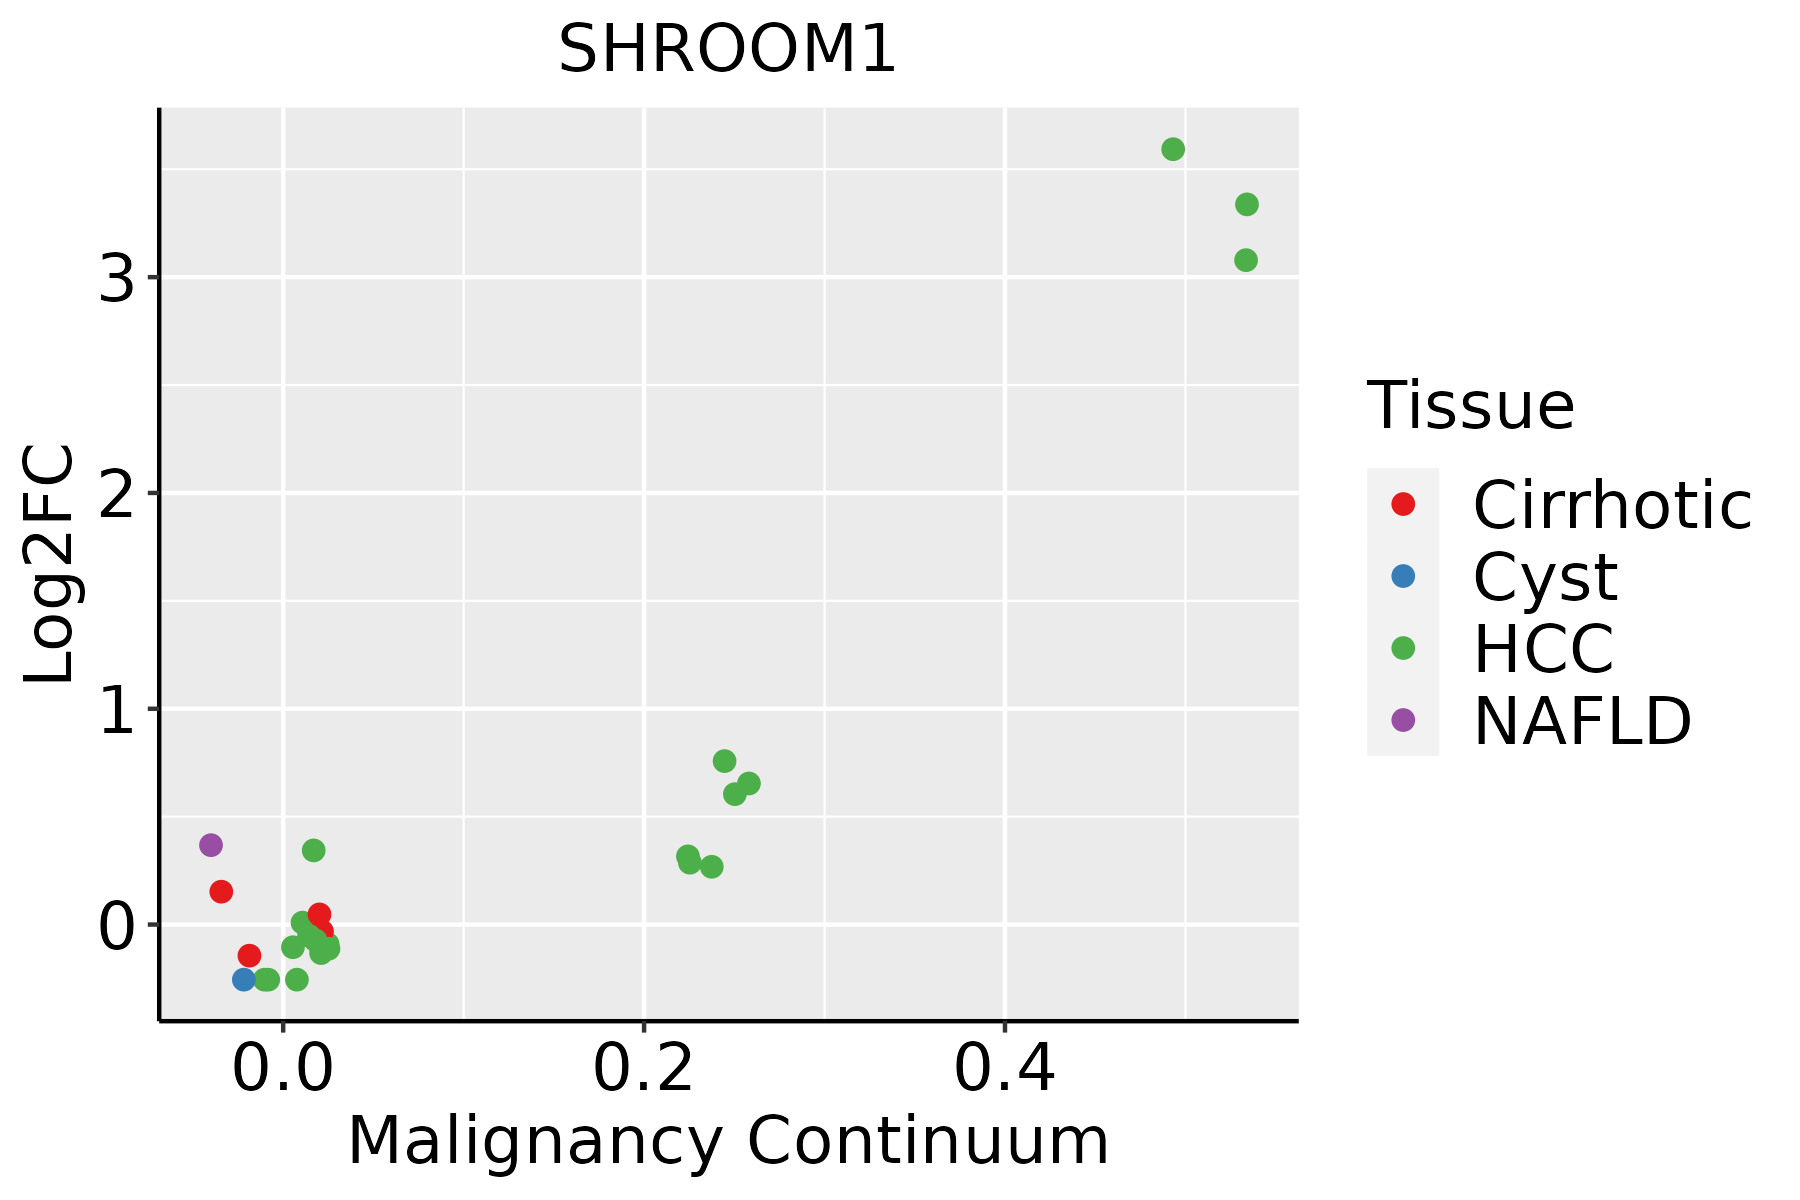 | HCC: Hepatocellular carcinoma |
| NAFLD: Non-alcoholic fatty liver disease | ||
| Prostate | 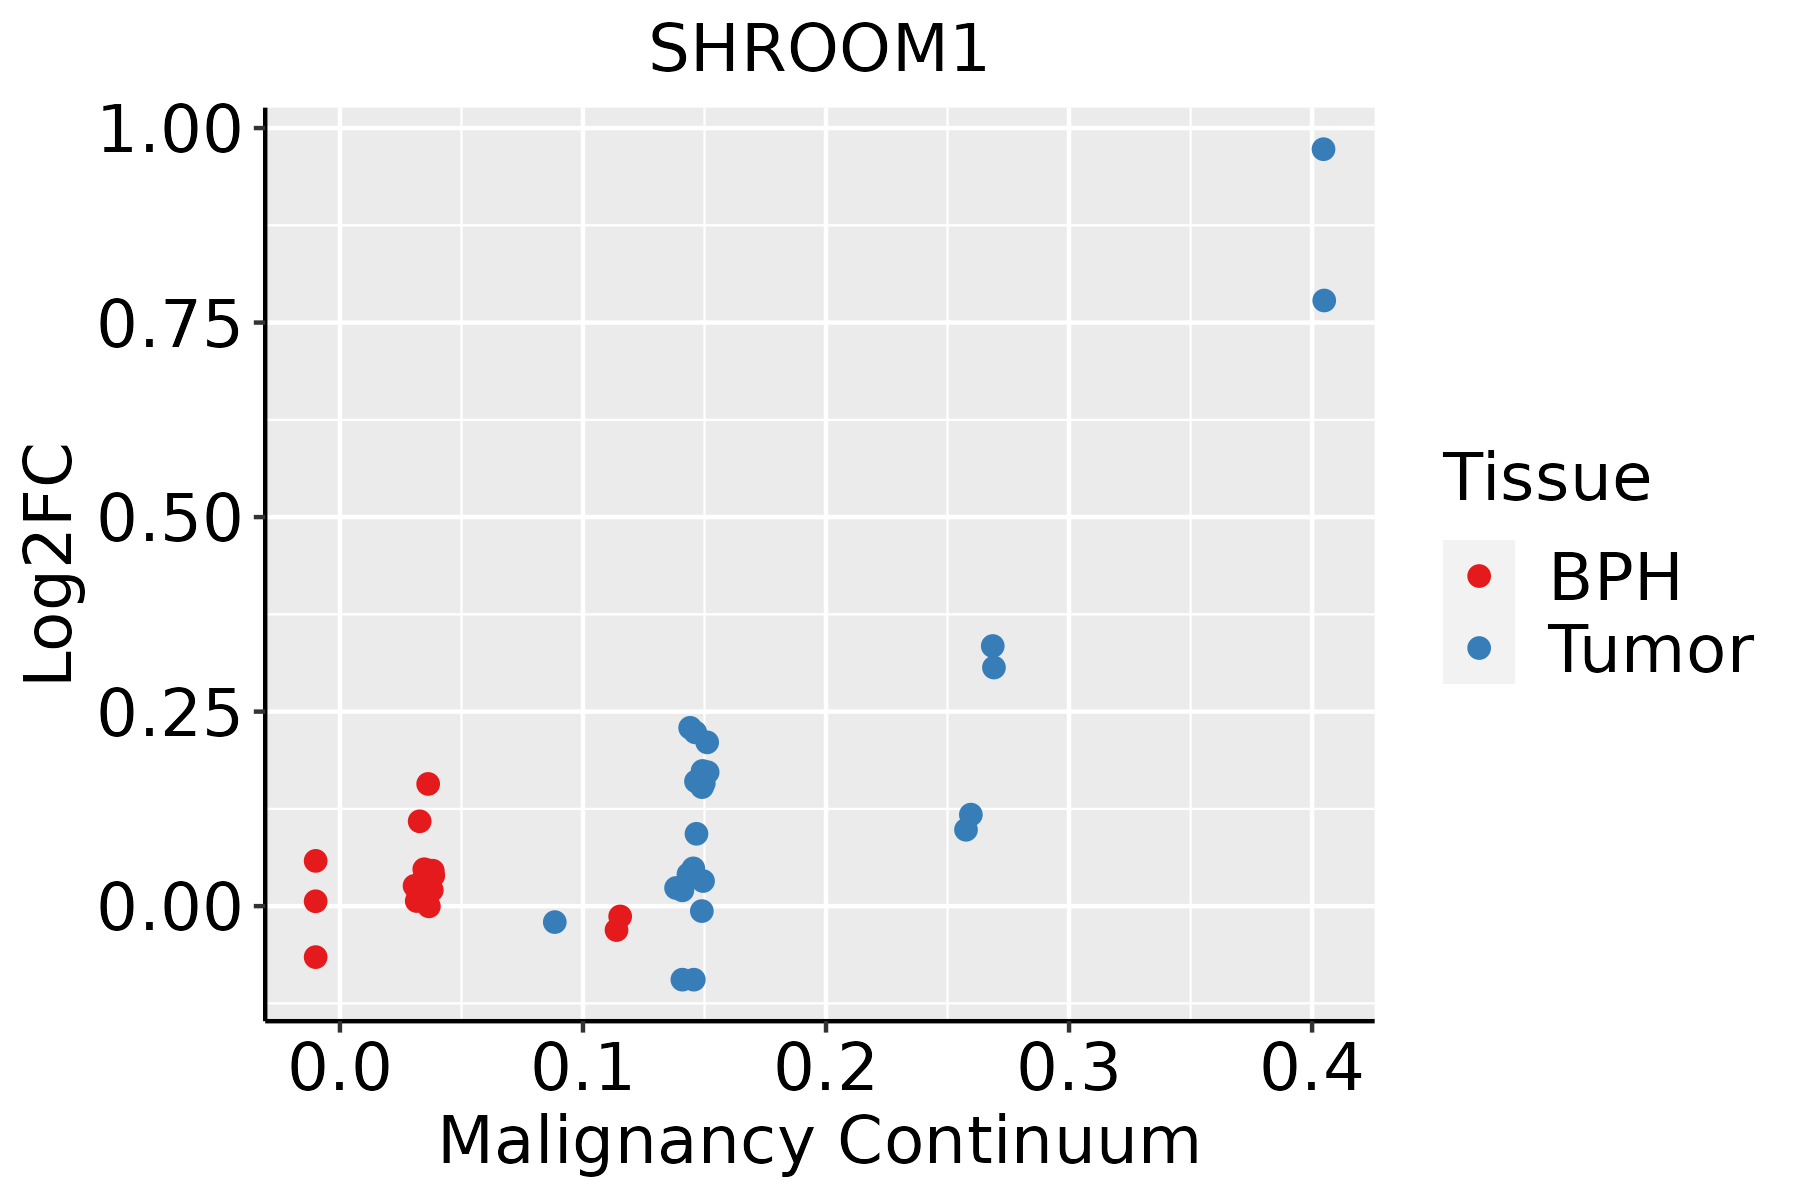 | BPH: Benign Prostatic Hyperplasia |
| ∗log2FC in expression of this searched gene in stem-like cells from each diseased tissue sample relative to stem-like cells in normal samples in each tissue plotted against the malignancy continuum. Samples are colored based on if they are from different disease stage. |
Top |
Malignant transformation related pathway analysis |
| Find out the enriched GO biological processes and KEGG pathways involved in transition from healthy to precancer to cancer |
| Tissue | Disease Stage | Enriched GO biological Processes |
| Liver | Cyst |  |
| Lung | IAC |  |
| Lung | AIS |  |
| Lung | AAH |  |
| Lung | MIAC |  |
| ∗Top 15 enriched GO BP terms are showed in the bar plot of each disease state in each tissue. Each row represents a significant GO biological process which is colored according to the -log10(p.adjust). |
| Page: 1 2 3 4 5 6 7 8 9 |
| GO ID | Tissue | Disease Stage | Description | Gene Ratio | Bg Ratio | pvalue | p.adjust | Count |
| GO:0007015 | Colorectum | AD | actin filament organization | 167/3918 | 442/18723 | 1.65e-16 | 7.94e-14 | 167 |
| GO:0061572 | Colorectum | AD | actin filament bundle organization | 60/3918 | 161/18723 | 1.33e-06 | 4.23e-05 | 60 |
| GO:0051017 | Colorectum | AD | actin filament bundle assembly | 58/3918 | 157/18723 | 2.74e-06 | 7.89e-05 | 58 |
| GO:00070151 | Colorectum | SER | actin filament organization | 134/2897 | 442/18723 | 1.39e-15 | 5.70e-13 | 134 |
| GO:00615721 | Colorectum | SER | actin filament bundle organization | 48/2897 | 161/18723 | 2.97e-06 | 1.19e-04 | 48 |
| GO:00510171 | Colorectum | SER | actin filament bundle assembly | 46/2897 | 157/18723 | 7.88e-06 | 2.69e-04 | 46 |
| GO:00070152 | Colorectum | MSS | actin filament organization | 146/3467 | 442/18723 | 1.16e-13 | 2.67e-11 | 146 |
| GO:00615722 | Colorectum | MSS | actin filament bundle organization | 50/3467 | 161/18723 | 8.18e-05 | 1.35e-03 | 50 |
| GO:00510172 | Colorectum | MSS | actin filament bundle assembly | 49/3467 | 157/18723 | 8.35e-05 | 1.36e-03 | 49 |
| GO:00070154 | Colorectum | FAP | actin filament organization | 125/2622 | 442/18723 | 1.97e-15 | 3.03e-12 | 125 |
| GO:00615723 | Colorectum | FAP | actin filament bundle organization | 49/2622 | 161/18723 | 5.69e-08 | 4.30e-06 | 49 |
| GO:00510173 | Colorectum | FAP | actin filament bundle assembly | 48/2622 | 157/18723 | 6.62e-08 | 4.56e-06 | 48 |
| GO:000701512 | Liver | Cirrhotic | actin filament organization | 171/4634 | 442/18723 | 3.93e-11 | 2.30e-09 | 171 |
| GO:005101712 | Liver | Cirrhotic | actin filament bundle assembly | 69/4634 | 157/18723 | 1.06e-07 | 3.05e-06 | 69 |
| GO:006157212 | Liver | Cirrhotic | actin filament bundle organization | 70/4634 | 161/18723 | 1.44e-07 | 3.87e-06 | 70 |
| GO:000701522 | Liver | HCC | actin filament organization | 252/7958 | 442/18723 | 3.83e-10 | 1.25e-08 | 252 |
| GO:005101722 | Liver | HCC | actin filament bundle assembly | 96/7958 | 157/18723 | 1.81e-06 | 2.52e-05 | 96 |
| GO:006157222 | Liver | HCC | actin filament bundle organization | 97/7958 | 161/18723 | 4.04e-06 | 5.22e-05 | 97 |
| GO:000701519 | Prostate | Tumor | actin filament organization | 142/3246 | 442/18723 | 1.40e-14 | 1.89e-12 | 142 |
| GO:005101719 | Prostate | Tumor | actin filament bundle assembly | 63/3246 | 157/18723 | 1.18e-11 | 9.07e-10 | 63 |
| Page: 1 2 |
| Pathway ID | Tissue | Disease Stage | Description | Gene Ratio | Bg Ratio | pvalue | p.adjust | qvalue | Count |
| Page: 1 |
Top |
Cell-cell communication analysis |
| Identification of potential cell-cell interactions between two cell types and their ligand-receptor pairs for different disease states |
| Ligand | Receptor | LRpair | Pathway | Tissue | Disease Stage |
| Page: 1 |
Top |
Single-cell gene regulatory network inference analysis |
| Find out the significant the regulons (TFs) and the target genes of each regulon across cell types for different disease states |
| TF | Cell Type | Tissue | Disease Stage | Target Gene | RSS | Regulon Activity |
| ∗The dot plots of a searched regulon are shown for all cell subpopulations in each disease state of each tissue based on the regulon specific score inferred using pySCENIC and by calculating the average expression. |
| Page: 1 |
Top |
Somatic mutation of malignant transformation related genes |
| Annotation of somatic variants for genes involved in malignant transformation |
| Hugo Symbol | Variant Class | Variant Classification | dbSNP RS | HGVSc | HGVSp | HGVSp Short | SWISSPROT | BIOTYPE | SIFT | PolyPhen | Tumor Sample Barcode | Tissue | Histology | Sex | Age | Stage | Therapy Types | Drugs | Outcome |
| SHROOM1 | SNV | Missense_Mutation | novel | c.2023N>A | p.Glu675Lys | p.E675K | Q2M3G4 | protein_coding | tolerated(0.69) | benign(0.001) | TCGA-B6-A40B-01 | Breast | breast invasive carcinoma | Female | >=65 | I/II | Unknown | Unknown | SD |
| SHROOM1 | SNV | Missense_Mutation | rs368322209 | c.1627N>A | p.Glu543Lys | p.E543K | Q2M3G4 | protein_coding | deleterious(0.04) | benign(0.031) | TCGA-E2-A1IK-01 | Breast | breast invasive carcinoma | Female | >=65 | I/II | Hormone Therapy | arimidex | SD |
| SHROOM1 | insertion | In_Frame_Ins | novel | c.1319_1320insTAGTCAGTGCCTCGAGGAGCTGGTTCAGGA | p.Pro440_Leu441insSerGlnCysLeuGluGluLeuValGlnGlu | p.P440_L441insSQCLEELVQE | Q2M3G4 | protein_coding | TCGA-A2-A0D2-01 | Breast | breast invasive carcinoma | Female | <65 | I/II | Chemotherapy | adriamycin | SD | ||
| SHROOM1 | SNV | Missense_Mutation | c.1486N>A | p.Glu496Lys | p.E496K | Q2M3G4 | protein_coding | tolerated(0.06) | possibly_damaging(0.854) | TCGA-DG-A2KL-01 | Cervix | cervical & endocervical cancer | Female | <65 | I/II | Chemotherapy | cisplatin | SD | |
| SHROOM1 | SNV | Missense_Mutation | rs751016823 | c.791N>T | p.Ala264Val | p.A264V | Q2M3G4 | protein_coding | tolerated(0.26) | benign(0.001) | TCGA-EA-A3HU-01 | Cervix | cervical & endocervical cancer | Female | <65 | I/II | Unknown | Unknown | SD |
| SHROOM1 | SNV | Missense_Mutation | novel | c.1000N>C | p.Thr334Pro | p.T334P | Q2M3G4 | protein_coding | tolerated(0.3) | benign(0.001) | TCGA-AA-A010-01 | Colorectum | colon adenocarcinoma | Female | <65 | I/II | Chemotherapy | folinic | CR |
| SHROOM1 | SNV | Missense_Mutation | rs748264255 | c.1966G>A | p.Ala656Thr | p.A656T | Q2M3G4 | protein_coding | tolerated(0.11) | benign(0.06) | TCGA-AD-A5EJ-01 | Colorectum | colon adenocarcinoma | Female | >=65 | I/II | Unknown | Unknown | SD |
| SHROOM1 | SNV | Missense_Mutation | c.1843C>T | p.Pro615Ser | p.P615S | Q2M3G4 | protein_coding | tolerated(0.14) | benign(0.023) | TCGA-AD-A5EJ-01 | Colorectum | colon adenocarcinoma | Female | >=65 | I/II | Unknown | Unknown | SD | |
| SHROOM1 | SNV | Missense_Mutation | c.868N>A | p.Gly290Arg | p.G290R | Q2M3G4 | protein_coding | tolerated(0.46) | benign(0.003) | TCGA-D5-6530-01 | Colorectum | colon adenocarcinoma | Male | <65 | I/II | Unknown | Unknown | SD | |
| SHROOM1 | SNV | Missense_Mutation | c.2071N>T | p.Arg691Cys | p.R691C | Q2M3G4 | protein_coding | deleterious(0.01) | possibly_damaging(0.744) | TCGA-EI-6507-01 | Colorectum | rectum adenocarcinoma | Male | <65 | I/II | Unknown | Unknown | SD |
| Page: 1 2 3 4 5 |
Top |
Related drugs of malignant transformation related genes |
| Identification of chemicals and drugs interact with genes involved in malignant transfromation |
| (DGIdb 4.0) |
| Entrez ID | Symbol | Category | Interaction Types | Drug Claim Name | Drug Name | PMIDs |
| Page: 1 |

Copyright 2023-Present -The University of Texas Health Science Center at Houston |