
|
|||||
|
 | |
| |
| |
| |
| |
| |
|
Gene: SHFM1 |
Gene summary for SHFM1 |
| Gene information | Species | Human | Gene symbol | SHFM1 | Gene ID | 7979 |
| Gene name | SEM1 26S proteasome subunit | |
| Gene Alias | C7orf76 | |
| Cytomap | 7q21.3 | |
| Gene Type | protein-coding | GO ID | NA | UniProtAcc | P60896 |
Top |
Malignant transformation analysis |
| Identification of the aberrant gene expression in precancerous and cancerous lesions by comparing the gene expression of stem-like cells in diseased tissues with normal stem cells |
| Entrez ID | Symbol | Replicates | Species | Organ | Tissue | Adj P-value | Log2FC | Malignancy |
| 7979 | SHFM1 | GSM4909280 | Human | Breast | Precancer | 2.58e-03 | -4.59e-01 | 0.0305 |
| 7979 | SHFM1 | GSM4909281 | Human | Breast | IDC | 9.92e-21 | -4.59e-01 | 0.21 |
| 7979 | SHFM1 | GSM4909282 | Human | Breast | IDC | 3.31e-22 | -4.59e-01 | -0.0288 |
| 7979 | SHFM1 | GSM4909285 | Human | Breast | IDC | 4.25e-21 | -4.59e-01 | 0.21 |
| 7979 | SHFM1 | GSM4909286 | Human | Breast | IDC | 2.31e-20 | -4.59e-01 | 0.1081 |
| 7979 | SHFM1 | GSM4909287 | Human | Breast | IDC | 3.47e-27 | -4.59e-01 | 0.2057 |
| 7979 | SHFM1 | GSM4909288 | Human | Breast | IDC | 5.54e-07 | -4.59e-01 | 0.0988 |
| 7979 | SHFM1 | GSM4909289 | Human | Breast | IDC | 4.60e-05 | -4.59e-01 | 0.1064 |
| 7979 | SHFM1 | GSM4909290 | Human | Breast | IDC | 9.70e-20 | -4.59e-01 | 0.2096 |
| 7979 | SHFM1 | GSM4909291 | Human | Breast | IDC | 3.67e-16 | -4.59e-01 | 0.1753 |
| 7979 | SHFM1 | GSM4909292 | Human | Breast | IDC | 2.45e-02 | -4.59e-01 | 0.1236 |
| 7979 | SHFM1 | GSM4909293 | Human | Breast | IDC | 3.31e-22 | -4.59e-01 | 0.1581 |
| 7979 | SHFM1 | GSM4909294 | Human | Breast | IDC | 4.25e-21 | -4.59e-01 | 0.2022 |
| 7979 | SHFM1 | GSM4909295 | Human | Breast | IDC | 7.13e-13 | -4.59e-01 | 0.0898 |
| 7979 | SHFM1 | GSM4909296 | Human | Breast | IDC | 1.82e-21 | -4.59e-01 | 0.1524 |
| 7979 | SHFM1 | GSM4909297 | Human | Breast | IDC | 5.96e-23 | -4.59e-01 | 0.1517 |
| 7979 | SHFM1 | GSM4909298 | Human | Breast | IDC | 2.31e-20 | -4.59e-01 | 0.1551 |
| 7979 | SHFM1 | GSM4909299 | Human | Breast | IDC | 2.31e-20 | -4.59e-01 | 0.035 |
| 7979 | SHFM1 | GSM4909300 | Human | Breast | IDC | 1.87e-11 | -4.59e-01 | 0.0334 |
| 7979 | SHFM1 | GSM4909301 | Human | Breast | IDC | 9.92e-21 | -4.59e-01 | 0.1577 |
| Page: 1 2 3 4 5 6 7 8 9 10 11 12 13 14 15 |
| Tissue | Expression Dynamics | Abbreviation |
| Breast | 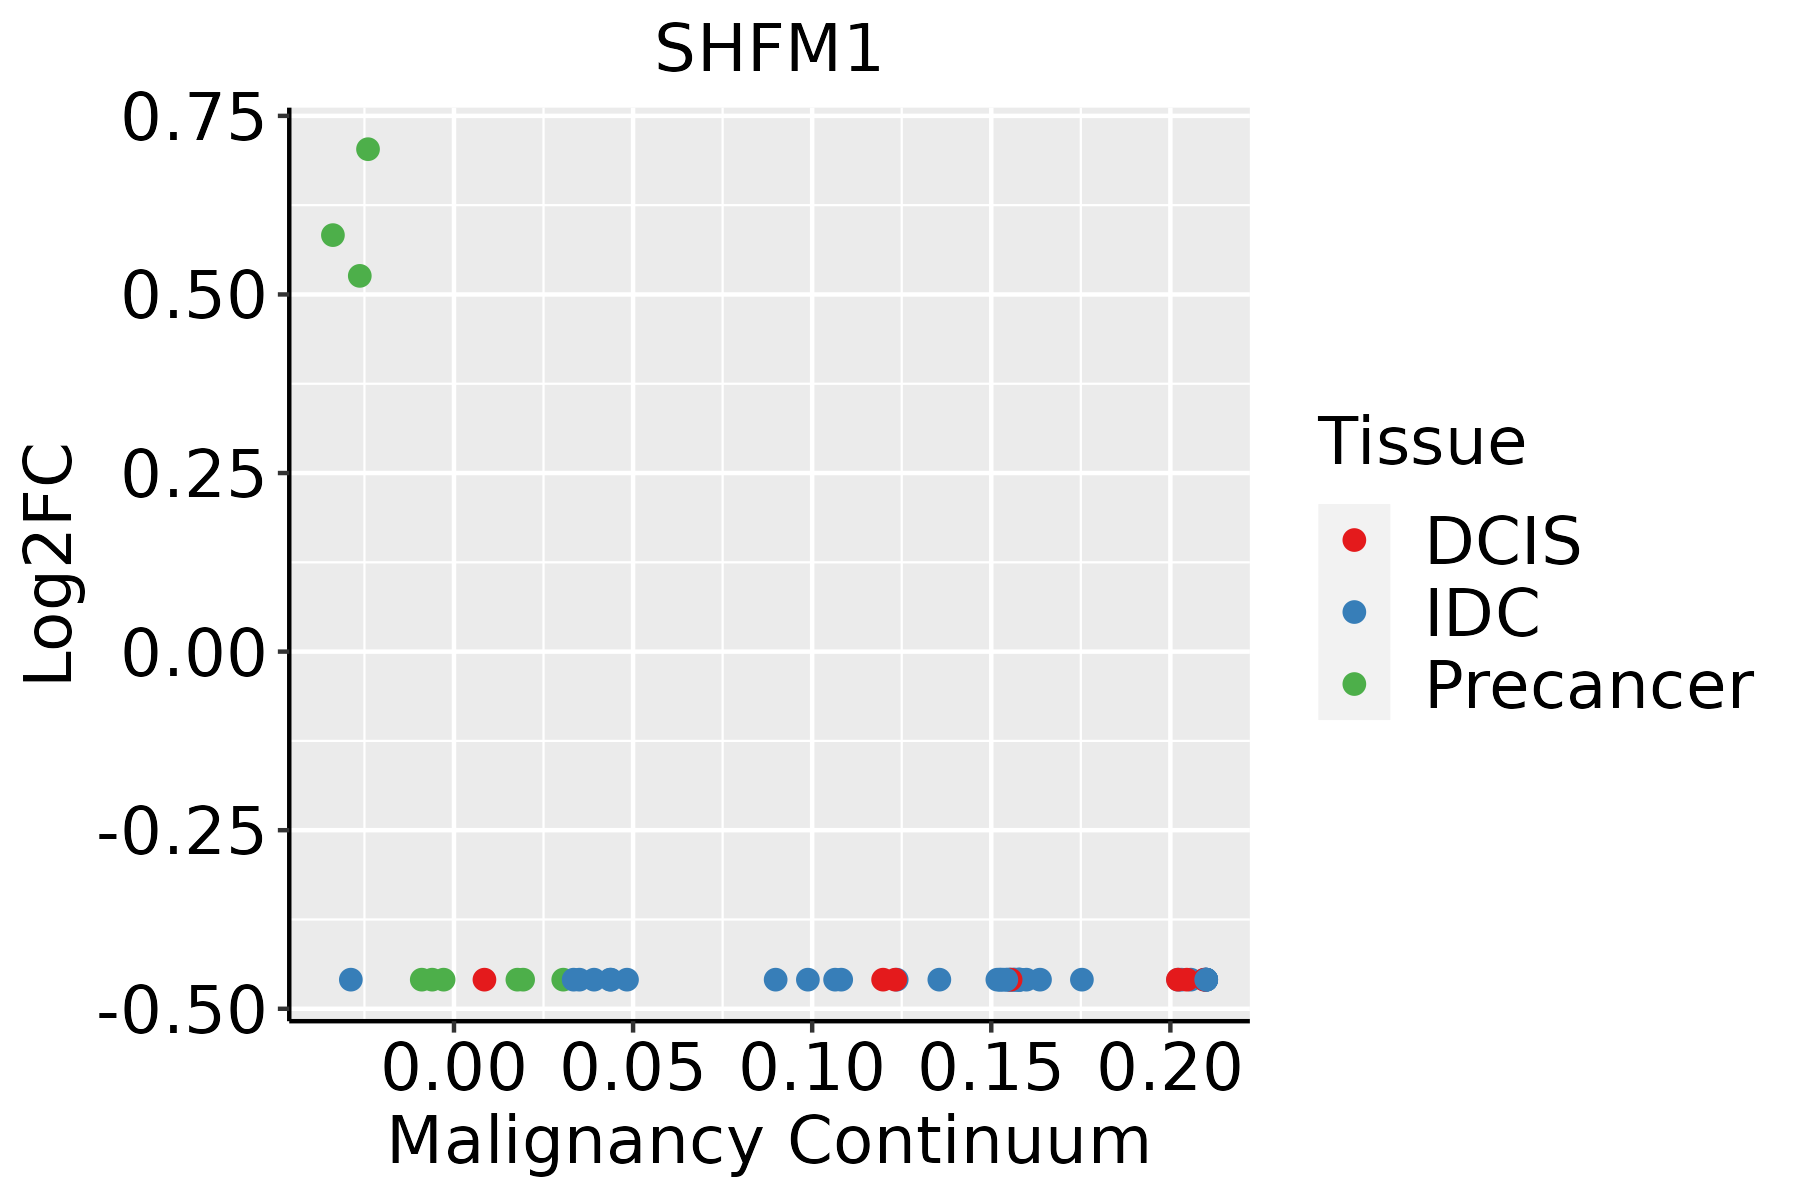 | IDC: Invasive ductal carcinoma |
| DCIS: Ductal carcinoma in situ | ||
| Precancer(BRCA1-mut): Precancerous lesion from BRCA1 mutation carriers | ||
| Colorectum (GSE201348) |  | FAP: Familial adenomatous polyposis |
| CRC: Colorectal cancer | ||
| Colorectum (HTA11) |  | AD: Adenomas |
| SER: Sessile serrated lesions | ||
| MSI-H: Microsatellite-high colorectal cancer | ||
| MSS: Microsatellite stable colorectal cancer | ||
| Endometrium | 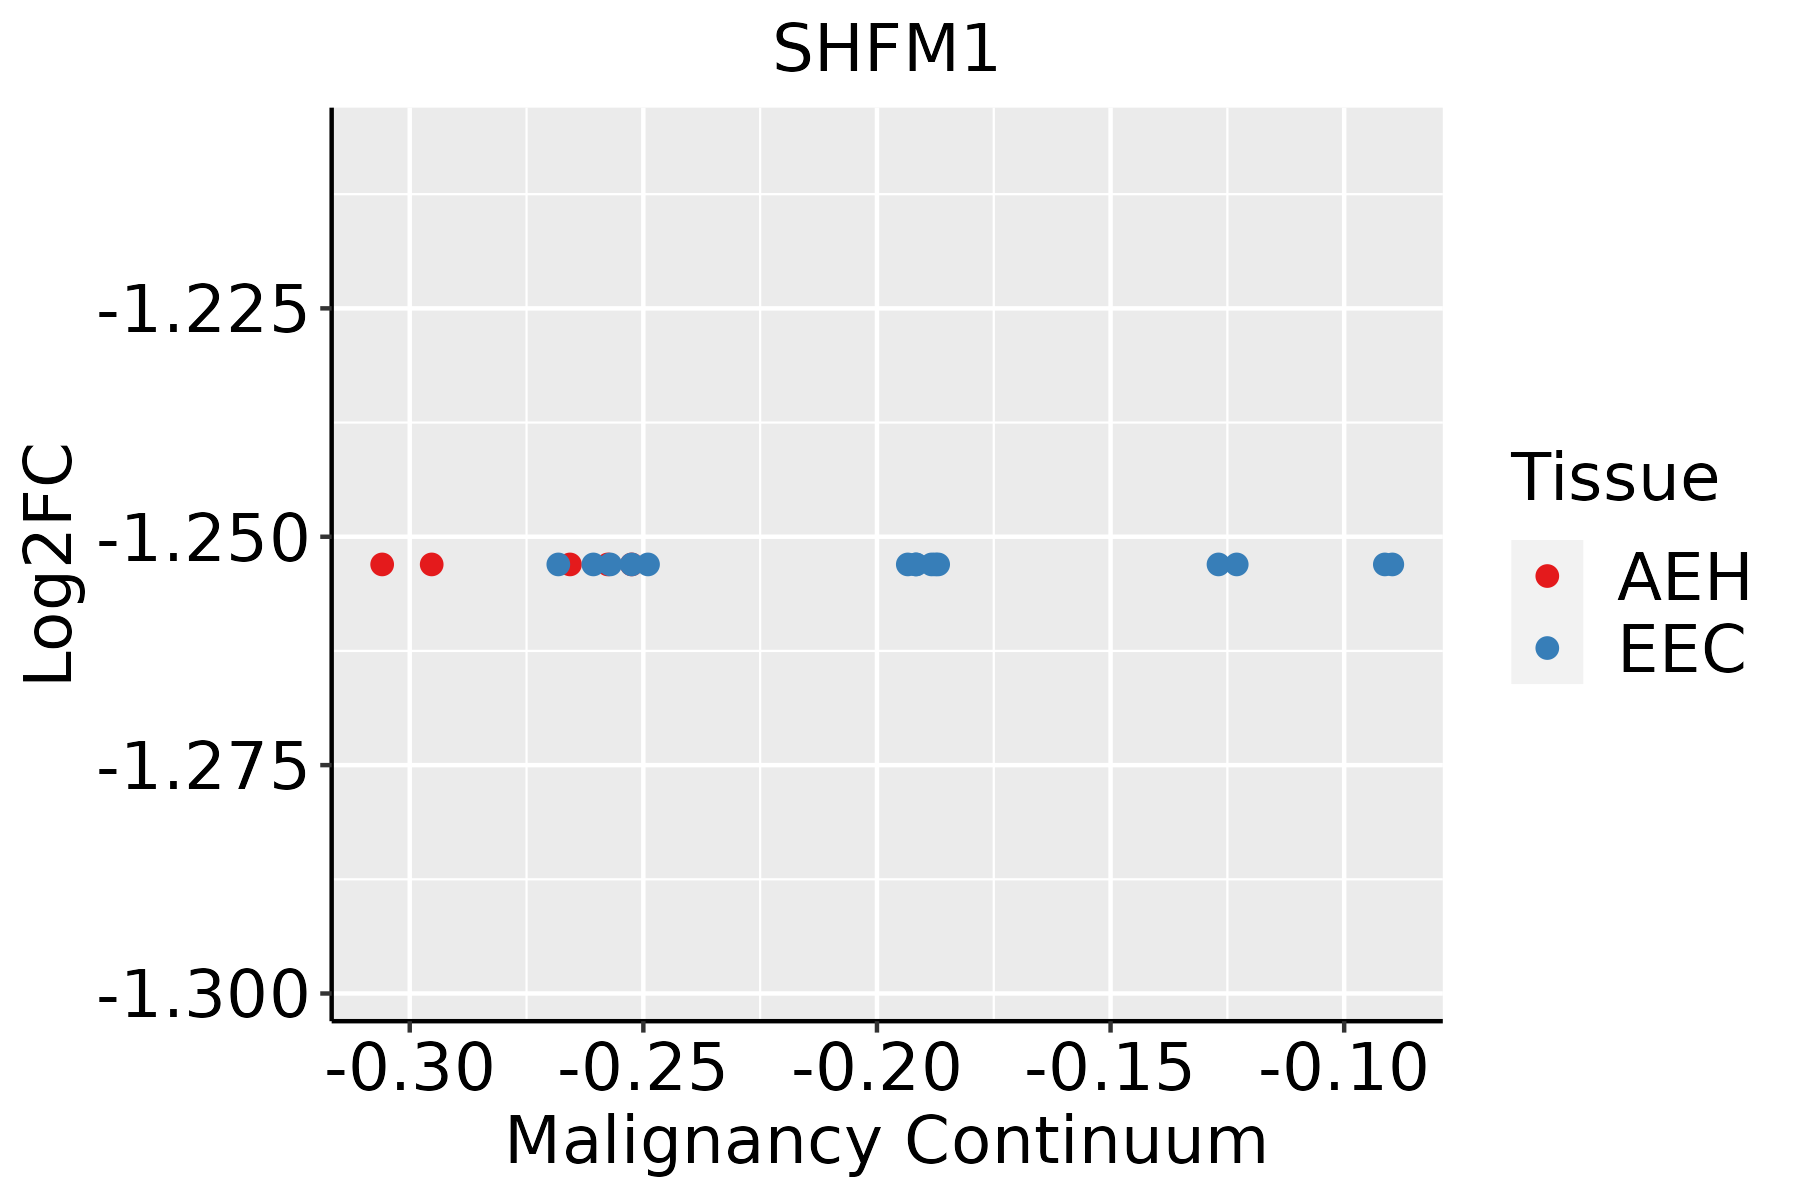 | AEH: Atypical endometrial hyperplasia |
| EEC: Endometrioid Cancer | ||
| Esophagus | 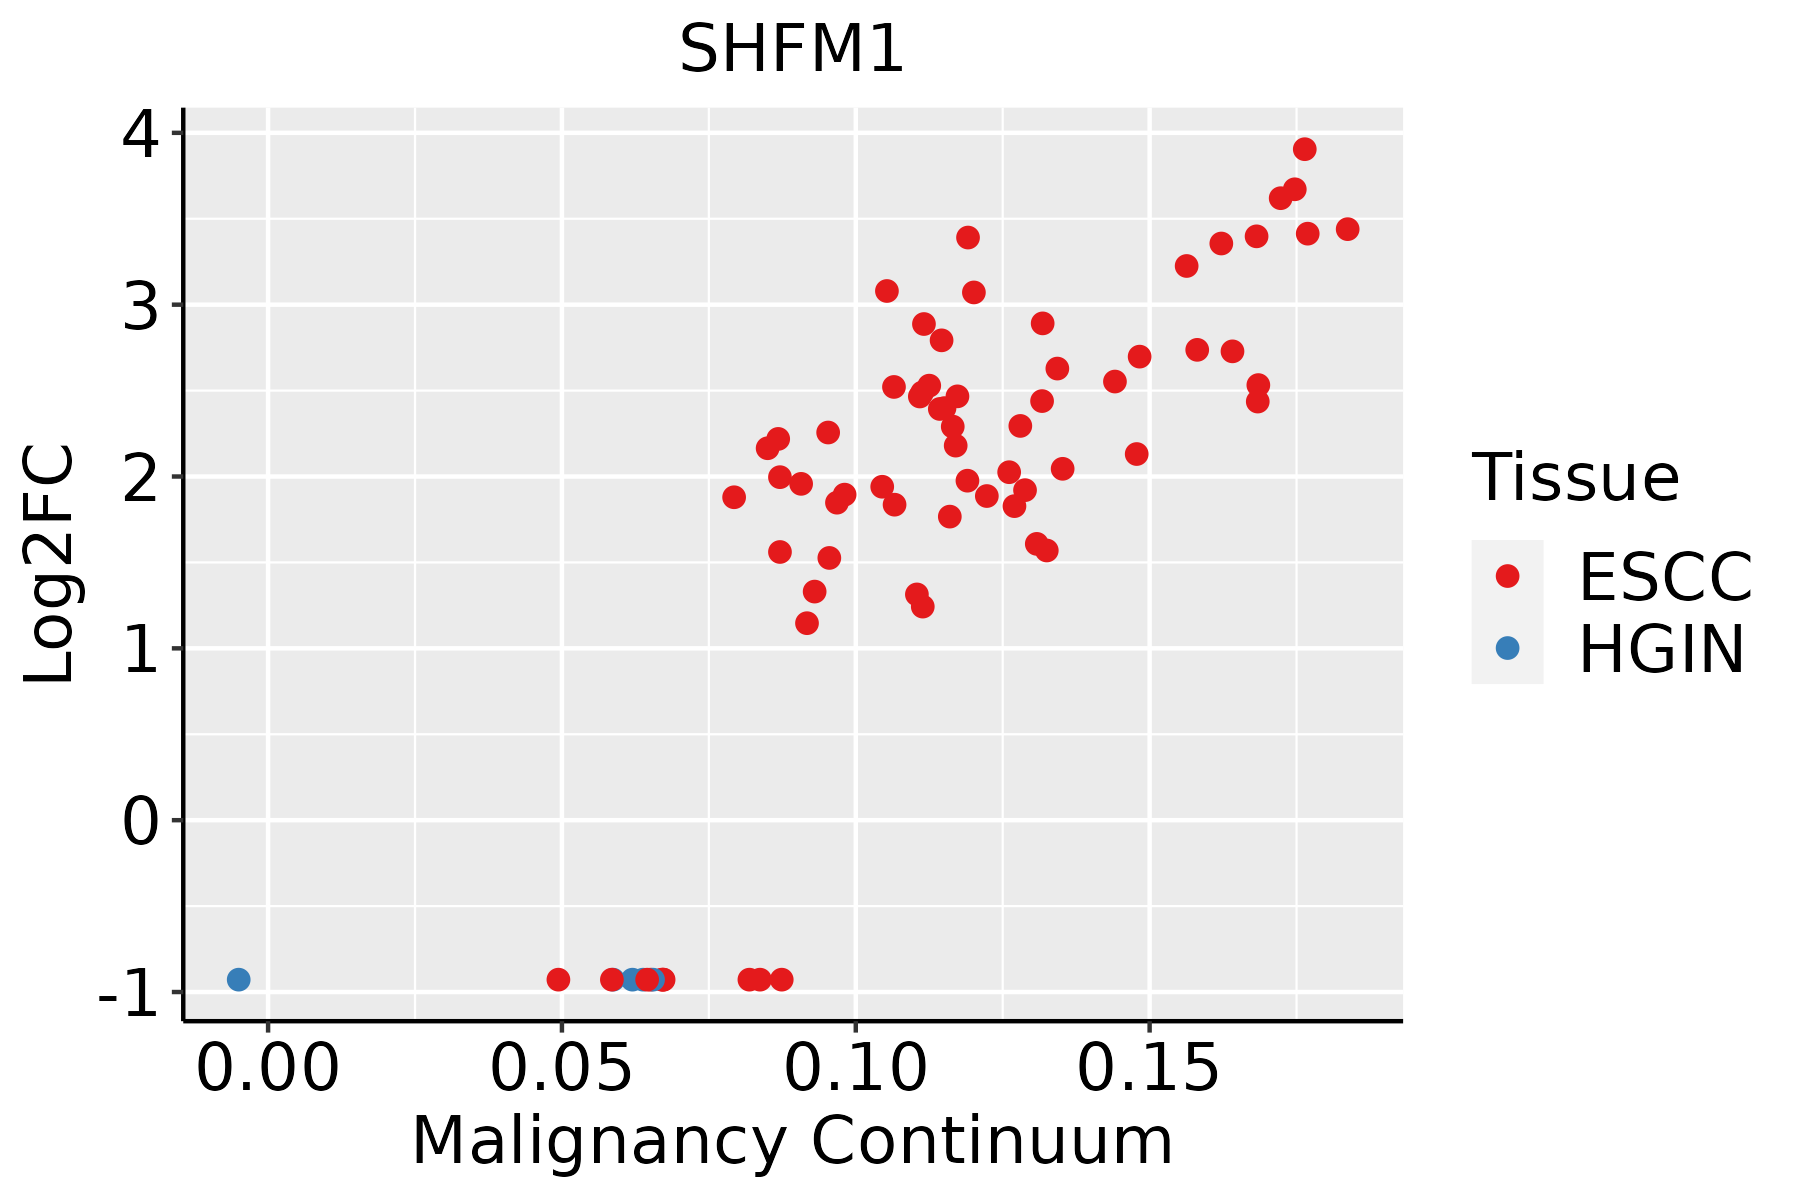 | ESCC: Esophageal squamous cell carcinoma |
| HGIN: High-grade intraepithelial neoplasias | ||
| LGIN: Low-grade intraepithelial neoplasias | ||
| GC | 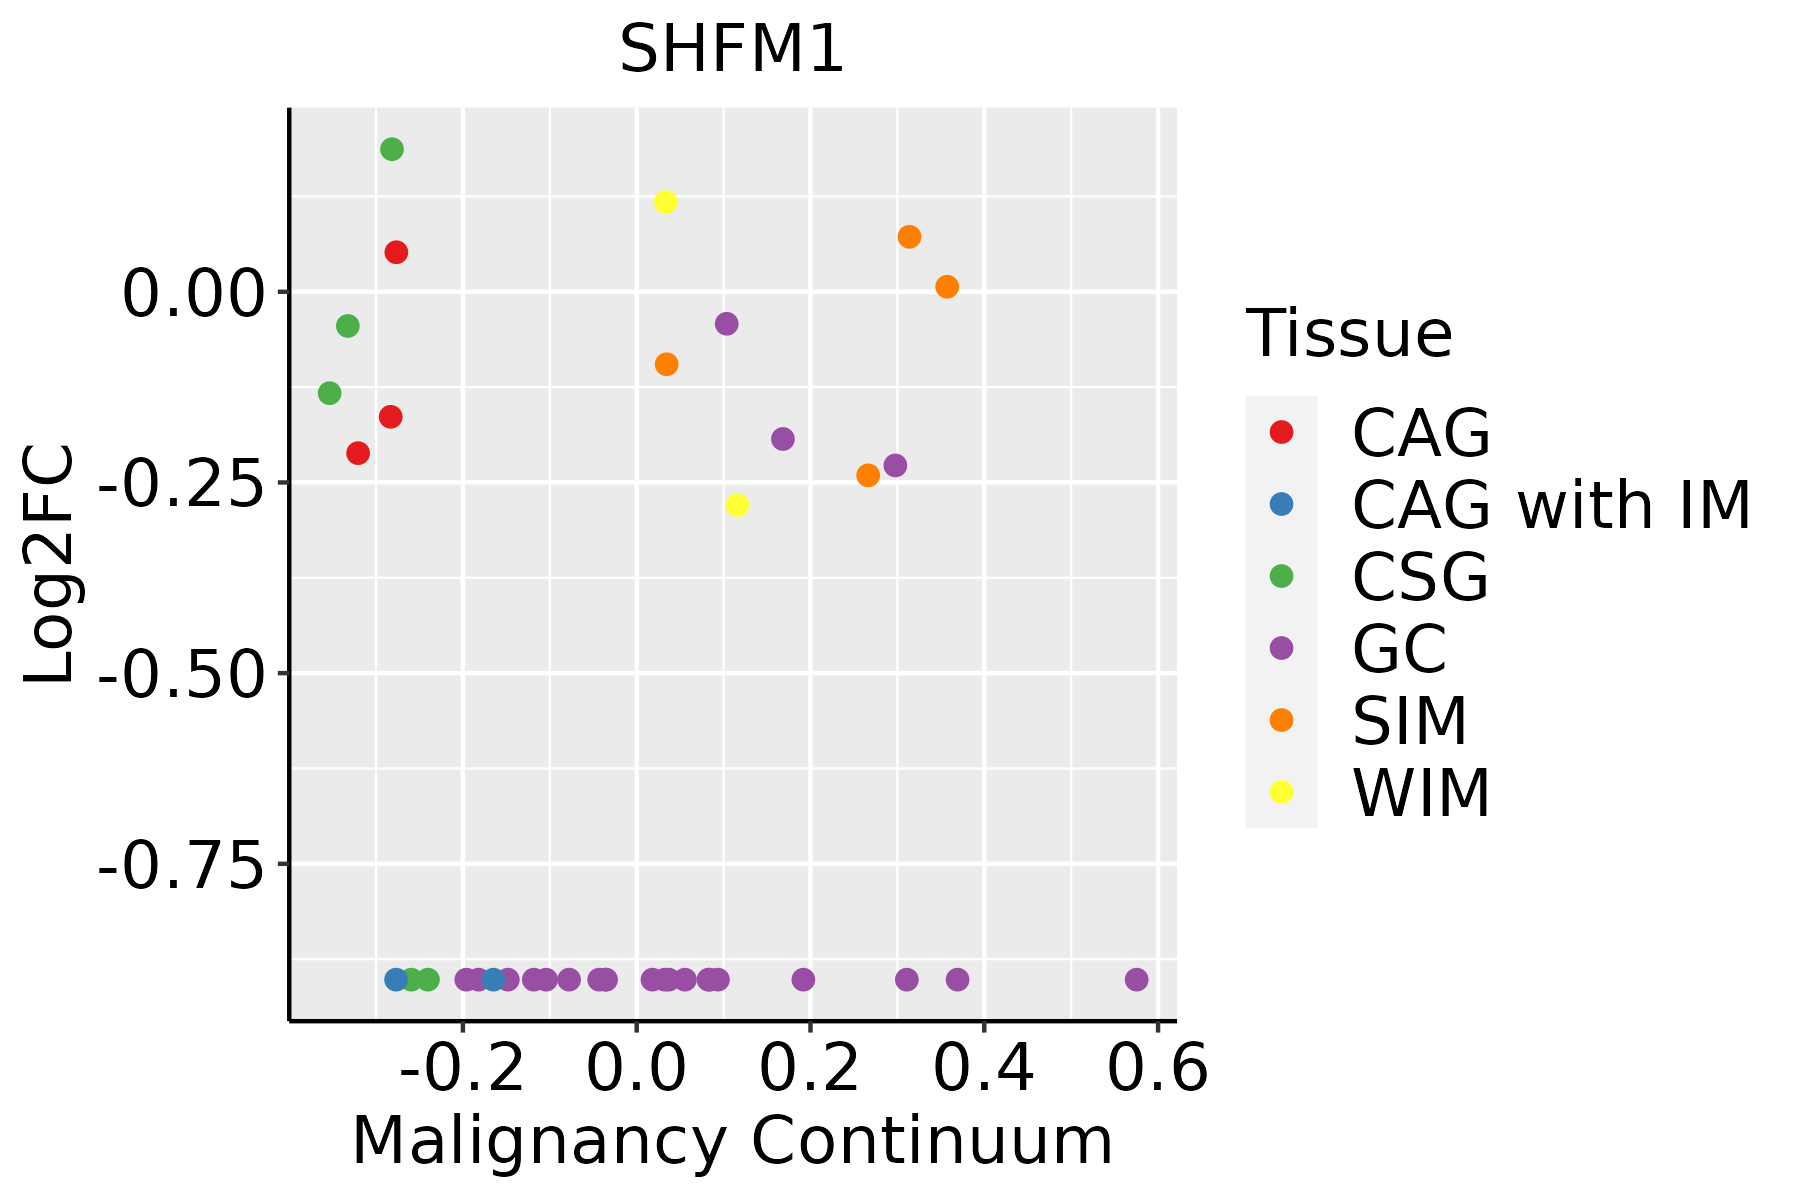 | CAG: Chronic atrophic gastritis |
| CAG with IM: Chronic atrophic gastritis with intestinal metaplasia | ||
| CSG: Chronic superficial gastritis | ||
| GC: Gastric cancer | ||
| SIM: Severe intestinal metaplasia | ||
| WIM: Wild intestinal metaplasia | ||
| Liver |  | HCC: Hepatocellular carcinoma |
| NAFLD: Non-alcoholic fatty liver disease | ||
| Lung | 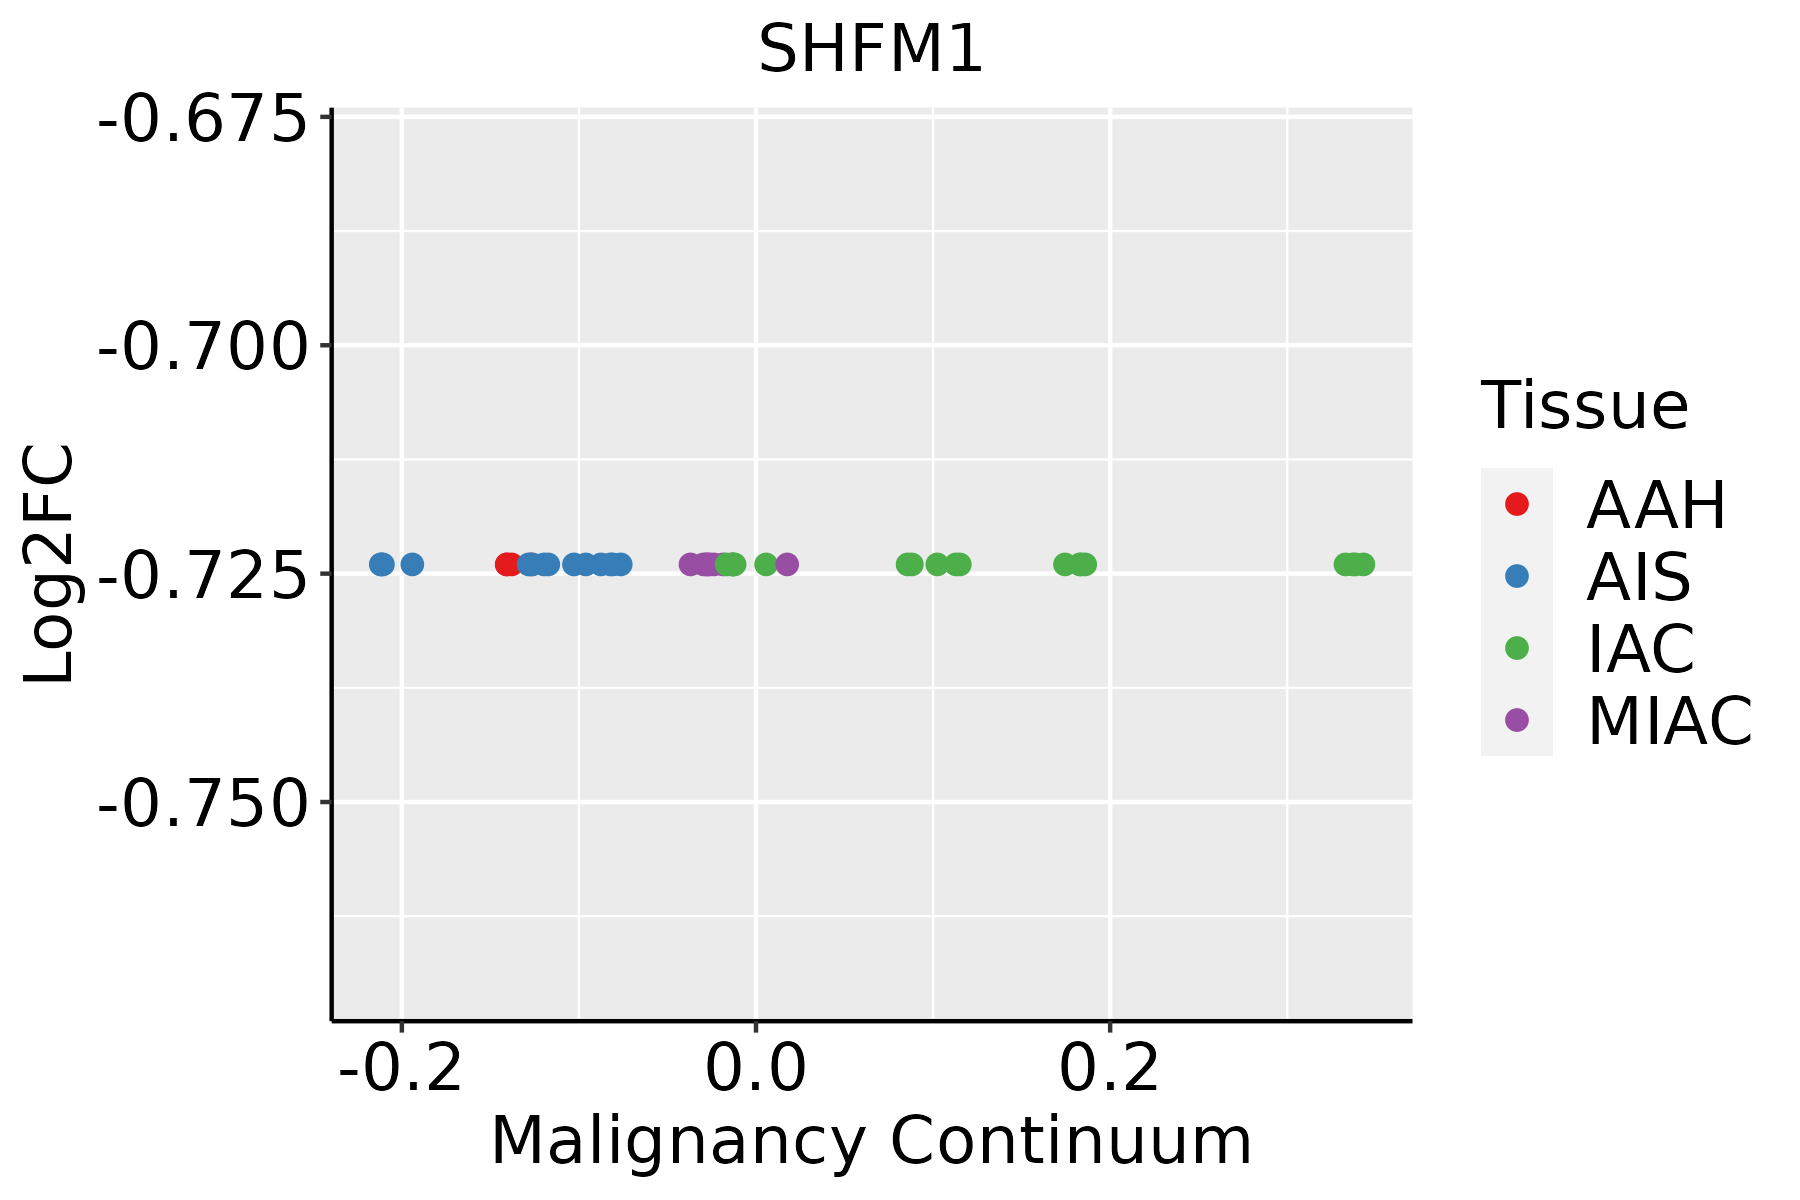 | AAH: Atypical adenomatous hyperplasia |
| AIS: Adenocarcinoma in situ | ||
| IAC: Invasive lung adenocarcinoma | ||
| MIA: Minimally invasive adenocarcinoma | ||
| Oral Cavity | 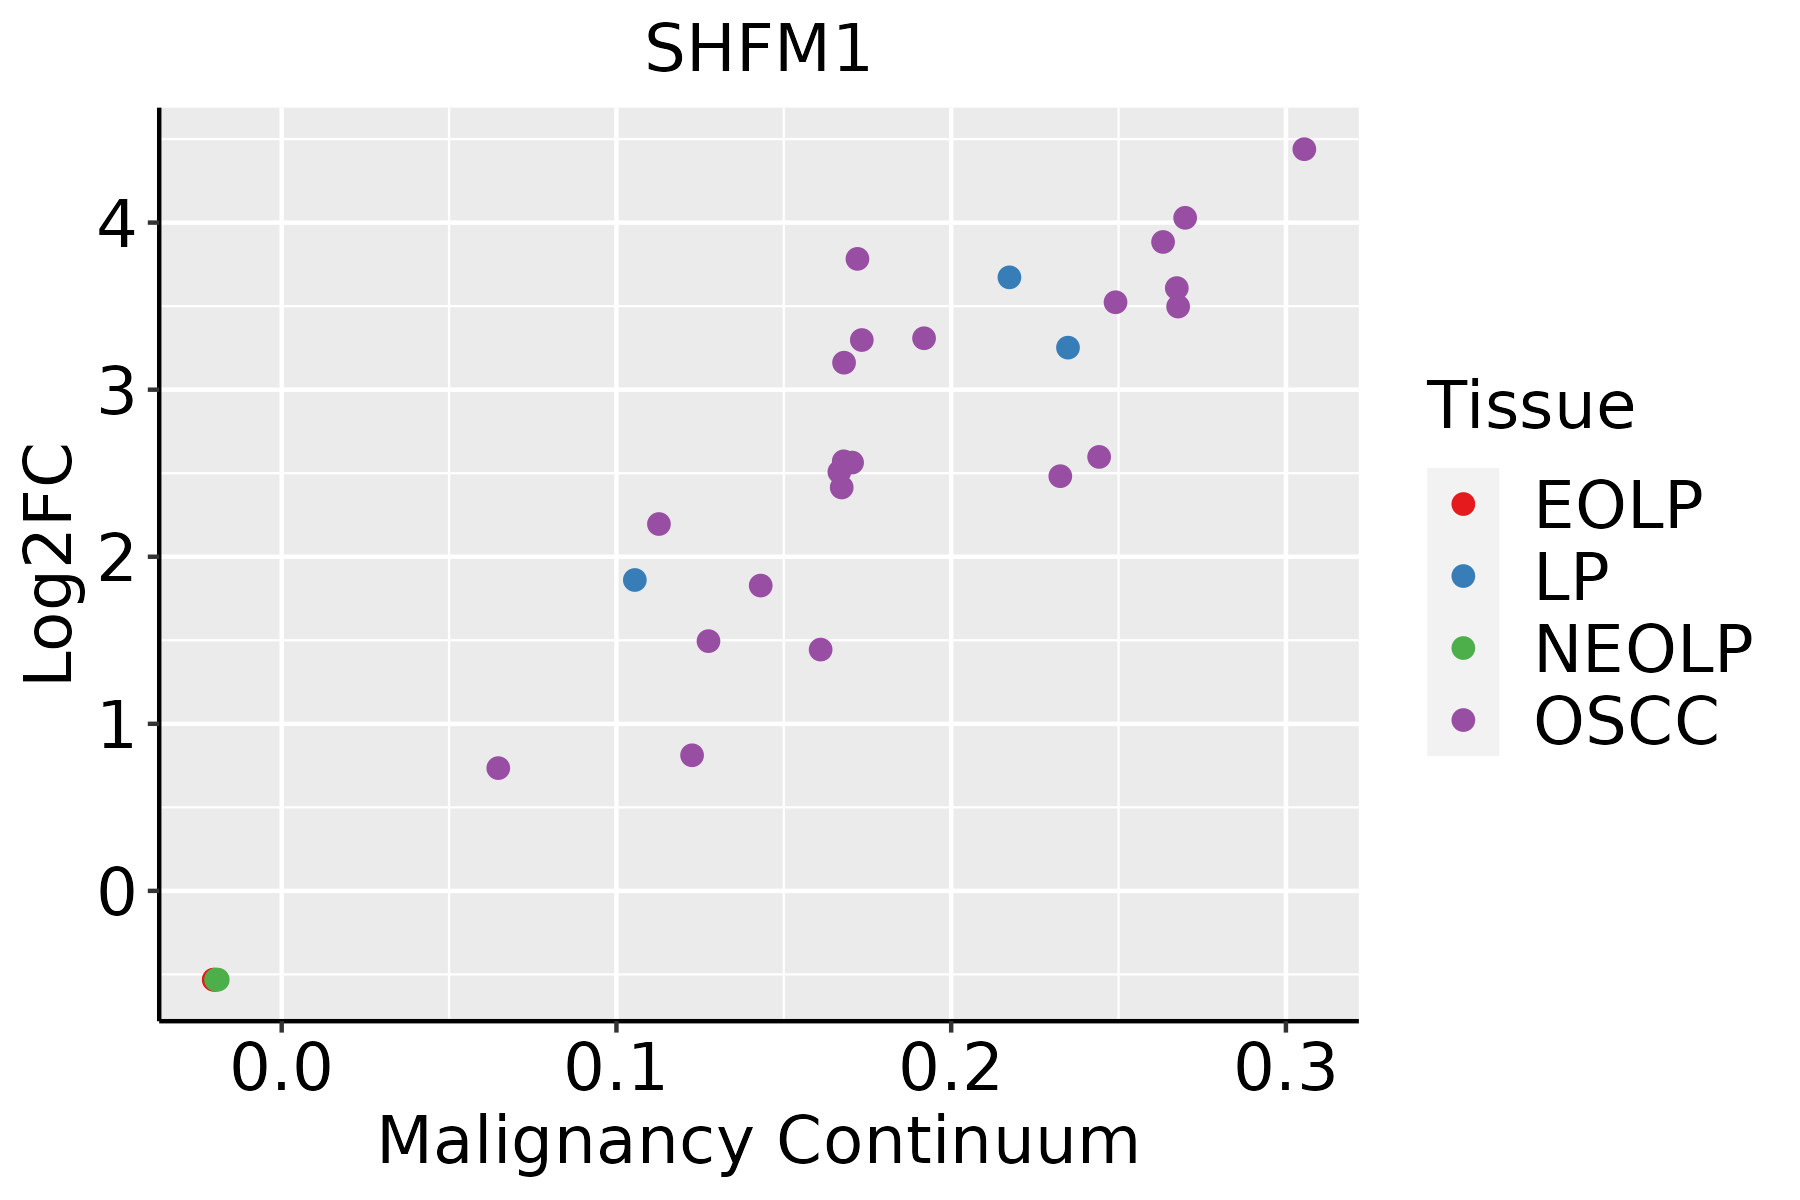 | EOLP: Erosive Oral lichen planus |
| LP: leukoplakia | ||
| NEOLP: Non-erosive oral lichen planus | ||
| OSCC: Oral squamous cell carcinoma | ||
| Prostate |  | BPH: Benign Prostatic Hyperplasia |
| Skin | 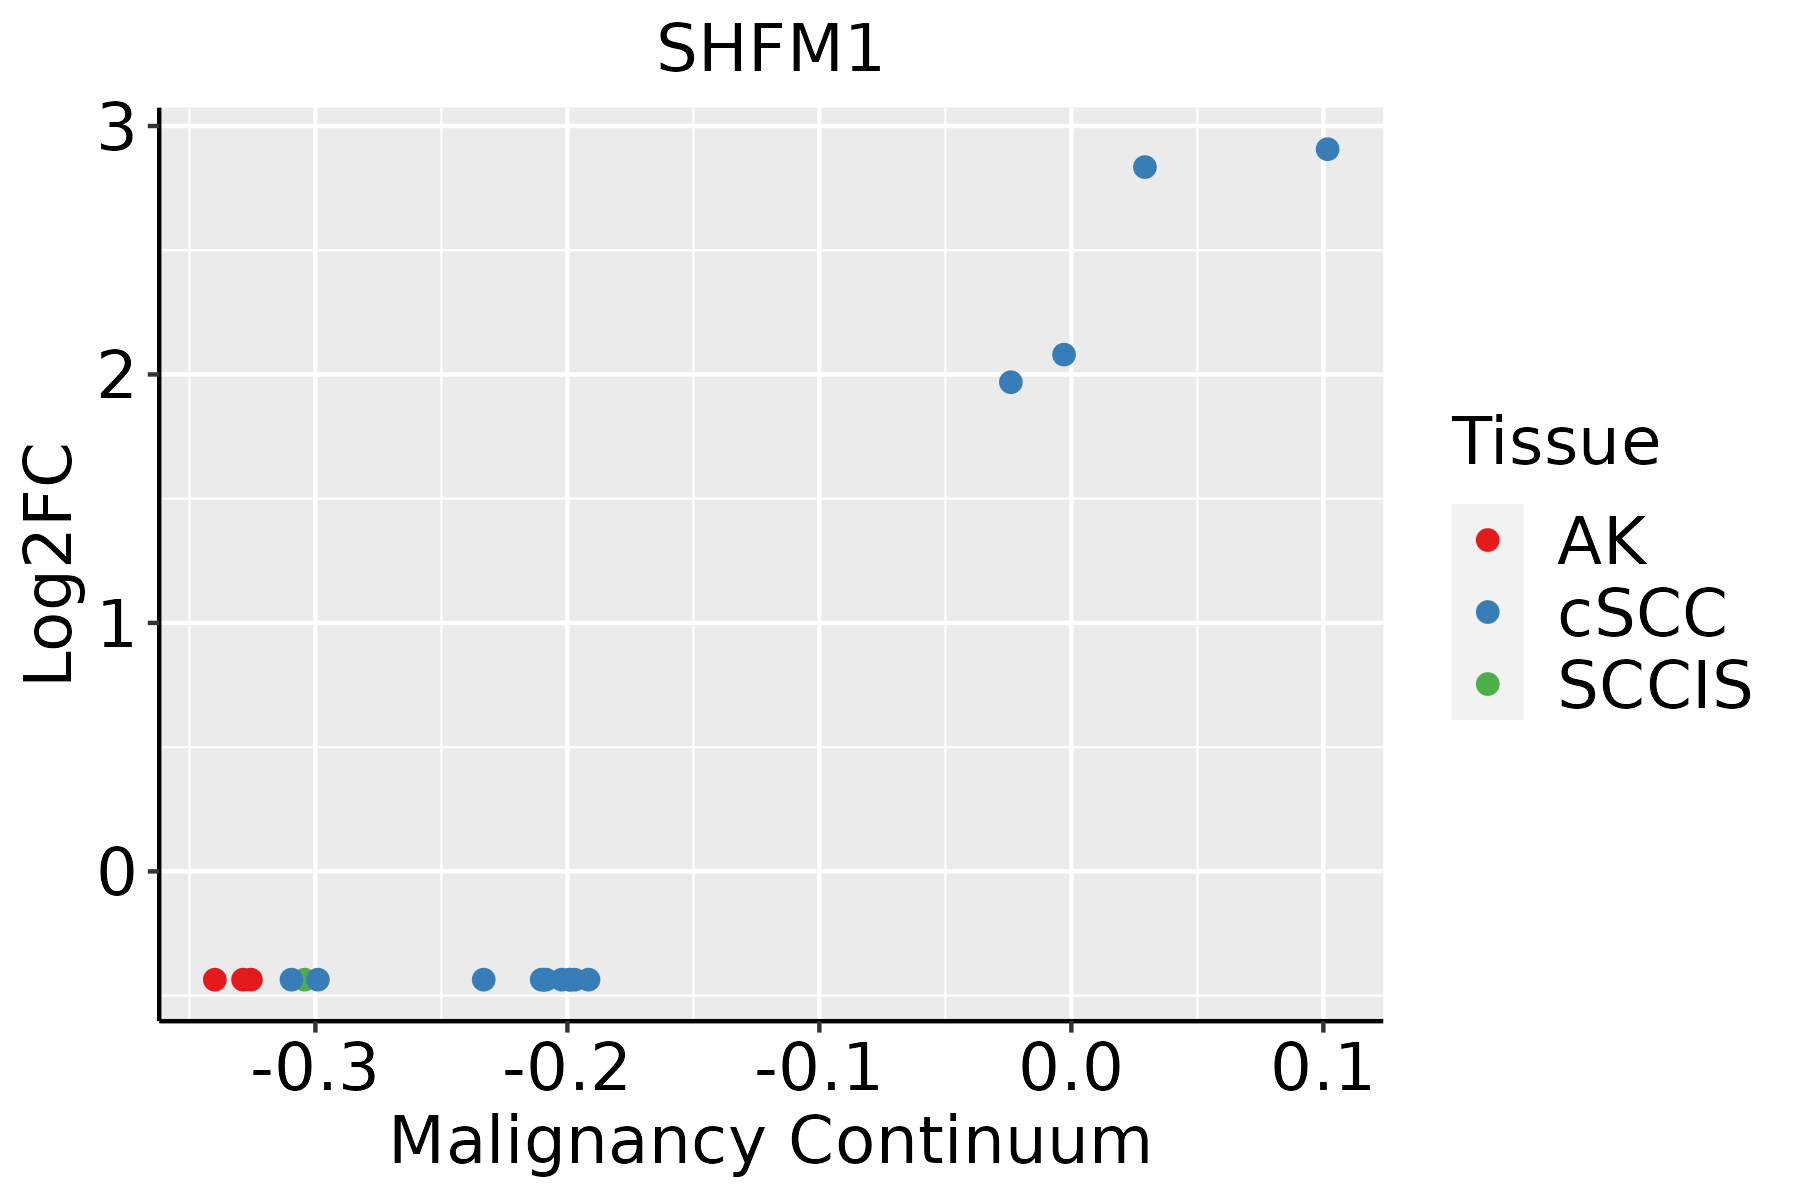 | AK: Actinic keratosis |
| cSCC: Cutaneous squamous cell carcinoma | ||
| SCCIS:squamous cell carcinoma in situ | ||
| Thyroid | 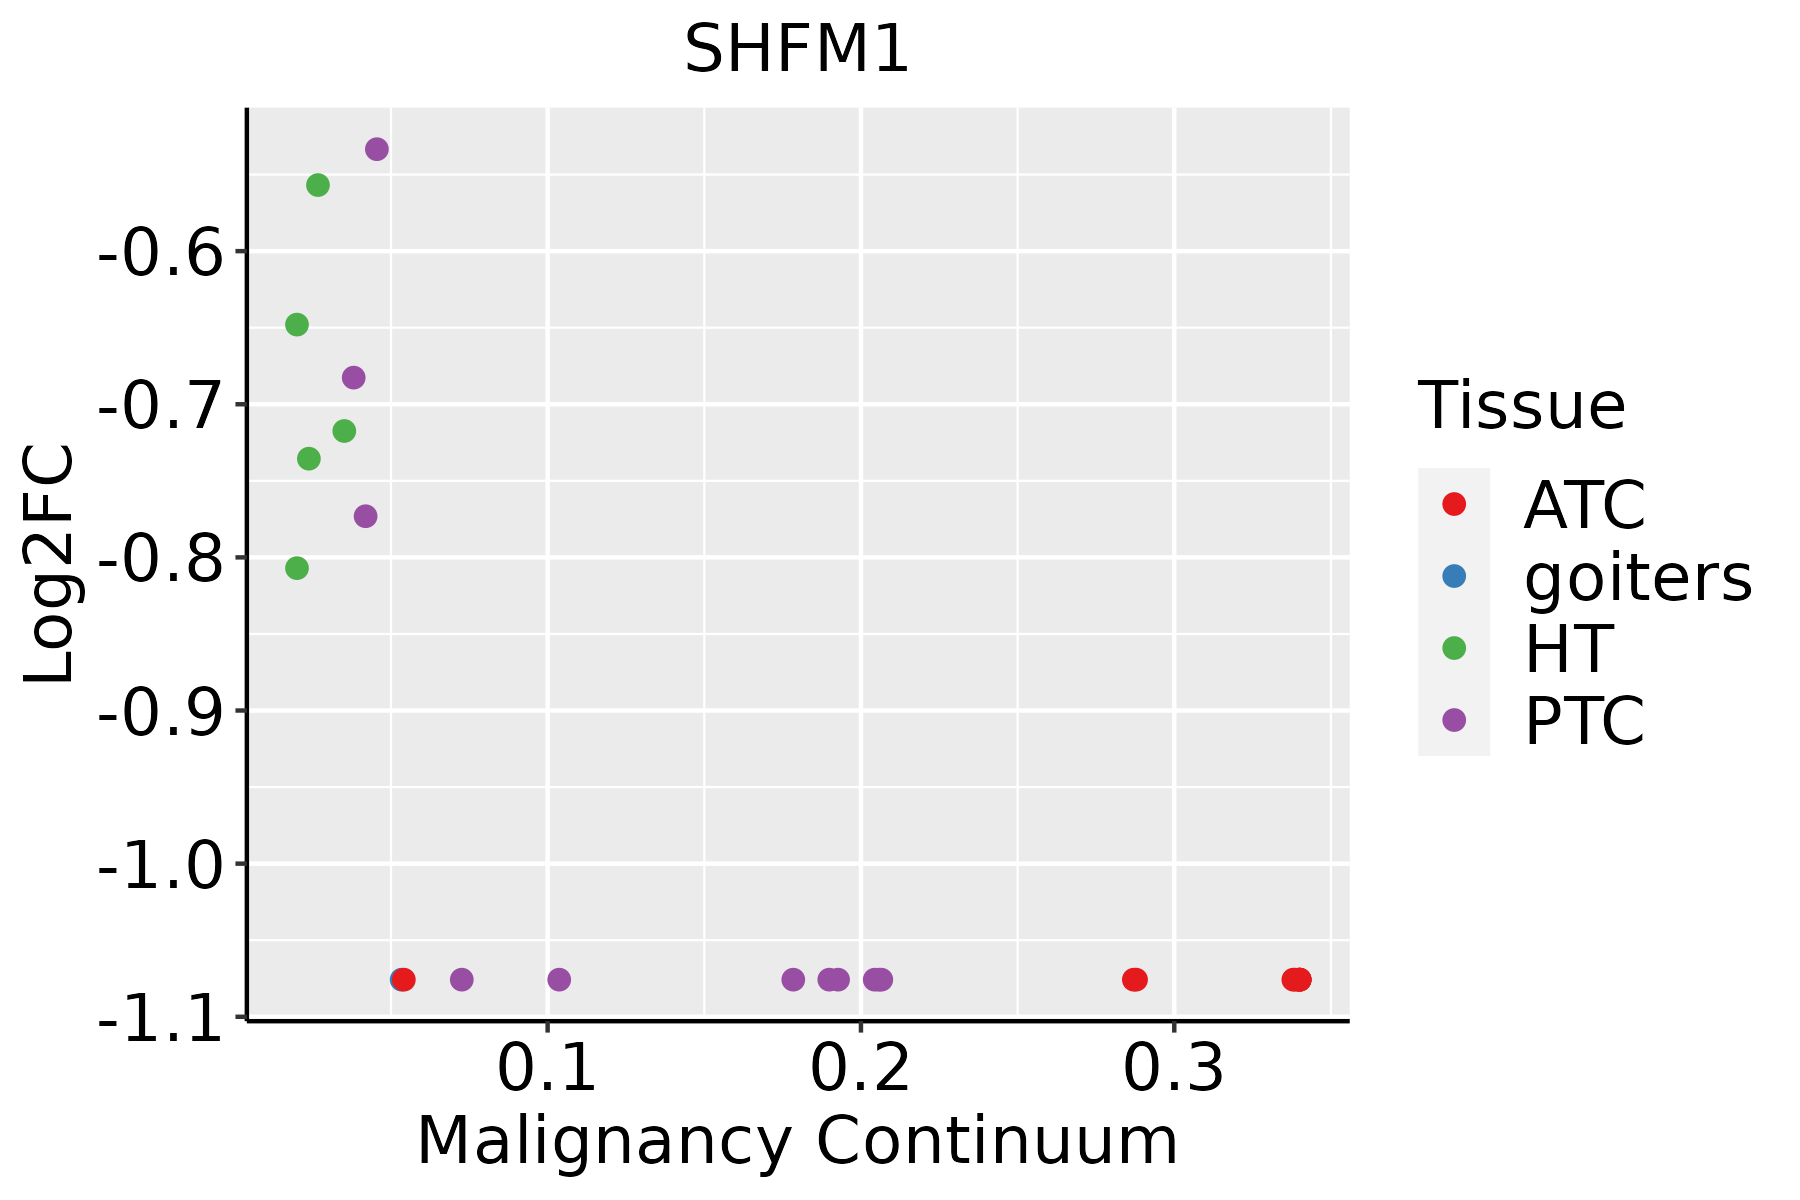 | ATC: Anaplastic thyroid cancer |
| HT: Hashimoto's thyroiditis | ||
| PTC: Papillary thyroid cancer |
| ∗log2FC in expression of this searched gene in stem-like cells from each diseased tissue sample relative to stem-like cells in normal samples in each tissue plotted against the malignancy continuum. Samples are colored based on if they are from different disease stage. |
Top |
Malignant transformation related pathway analysis |
| Find out the enriched GO biological processes and KEGG pathways involved in transition from healthy to precancer to cancer |
| Tissue | Disease Stage | Enriched GO biological Processes |
| Liver | Cyst |  |
| Lung | IAC |  |
| Lung | AIS |  |
| Lung | AAH |  |
| Lung | MIAC |  |
| ∗Top 15 enriched GO BP terms are showed in the bar plot of each disease state in each tissue. Each row represents a significant GO biological process which is colored according to the -log10(p.adjust). |
| Page: 1 2 3 4 5 6 7 8 9 |
| GO ID | Tissue | Disease Stage | Description | Gene Ratio | Bg Ratio | pvalue | p.adjust | Count |
| Page: 1 |
| Pathway ID | Tissue | Disease Stage | Description | Gene Ratio | Bg Ratio | pvalue | p.adjust | qvalue | Count |
| hsa0501218 | Breast | Precancer | Parkinson disease | 99/684 | 266/8465 | 3.58e-42 | 5.65e-40 | 4.33e-40 | 99 |
| hsa0502016 | Breast | Precancer | Prion disease | 95/684 | 273/8465 | 1.39e-37 | 1.46e-35 | 1.12e-35 | 95 |
| hsa0501616 | Breast | Precancer | Huntington disease | 98/684 | 306/8465 | 2.85e-35 | 2.25e-33 | 1.72e-33 | 98 |
| hsa0501016 | Breast | Precancer | Alzheimer disease | 103/684 | 384/8465 | 1.03e-29 | 4.66e-28 | 3.57e-28 | 103 |
| hsa0501416 | Breast | Precancer | Amyotrophic lateral sclerosis | 98/684 | 364/8465 | 2.13e-28 | 8.41e-27 | 6.44e-27 | 98 |
| hsa0502216 | Breast | Precancer | Pathways of neurodegeneration - multiple diseases | 112/684 | 476/8465 | 6.96e-27 | 2.44e-25 | 1.87e-25 | 112 |
| hsa0305010 | Breast | Precancer | Proteasome | 25/684 | 46/8465 | 4.35e-16 | 9.81e-15 | 7.52e-15 | 25 |
| hsa0501714 | Breast | Precancer | Spinocerebellar ataxia | 29/684 | 143/8465 | 2.79e-06 | 3.83e-05 | 2.94e-05 | 29 |
| hsa0516918 | Breast | Precancer | Epstein-Barr virus infection | 35/684 | 202/8465 | 1.15e-05 | 1.26e-04 | 9.64e-05 | 35 |
| hsa0501219 | Breast | Precancer | Parkinson disease | 99/684 | 266/8465 | 3.58e-42 | 5.65e-40 | 4.33e-40 | 99 |
| hsa0502017 | Breast | Precancer | Prion disease | 95/684 | 273/8465 | 1.39e-37 | 1.46e-35 | 1.12e-35 | 95 |
| hsa0501617 | Breast | Precancer | Huntington disease | 98/684 | 306/8465 | 2.85e-35 | 2.25e-33 | 1.72e-33 | 98 |
| hsa0501017 | Breast | Precancer | Alzheimer disease | 103/684 | 384/8465 | 1.03e-29 | 4.66e-28 | 3.57e-28 | 103 |
| hsa0501417 | Breast | Precancer | Amyotrophic lateral sclerosis | 98/684 | 364/8465 | 2.13e-28 | 8.41e-27 | 6.44e-27 | 98 |
| hsa0502217 | Breast | Precancer | Pathways of neurodegeneration - multiple diseases | 112/684 | 476/8465 | 6.96e-27 | 2.44e-25 | 1.87e-25 | 112 |
| hsa0305013 | Breast | Precancer | Proteasome | 25/684 | 46/8465 | 4.35e-16 | 9.81e-15 | 7.52e-15 | 25 |
| hsa0501715 | Breast | Precancer | Spinocerebellar ataxia | 29/684 | 143/8465 | 2.79e-06 | 3.83e-05 | 2.94e-05 | 29 |
| hsa0516919 | Breast | Precancer | Epstein-Barr virus infection | 35/684 | 202/8465 | 1.15e-05 | 1.26e-04 | 9.64e-05 | 35 |
| hsa0501224 | Breast | IDC | Parkinson disease | 107/867 | 266/8465 | 2.57e-39 | 8.36e-37 | 6.26e-37 | 107 |
| hsa0502023 | Breast | IDC | Prion disease | 102/867 | 273/8465 | 3.70e-34 | 4.01e-32 | 3.00e-32 | 102 |
| Page: 1 2 3 4 5 6 7 8 9 10 11 12 13 14 15 16 |
Top |
Cell-cell communication analysis |
| Identification of potential cell-cell interactions between two cell types and their ligand-receptor pairs for different disease states |
| Ligand | Receptor | LRpair | Pathway | Tissue | Disease Stage |
| Page: 1 |
Top |
Single-cell gene regulatory network inference analysis |
| Find out the significant the regulons (TFs) and the target genes of each regulon across cell types for different disease states |
| TF | Cell Type | Tissue | Disease Stage | Target Gene | RSS | Regulon Activity |
| ∗The dot plots of a searched regulon are shown for all cell subpopulations in each disease state of each tissue based on the regulon specific score inferred using pySCENIC and by calculating the average expression. |
| Page: 1 |
Top |
Somatic mutation of malignant transformation related genes |
| Annotation of somatic variants for genes involved in malignant transformation |
| Hugo Symbol | Variant Class | Variant Classification | dbSNP RS | HGVSc | HGVSp | HGVSp Short | SWISSPROT | BIOTYPE | SIFT | PolyPhen | Tumor Sample Barcode | Tissue | Histology | Sex | Age | Stage | Therapy Types | Drugs | Outcome |
| Page: 1 |
Top |
Related drugs of malignant transformation related genes |
| Identification of chemicals and drugs interact with genes involved in malignant transfromation |
| (DGIdb 4.0) |
| Entrez ID | Symbol | Category | Interaction Types | Drug Claim Name | Drug Name | PMIDs |
| Page: 1 |

Copyright 2023-Present -The University of Texas Health Science Center at Houston |