
|
|||||
|
 | |
| |
| |
| |
| |
| |
|
Gene: PIGBOS1 |
Gene summary for PIGBOS1 |
| Gene information | Species | Human | Gene symbol | PIGBOS1 | Gene ID | 101928527 |
| Gene name | PIGB opposite strand 1 | |
| Gene Alias | HP06981 | |
| Cytomap | 15q21.3 | |
| Gene Type | protein-coding | GO ID | GO:0006950 | UniProtAcc | A0A0B4J2F0 |
Top |
Malignant transformation analysis |
| Identification of the aberrant gene expression in precancerous and cancerous lesions by comparing the gene expression of stem-like cells in diseased tissues with normal stem cells |
| Entrez ID | Symbol | Replicates | Species | Organ | Tissue | Adj P-value | Log2FC | Malignancy |
| 101928527 | PIGBOS1 | LZE2T | Human | Esophagus | ESCC | 1.75e-02 | 3.67e-01 | 0.082 |
| 101928527 | PIGBOS1 | LZE4T | Human | Esophagus | ESCC | 1.47e-07 | 2.23e-01 | 0.0811 |
| 101928527 | PIGBOS1 | LZE5T | Human | Esophagus | ESCC | 2.15e-03 | 2.88e-01 | 0.0514 |
| 101928527 | PIGBOS1 | LZE7T | Human | Esophagus | ESCC | 1.36e-02 | 1.84e-01 | 0.0667 |
| 101928527 | PIGBOS1 | LZE8T | Human | Esophagus | ESCC | 6.20e-06 | 2.07e-01 | 0.067 |
| 101928527 | PIGBOS1 | LZE24T | Human | Esophagus | ESCC | 2.44e-09 | 1.78e-01 | 0.0596 |
| 101928527 | PIGBOS1 | LZE6T | Human | Esophagus | ESCC | 2.82e-05 | 2.18e-01 | 0.0845 |
| 101928527 | PIGBOS1 | P1T-E | Human | Esophagus | ESCC | 1.35e-12 | 5.52e-01 | 0.0875 |
| 101928527 | PIGBOS1 | P2T-E | Human | Esophagus | ESCC | 1.71e-18 | 2.60e-01 | 0.1177 |
| 101928527 | PIGBOS1 | P4T-E | Human | Esophagus | ESCC | 4.38e-23 | 4.86e-01 | 0.1323 |
| 101928527 | PIGBOS1 | P5T-E | Human | Esophagus | ESCC | 1.07e-13 | 2.28e-01 | 0.1327 |
| 101928527 | PIGBOS1 | P8T-E | Human | Esophagus | ESCC | 1.36e-23 | 3.46e-01 | 0.0889 |
| 101928527 | PIGBOS1 | P9T-E | Human | Esophagus | ESCC | 1.39e-25 | 5.98e-01 | 0.1131 |
| 101928527 | PIGBOS1 | P10T-E | Human | Esophagus | ESCC | 1.07e-29 | 4.90e-01 | 0.116 |
| 101928527 | PIGBOS1 | P11T-E | Human | Esophagus | ESCC | 6.89e-13 | 2.60e-01 | 0.1426 |
| 101928527 | PIGBOS1 | P12T-E | Human | Esophagus | ESCC | 4.78e-25 | 3.52e-01 | 0.1122 |
| 101928527 | PIGBOS1 | P15T-E | Human | Esophagus | ESCC | 4.50e-17 | 2.83e-01 | 0.1149 |
| 101928527 | PIGBOS1 | P16T-E | Human | Esophagus | ESCC | 2.63e-18 | 2.71e-01 | 0.1153 |
| 101928527 | PIGBOS1 | P17T-E | Human | Esophagus | ESCC | 4.47e-07 | 2.22e-01 | 0.1278 |
| 101928527 | PIGBOS1 | P19T-E | Human | Esophagus | ESCC | 2.44e-09 | 4.15e-01 | 0.1662 |
| Page: 1 2 3 4 5 |
| Tissue | Expression Dynamics | Abbreviation |
| Esophagus |  | ESCC: Esophageal squamous cell carcinoma |
| HGIN: High-grade intraepithelial neoplasias | ||
| LGIN: Low-grade intraepithelial neoplasias | ||
| Liver |  | HCC: Hepatocellular carcinoma |
| NAFLD: Non-alcoholic fatty liver disease | ||
| Oral Cavity | 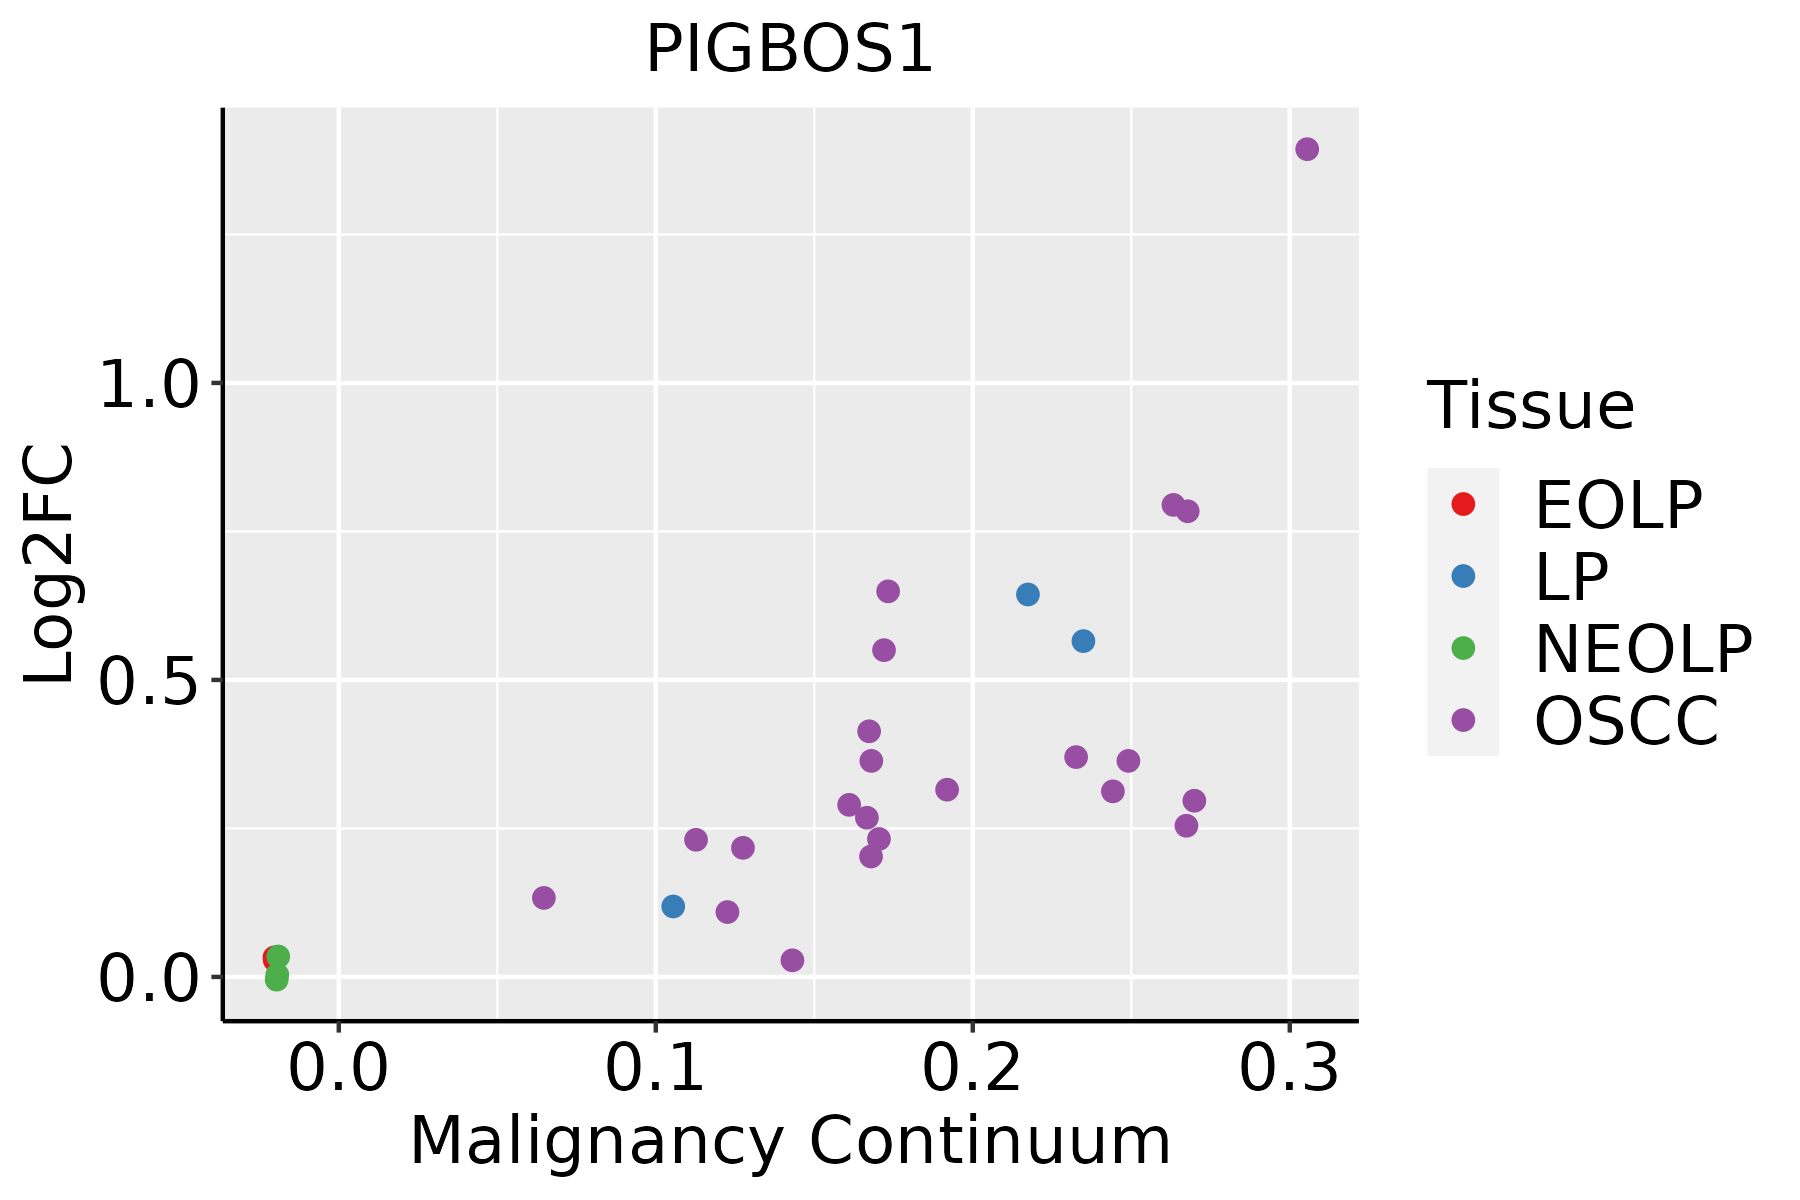 | EOLP: Erosive Oral lichen planus |
| LP: leukoplakia | ||
| NEOLP: Non-erosive oral lichen planus | ||
| OSCC: Oral squamous cell carcinoma |
| ∗log2FC in expression of this searched gene in stem-like cells from each diseased tissue sample relative to stem-like cells in normal samples in each tissue plotted against the malignancy continuum. Samples are colored based on if they are from different disease stage. |
Top |
Malignant transformation related pathway analysis |
| Find out the enriched GO biological processes and KEGG pathways involved in transition from healthy to precancer to cancer |
| Tissue | Disease Stage | Enriched GO biological Processes |
| Liver | Cyst |  |
| Lung | IAC |  |
| Lung | AIS |  |
| Lung | AAH |  |
| Lung | MIAC |  |
| ∗Top 15 enriched GO BP terms are showed in the bar plot of each disease state in each tissue. Each row represents a significant GO biological process which is colored according to the -log10(p.adjust). |
| Page: 1 2 3 4 5 6 7 8 9 |
| GO ID | Tissue | Disease Stage | Description | Gene Ratio | Bg Ratio | pvalue | p.adjust | Count |
| GO:0034976111 | Esophagus | ESCC | response to endoplasmic reticulum stress | 192/8552 | 256/18723 | 7.15e-22 | 1.30e-19 | 192 |
| GO:0035966111 | Esophagus | ESCC | response to topologically incorrect protein | 125/8552 | 159/18723 | 1.44e-17 | 1.27e-15 | 125 |
| GO:0006986111 | Esophagus | ESCC | response to unfolded protein | 107/8552 | 137/18723 | 7.01e-15 | 3.87e-13 | 107 |
| GO:0035967111 | Esophagus | ESCC | cellular response to topologically incorrect protein | 90/8552 | 116/18723 | 1.94e-12 | 8.11e-11 | 90 |
| GO:0034620111 | Esophagus | ESCC | cellular response to unfolded protein | 74/8552 | 96/18723 | 3.10e-10 | 8.66e-09 | 74 |
| GO:003096818 | Esophagus | ESCC | endoplasmic reticulum unfolded protein response | 59/8552 | 74/18723 | 1.90e-09 | 4.36e-08 | 59 |
| GO:1905897111 | Esophagus | ESCC | regulation of response to endoplasmic reticulum stress | 63/8552 | 82/18723 | 8.16e-09 | 1.66e-07 | 63 |
| GO:190010110 | Esophagus | ESCC | regulation of endoplasmic reticulum unfolded protein response | 24/8552 | 30/18723 | 1.27e-04 | 8.67e-04 | 24 |
| GO:00349767 | Liver | Cirrhotic | response to endoplasmic reticulum stress | 130/4634 | 256/18723 | 1.72e-19 | 3.86e-17 | 130 |
| GO:00359667 | Liver | Cirrhotic | response to topologically incorrect protein | 91/4634 | 159/18723 | 2.07e-18 | 3.60e-16 | 91 |
| GO:00069867 | Liver | Cirrhotic | response to unfolded protein | 79/4634 | 137/18723 | 1.99e-16 | 2.49e-14 | 79 |
| GO:00359677 | Liver | Cirrhotic | cellular response to topologically incorrect protein | 64/4634 | 116/18723 | 2.20e-12 | 1.62e-10 | 64 |
| GO:00346207 | Liver | Cirrhotic | cellular response to unfolded protein | 54/4634 | 96/18723 | 4.16e-11 | 2.42e-09 | 54 |
| GO:00309686 | Liver | Cirrhotic | endoplasmic reticulum unfolded protein response | 43/4634 | 74/18723 | 9.86e-10 | 4.48e-08 | 43 |
| GO:19058977 | Liver | Cirrhotic | regulation of response to endoplasmic reticulum stress | 46/4634 | 82/18723 | 1.28e-09 | 5.56e-08 | 46 |
| GO:19001015 | Liver | Cirrhotic | regulation of endoplasmic reticulum unfolded protein response | 19/4634 | 30/18723 | 8.57e-06 | 1.27e-04 | 19 |
| GO:003497612 | Liver | HCC | response to endoplasmic reticulum stress | 189/7958 | 256/18723 | 1.43e-24 | 4.06e-22 | 189 |
| GO:003596612 | Liver | HCC | response to topologically incorrect protein | 123/7958 | 159/18723 | 2.60e-19 | 3.44e-17 | 123 |
| GO:000698612 | Liver | HCC | response to unfolded protein | 103/7958 | 137/18723 | 6.50e-15 | 4.48e-13 | 103 |
| GO:003596712 | Liver | HCC | cellular response to topologically incorrect protein | 89/7958 | 116/18723 | 5.61e-14 | 3.39e-12 | 89 |
| Page: 1 2 |
| Pathway ID | Tissue | Disease Stage | Description | Gene Ratio | Bg Ratio | pvalue | p.adjust | qvalue | Count |
| Page: 1 |
Top |
Cell-cell communication analysis |
| Identification of potential cell-cell interactions between two cell types and their ligand-receptor pairs for different disease states |
| Ligand | Receptor | LRpair | Pathway | Tissue | Disease Stage |
| Page: 1 |
Top |
Single-cell gene regulatory network inference analysis |
| Find out the significant the regulons (TFs) and the target genes of each regulon across cell types for different disease states |
| TF | Cell Type | Tissue | Disease Stage | Target Gene | RSS | Regulon Activity |
| ∗The dot plots of a searched regulon are shown for all cell subpopulations in each disease state of each tissue based on the regulon specific score inferred using pySCENIC and by calculating the average expression. |
| Page: 1 |
Top |
Somatic mutation of malignant transformation related genes |
| Annotation of somatic variants for genes involved in malignant transformation |
| Hugo Symbol | Variant Class | Variant Classification | dbSNP RS | HGVSc | HGVSp | HGVSp Short | SWISSPROT | BIOTYPE | SIFT | PolyPhen | Tumor Sample Barcode | Tissue | Histology | Sex | Age | Stage | Therapy Types | Drugs | Outcome |
| Page: 1 |
Top |
Related drugs of malignant transformation related genes |
| Identification of chemicals and drugs interact with genes involved in malignant transfromation |
| (DGIdb 4.0) |
| Entrez ID | Symbol | Category | Interaction Types | Drug Claim Name | Drug Name | PMIDs |
| Page: 1 |

Copyright 2023-Present -The University of Texas Health Science Center at Houston |