| Tissue | Expression Dynamics | Abbreviation |
| Colorectum (GSE201348) |  | FAP: Familial adenomatous polyposis |
| CRC: Colorectal cancer |
| Colorectum (HTA11) |  | AD: Adenomas |
| SER: Sessile serrated lesions |
| MSI-H: Microsatellite-high colorectal cancer |
| MSS: Microsatellite stable colorectal cancer |
| Endometrium | 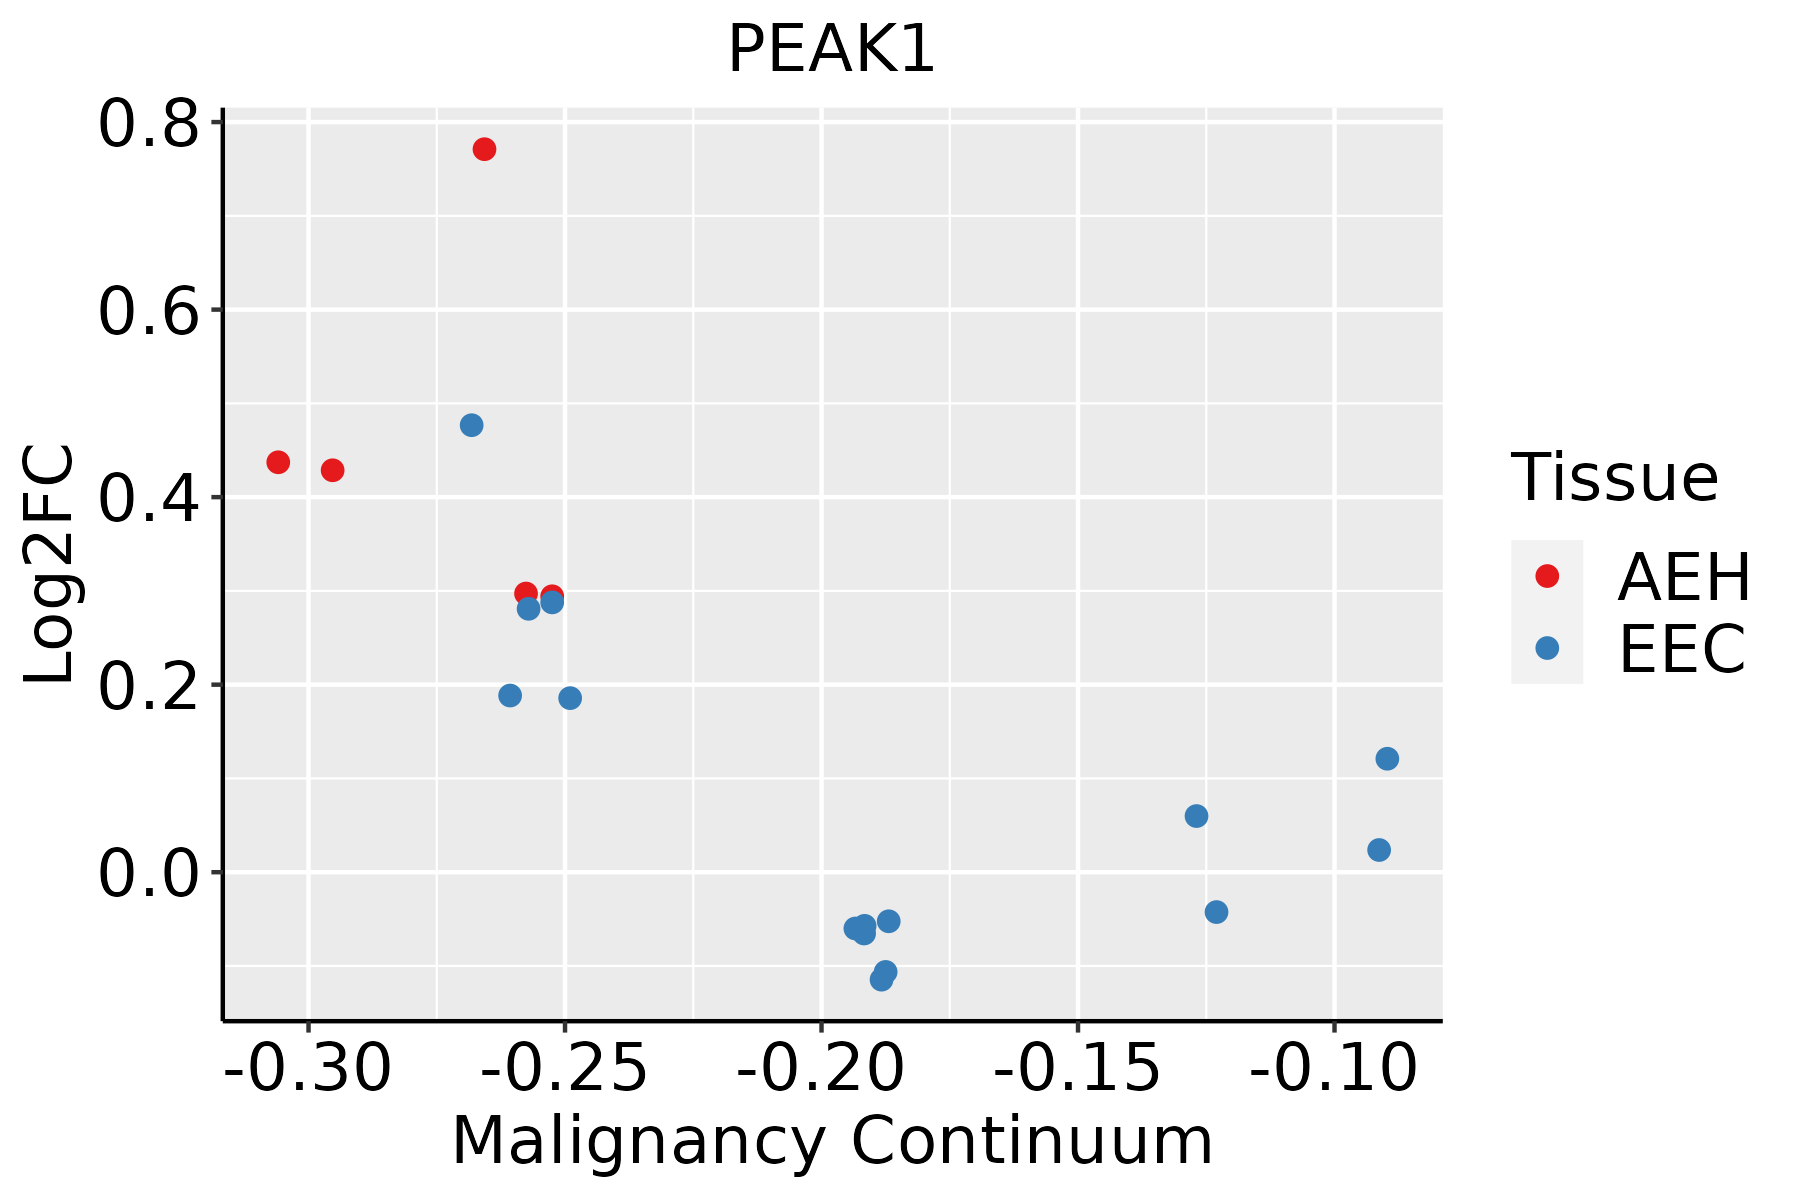 | AEH: Atypical endometrial hyperplasia |
| EEC: Endometrioid Cancer |
| GC | 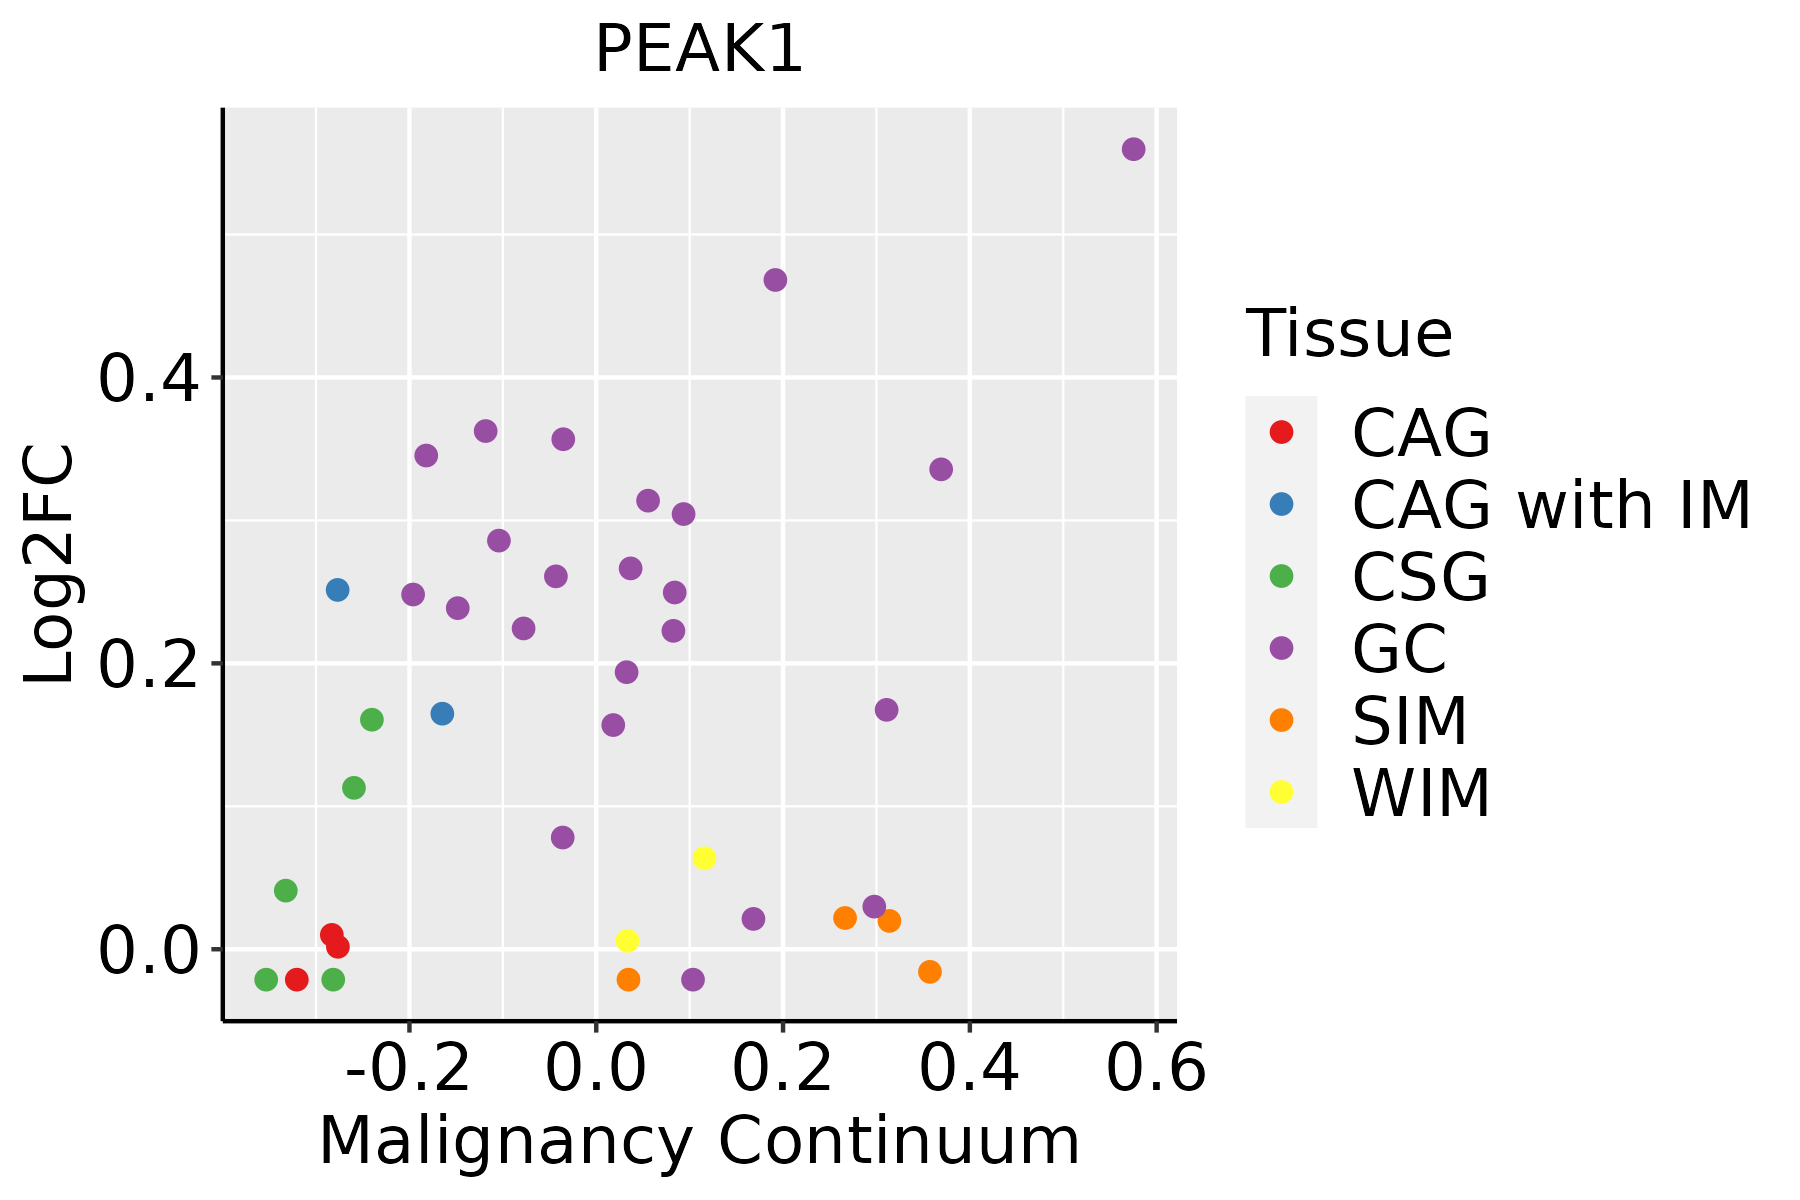 | CAG: Chronic atrophic gastritis |
| CAG with IM: Chronic atrophic gastritis with intestinal metaplasia |
| CSG: Chronic superficial gastritis |
| GC: Gastric cancer |
| SIM: Severe intestinal metaplasia |
| WIM: Wild intestinal metaplasia |
| Liver |  | HCC: Hepatocellular carcinoma |
| NAFLD: Non-alcoholic fatty liver disease |
| Lung |  | AAH: Atypical adenomatous hyperplasia |
| AIS: Adenocarcinoma in situ |
| IAC: Invasive lung adenocarcinoma |
| MIA: Minimally invasive adenocarcinoma |
| Oral Cavity | 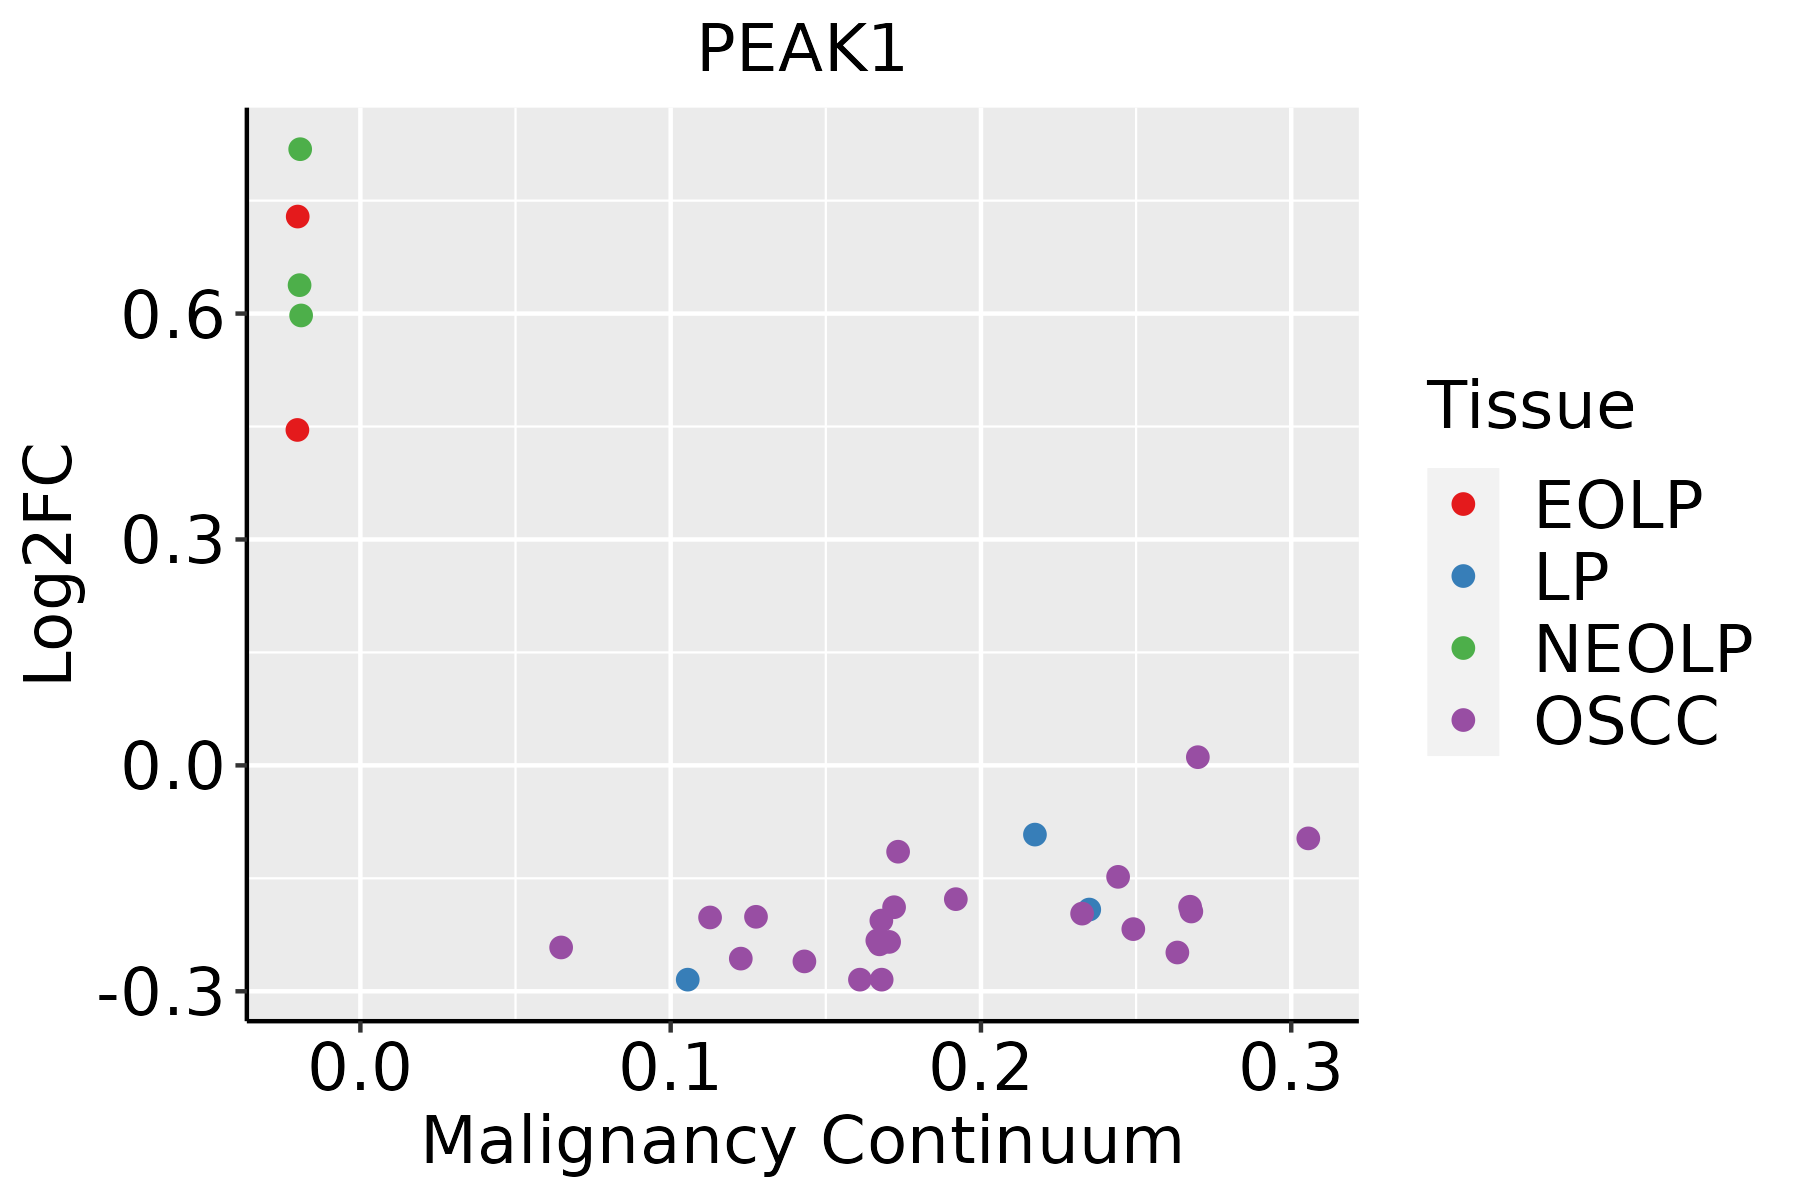 | EOLP: Erosive Oral lichen planus |
| LP: leukoplakia |
| NEOLP: Non-erosive oral lichen planus |
| OSCC: Oral squamous cell carcinoma |
| Prostate | 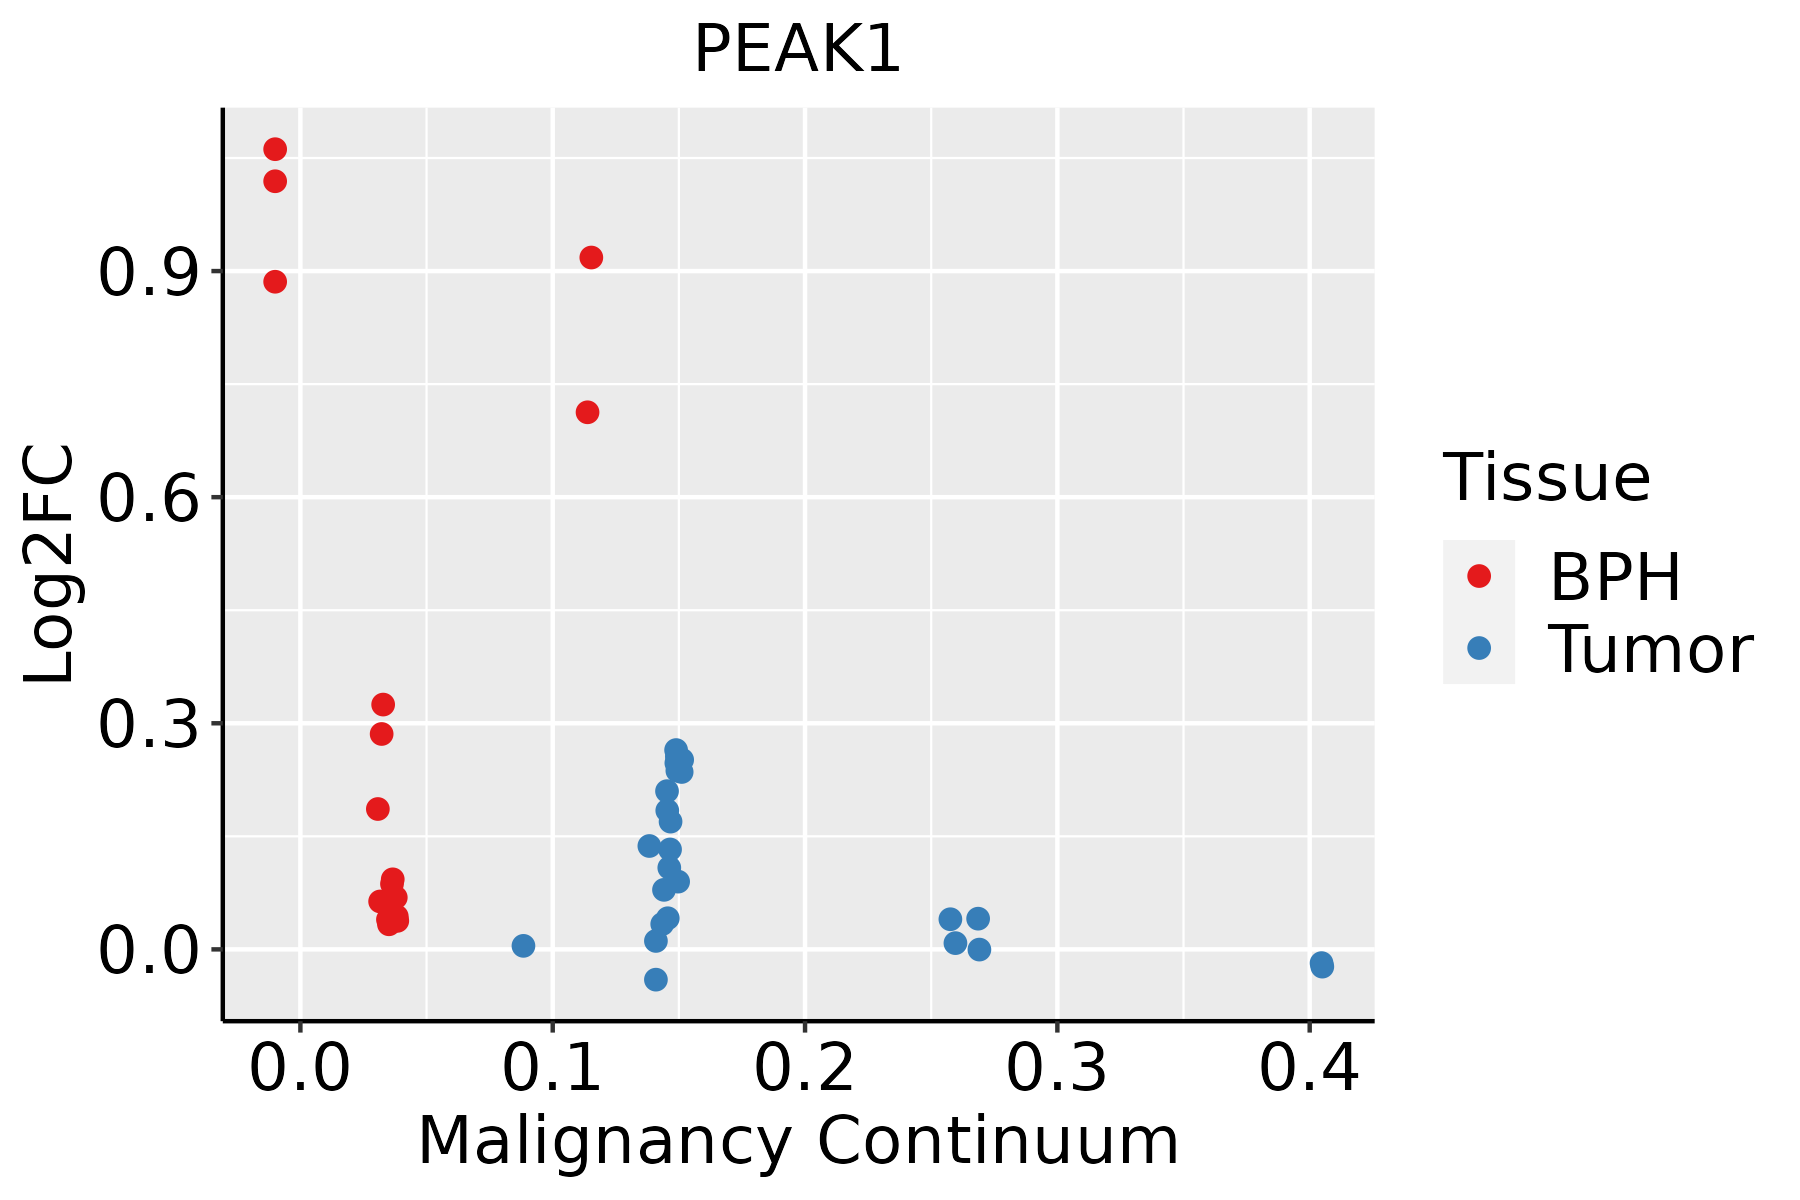 | BPH: Benign Prostatic Hyperplasia |
| Thyroid |  | ATC: Anaplastic thyroid cancer |
| HT: Hashimoto's thyroiditis |
| PTC: Papillary thyroid cancer |
| GO ID | Tissue | Disease Stage | Description | Gene Ratio | Bg Ratio | pvalue | p.adjust | Count |
| GO:0034329 | Colorectum | AD | cell junction assembly | 136/3918 | 420/18723 | 2.02e-08 | 1.15e-06 | 136 |
| GO:0010810 | Colorectum | AD | regulation of cell-substrate adhesion | 81/3918 | 221/18723 | 4.80e-08 | 2.55e-06 | 81 |
| GO:0150115 | Colorectum | AD | cell-substrate junction organization | 44/3918 | 101/18723 | 2.38e-07 | 9.81e-06 | 44 |
| GO:0031589 | Colorectum | AD | cell-substrate adhesion | 116/3918 | 363/18723 | 4.68e-07 | 1.76e-05 | 116 |
| GO:0007044 | Colorectum | AD | cell-substrate junction assembly | 41/3918 | 95/18723 | 8.20e-07 | 2.85e-05 | 41 |
| GO:0001952 | Colorectum | AD | regulation of cell-matrix adhesion | 50/3918 | 128/18723 | 2.05e-06 | 6.05e-05 | 50 |
| GO:0046777 | Colorectum | AD | protein autophosphorylation | 74/3918 | 227/18723 | 2.48e-05 | 4.76e-04 | 74 |
| GO:0007160 | Colorectum | AD | cell-matrix adhesion | 75/3918 | 233/18723 | 3.56e-05 | 6.45e-04 | 75 |
| GO:0048041 | Colorectum | AD | focal adhesion assembly | 34/3918 | 87/18723 | 8.30e-05 | 1.30e-03 | 34 |
| GO:0034446 | Colorectum | AD | substrate adhesion-dependent cell spreading | 40/3918 | 108/18723 | 8.52e-05 | 1.32e-03 | 40 |
| GO:0150116 | Colorectum | AD | regulation of cell-substrate junction organization | 28/3918 | 71/18723 | 2.85e-04 | 3.48e-03 | 28 |
| GO:0051893 | Colorectum | AD | regulation of focal adhesion assembly | 25/3918 | 66/18723 | 1.18e-03 | 1.06e-02 | 25 |
| GO:0090109 | Colorectum | AD | regulation of cell-substrate junction assembly | 25/3918 | 66/18723 | 1.18e-03 | 1.06e-02 | 25 |
| GO:1901888 | Colorectum | AD | regulation of cell junction assembly | 61/3918 | 204/18723 | 1.50e-03 | 1.27e-02 | 61 |
| GO:00108101 | Colorectum | SER | regulation of cell-substrate adhesion | 64/2897 | 221/18723 | 2.34e-07 | 1.29e-05 | 64 |
| GO:00343291 | Colorectum | SER | cell junction assembly | 100/2897 | 420/18723 | 4.23e-06 | 1.61e-04 | 100 |
| GO:01501151 | Colorectum | SER | cell-substrate junction organization | 34/2897 | 101/18723 | 4.46e-06 | 1.67e-04 | 34 |
| GO:00467771 | Colorectum | SER | protein autophosphorylation | 60/2897 | 227/18723 | 1.36e-05 | 4.25e-04 | 60 |
| GO:00019521 | Colorectum | SER | regulation of cell-matrix adhesion | 39/2897 | 128/18723 | 1.39e-05 | 4.30e-04 | 39 |
| GO:00070441 | Colorectum | SER | cell-substrate junction assembly | 31/2897 | 95/18723 | 2.34e-05 | 6.64e-04 | 31 |
| Hugo Symbol | Variant Class | Variant Classification | dbSNP RS | HGVSc | HGVSp | HGVSp Short | SWISSPROT | BIOTYPE | SIFT | PolyPhen | Tumor Sample Barcode | Tissue | Histology | Sex | Age | Stage | Therapy Types | Drugs | Outcome |
| PEAK1 | SNV | Missense_Mutation | rs756989281 | c.4865G>A | p.Arg1622Gln | p.R1622Q | Q9H792 | protein_coding | tolerated(0.42) | possibly_damaging(0.51) | TCGA-AC-A23H-01 | Breast | breast invasive carcinoma | Female | >=65 | I/II | Unknown | Unknown | PD |
| PEAK1 | SNV | Missense_Mutation | | c.4618G>A | p.Glu1540Lys | p.E1540K | Q9H792 | protein_coding | tolerated(0.13) | possibly_damaging(0.575) | TCGA-AC-A23H-01 | Breast | breast invasive carcinoma | Female | >=65 | I/II | Unknown | Unknown | PD |
| PEAK1 | SNV | Missense_Mutation | novel | c.1915N>C | p.Ala639Pro | p.A639P | Q9H792 | protein_coding | deleterious(0) | probably_damaging(0.996) | TCGA-AC-A5EH-01 | Breast | breast invasive carcinoma | Female | >=65 | I/II | Unknown | Unknown | SD |
| PEAK1 | SNV | Missense_Mutation | rs781337850 | c.4726C>T | p.Arg1576Cys | p.R1576C | Q9H792 | protein_coding | deleterious(0) | probably_damaging(0.999) | TCGA-AN-A046-01 | Breast | breast invasive carcinoma | Female | >=65 | I/II | Unknown | Unknown | SD |
| PEAK1 | SNV | Missense_Mutation | novel | c.2651N>G | p.Asn884Ser | p.N884S | Q9H792 | protein_coding | deleterious(0.03) | benign(0.054) | TCGA-AR-A1AM-01 | Breast | breast invasive carcinoma | Female | <65 | III/IV | Chemotherapy | adriamycin | SD |
| PEAK1 | SNV | Missense_Mutation | | c.80A>G | p.His27Arg | p.H27R | Q9H792 | protein_coding | deleterious(0) | probably_damaging(0.997) | TCGA-D8-A140-01 | Breast | breast invasive carcinoma | Female | <65 | I/II | Chemotherapy | doxorubicin+cyclophosphamid | SD |
| PEAK1 | SNV | Missense_Mutation | rs749774987 | c.4906N>T | p.Arg1636Trp | p.R1636W | Q9H792 | protein_coding | tolerated(0.25) | benign(0.001) | TCGA-E2-A156-01 | Breast | breast invasive carcinoma | Female | <65 | I/II | Hormone Therapy | arimidex | SD |
| PEAK1 | SNV | Missense_Mutation | | c.73A>T | p.Ser25Cys | p.S25C | Q9H792 | protein_coding | deleterious(0) | probably_damaging(0.935) | TCGA-E2-A1LL-01 | Breast | breast invasive carcinoma | Female | >=65 | III/IV | Chemotherapy | docetaxel | PD |
| PEAK1 | SNV | Missense_Mutation | rs200619883 | c.4907G>A | p.Arg1636Gln | p.R1636Q | Q9H792 | protein_coding | tolerated(0.6) | benign(0) | TCGA-EW-A1OY-01 | Breast | breast invasive carcinoma | Female | <65 | I/II | Chemotherapy | doxorubicin | SD |
| PEAK1 | SNV | Missense_Mutation | | c.3078G>T | p.Gln1026His | p.Q1026H | Q9H792 | protein_coding | tolerated(0.17) | benign(0.365) | TCGA-GM-A2DH-01 | Breast | breast invasive carcinoma | Female | <65 | I/II | Chemotherapy | taxol | CR |


