
|
|||||
|
 | |
| |
| |
| |
| |
| |
|
Gene: NPW |
Gene summary for NPW |
| Gene information | Species | Human | Gene symbol | NPW | Gene ID | 283869 |
| Gene name | neuropeptide W | |
| Gene Alias | L8 | |
| Cytomap | 16p13.3 | |
| Gene Type | protein-coding | GO ID | GO:0007154 | UniProtAcc | Q8N729 |
Top |
Malignant transformation analysis |
| Identification of the aberrant gene expression in precancerous and cancerous lesions by comparing the gene expression of stem-like cells in diseased tissues with normal stem cells |
| Entrez ID | Symbol | Replicates | Species | Organ | Tissue | Adj P-value | Log2FC | Malignancy |
| 283869 | NPW | GSM4909281 | Human | Breast | IDC | 4.72e-07 | 1.87e-01 | 0.21 |
| 283869 | NPW | GSM4909285 | Human | Breast | IDC | 5.65e-37 | 5.47e-01 | 0.21 |
| 283869 | NPW | GSM4909287 | Human | Breast | IDC | 1.76e-17 | 4.55e-01 | 0.2057 |
| 283869 | NPW | GSM4909290 | Human | Breast | IDC | 3.19e-22 | 5.79e-01 | 0.2096 |
| 283869 | NPW | GSM4909297 | Human | Breast | IDC | 2.29e-04 | 2.30e-01 | 0.1517 |
| 283869 | NPW | GSM4909304 | Human | Breast | IDC | 2.63e-24 | 5.27e-01 | 0.1636 |
| 283869 | NPW | GSM4909317 | Human | Breast | IDC | 1.40e-56 | 1.15e+00 | 0.1355 |
| 283869 | NPW | GSM4909318 | Human | Breast | IDC | 6.00e-18 | 1.04e+00 | 0.2031 |
| 283869 | NPW | GSM4909321 | Human | Breast | IDC | 1.30e-09 | 3.82e-01 | 0.1559 |
| 283869 | NPW | M1 | Human | Breast | IDC | 1.12e-02 | 1.86e-01 | 0.1577 |
| 283869 | NPW | LZE5T | Human | Esophagus | ESCC | 1.40e-06 | 5.85e-01 | 0.0514 |
| 283869 | NPW | LZE22D1 | Human | Esophagus | HGIN | 4.30e-07 | 3.77e-01 | 0.0595 |
| 283869 | NPW | LZE22T | Human | Esophagus | ESCC | 3.15e-15 | 1.00e+00 | 0.068 |
| 283869 | NPW | LZE24T | Human | Esophagus | ESCC | 1.46e-02 | 1.43e-01 | 0.0596 |
| 283869 | NPW | P1T-E | Human | Esophagus | ESCC | 3.50e-13 | 7.37e-01 | 0.0875 |
| 283869 | NPW | P2T-E | Human | Esophagus | ESCC | 1.74e-96 | 2.14e+00 | 0.1177 |
| 283869 | NPW | P4T-E | Human | Esophagus | ESCC | 2.45e-49 | 1.93e+00 | 0.1323 |
| 283869 | NPW | P5T-E | Human | Esophagus | ESCC | 7.28e-26 | 5.55e-01 | 0.1327 |
| 283869 | NPW | P8T-E | Human | Esophagus | ESCC | 6.38e-31 | 8.18e-01 | 0.0889 |
| 283869 | NPW | P9T-E | Human | Esophagus | ESCC | 4.01e-04 | 1.29e-01 | 0.1131 |
| Page: 1 2 3 4 5 |
| Tissue | Expression Dynamics | Abbreviation |
| Breast | 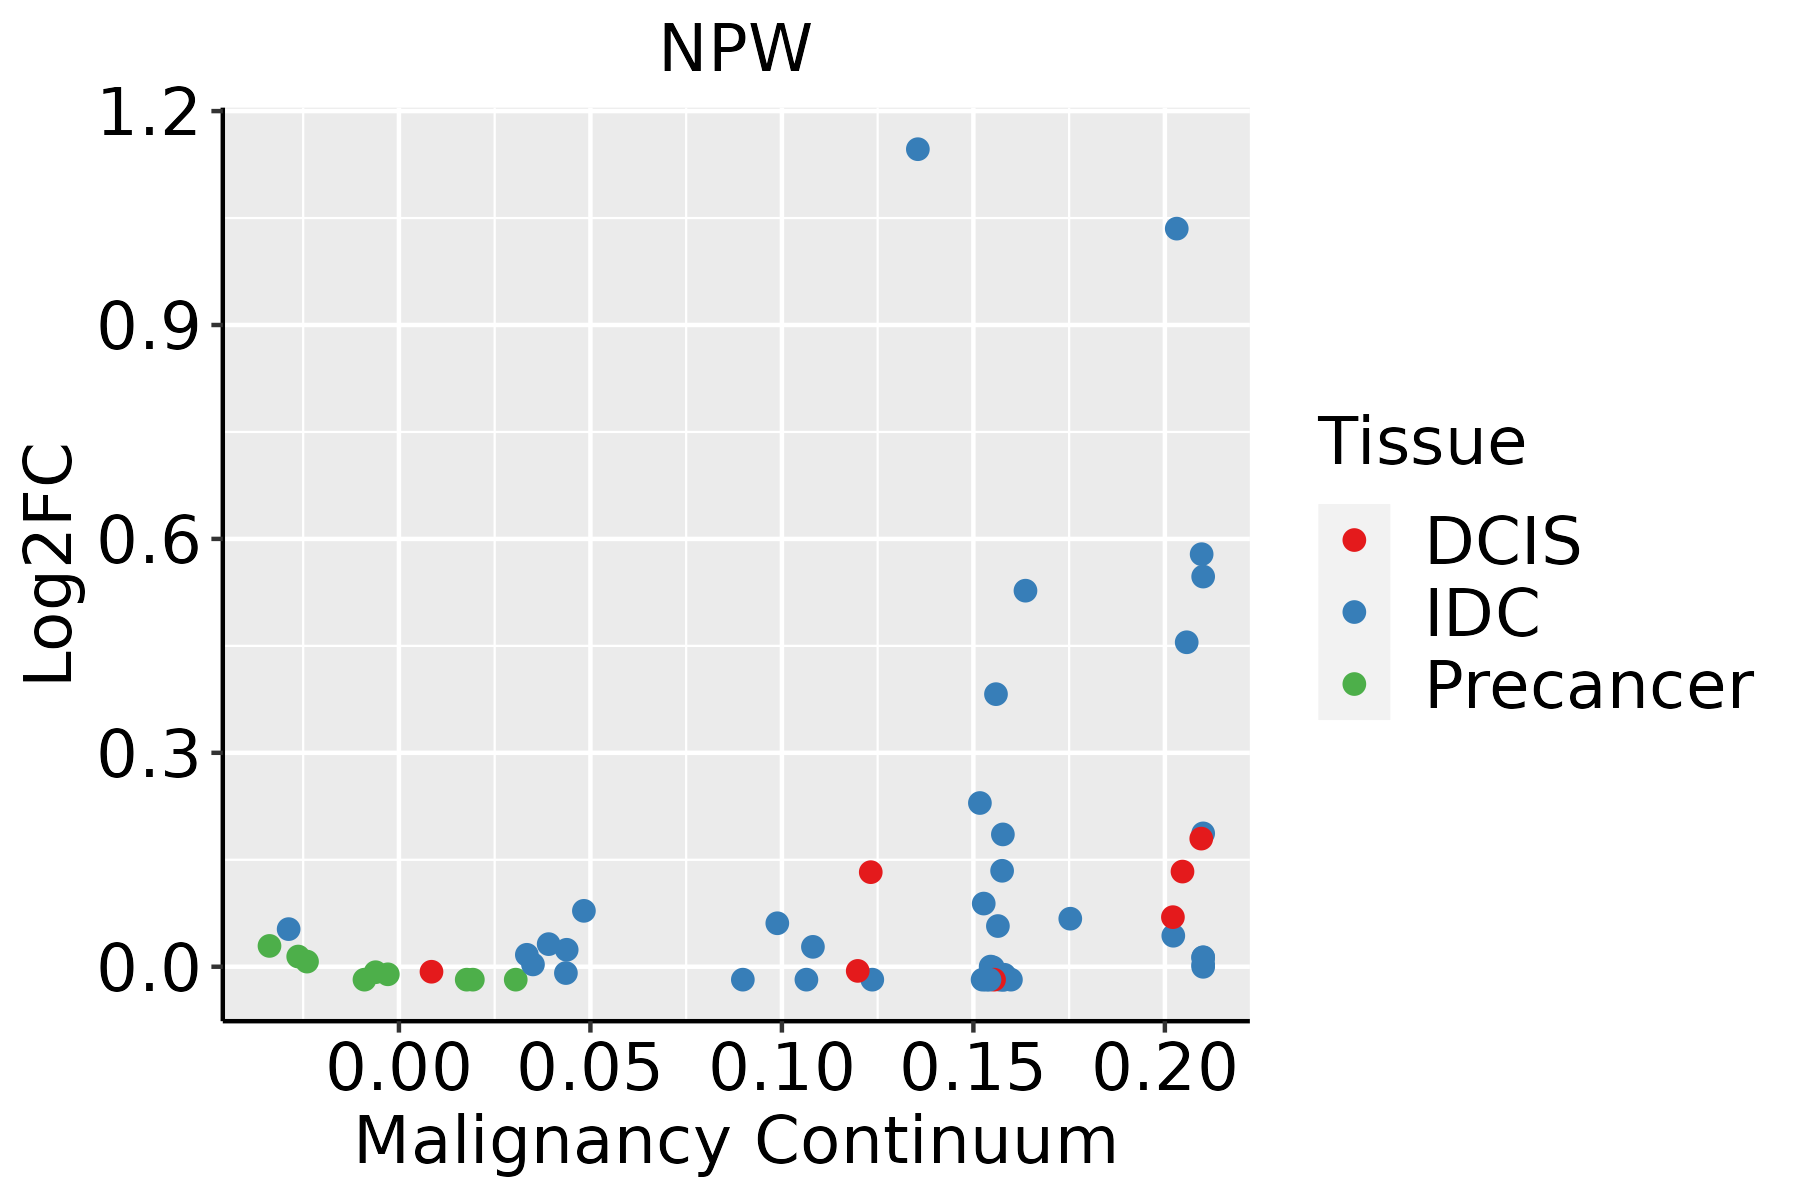 | IDC: Invasive ductal carcinoma |
| DCIS: Ductal carcinoma in situ | ||
| Precancer(BRCA1-mut): Precancerous lesion from BRCA1 mutation carriers | ||
| Esophagus |  | ESCC: Esophageal squamous cell carcinoma |
| HGIN: High-grade intraepithelial neoplasias | ||
| LGIN: Low-grade intraepithelial neoplasias | ||
| Liver |  | HCC: Hepatocellular carcinoma |
| NAFLD: Non-alcoholic fatty liver disease | ||
| Oral Cavity | 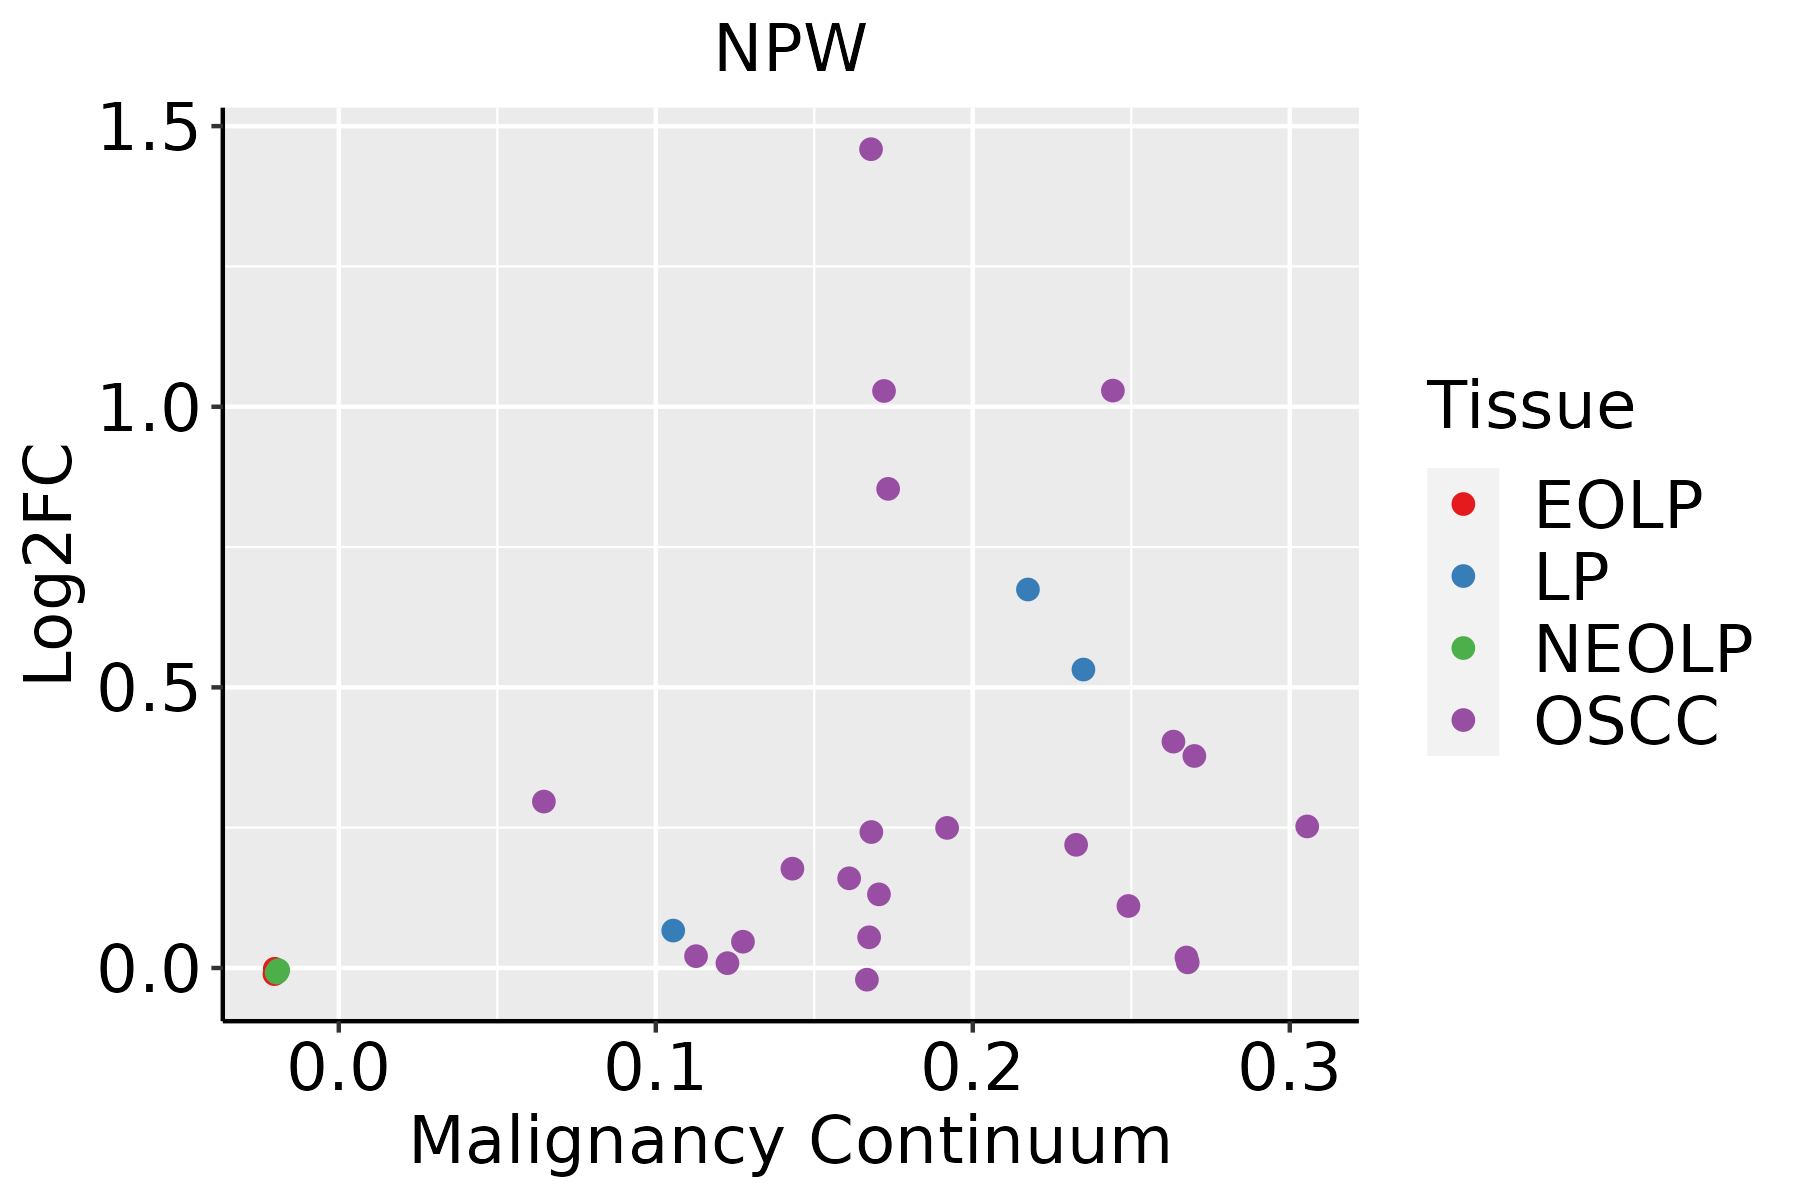 | EOLP: Erosive Oral lichen planus |
| LP: leukoplakia | ||
| NEOLP: Non-erosive oral lichen planus | ||
| OSCC: Oral squamous cell carcinoma | ||
| Thyroid | 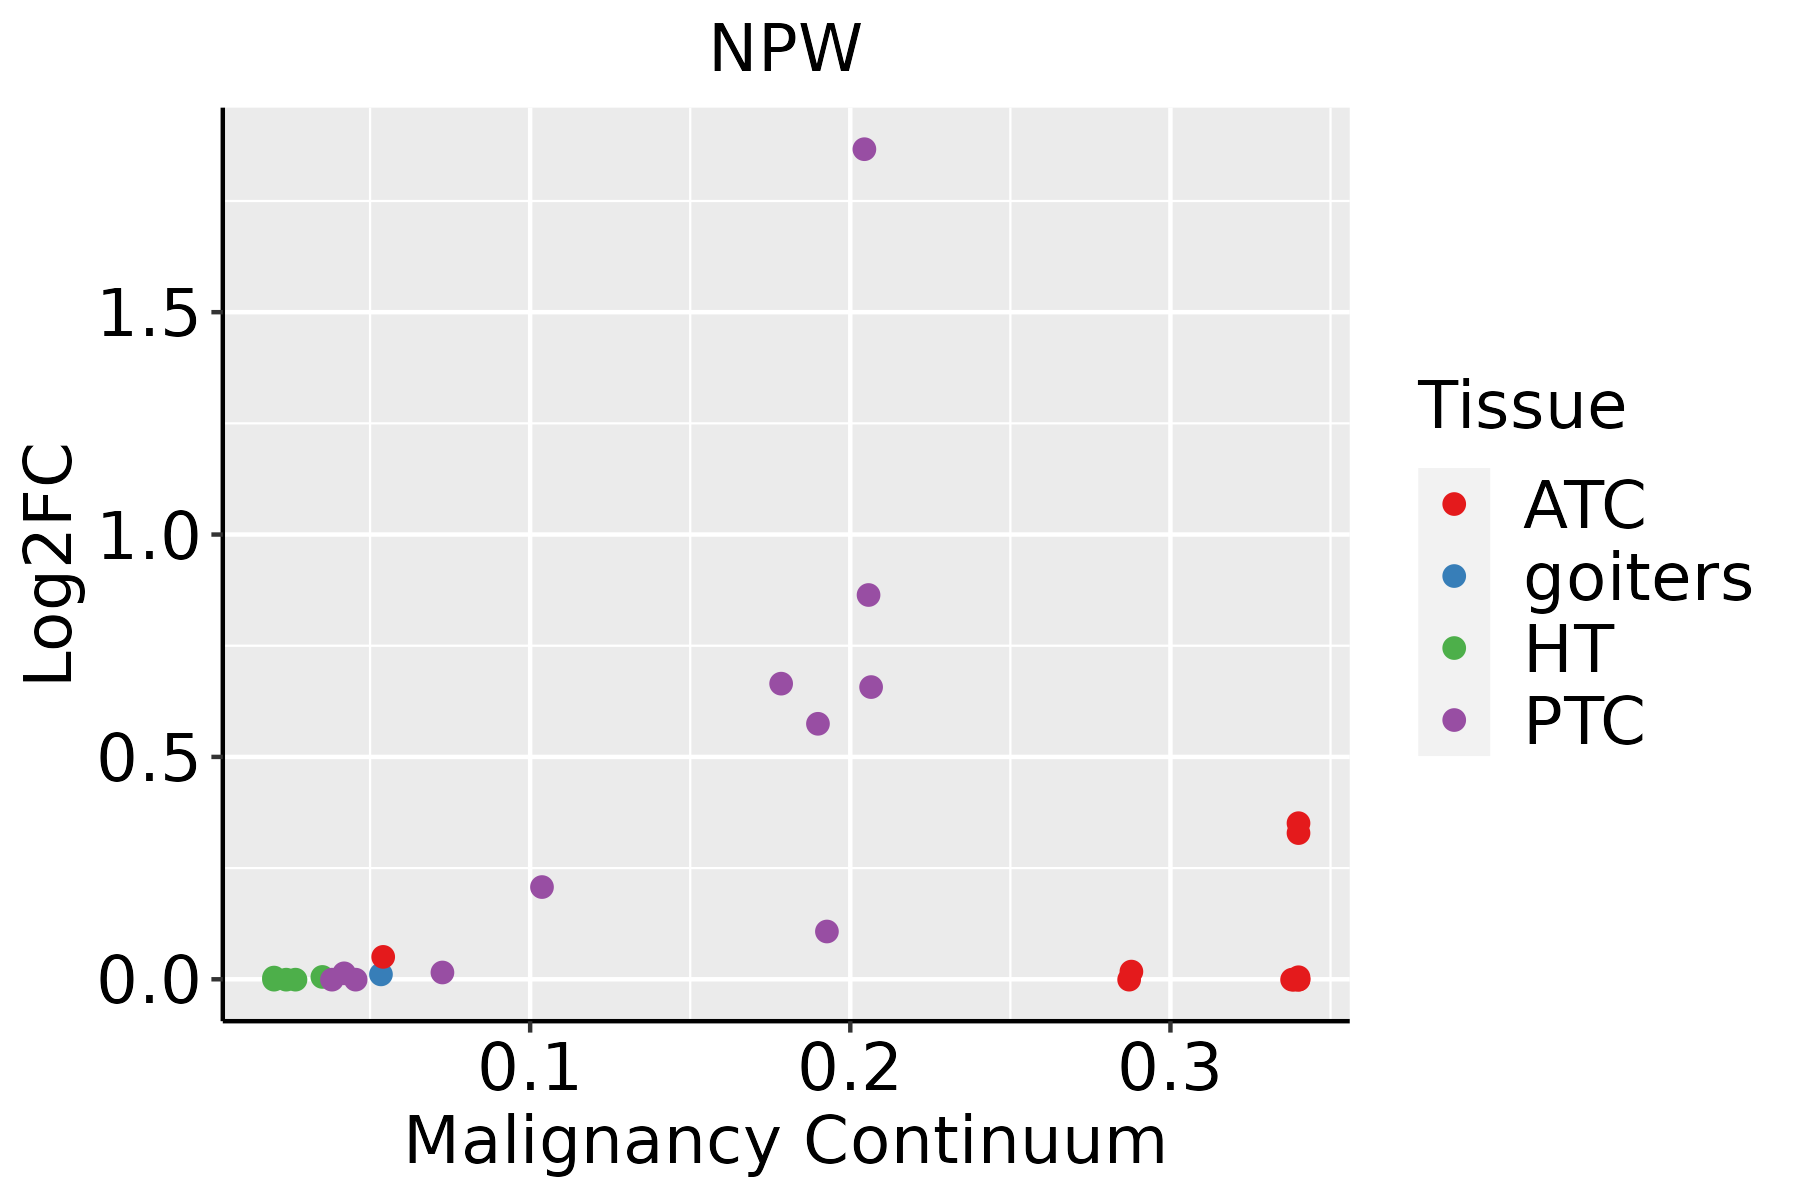 | ATC: Anaplastic thyroid cancer |
| HT: Hashimoto's thyroiditis | ||
| PTC: Papillary thyroid cancer |
| ∗log2FC in expression of this searched gene in stem-like cells from each diseased tissue sample relative to stem-like cells in normal samples in each tissue plotted against the malignancy continuum. Samples are colored based on if they are from different disease stage. |
Top |
Malignant transformation related pathway analysis |
| Find out the enriched GO biological processes and KEGG pathways involved in transition from healthy to precancer to cancer |
| Tissue | Disease Stage | Enriched GO biological Processes |
| Liver | Cyst |  |
| Lung | IAC |  |
| Lung | AIS |  |
| Lung | AAH |  |
| Lung | MIAC |  |
| ∗Top 15 enriched GO BP terms are showed in the bar plot of each disease state in each tissue. Each row represents a significant GO biological process which is colored according to the -log10(p.adjust). |
| Page: 1 2 3 4 5 6 7 8 9 |
| GO ID | Tissue | Disease Stage | Description | Gene Ratio | Bg Ratio | pvalue | p.adjust | Count |
| GO:00063257 | Cervix | CC | chromatin organization | 78/2311 | 409/18723 | 5.40e-05 | 8.02e-04 | 78 |
| GO:00063381 | Cervix | CC | chromatin remodeling | 45/2311 | 255/18723 | 8.33e-03 | 4.30e-02 | 45 |
| GO:000705911 | Esophagus | ESCC | chromosome segregation | 238/8552 | 346/18723 | 1.72e-18 | 1.82e-16 | 238 |
| GO:000632517 | Esophagus | ESCC | chromatin organization | 240/8552 | 409/18723 | 6.52e-08 | 1.14e-06 | 240 |
| GO:00513831 | Esophagus | ESCC | kinetochore organization | 21/8552 | 23/18723 | 5.69e-06 | 5.90e-05 | 21 |
| GO:00345081 | Esophagus | ESCC | centromere complex assembly | 25/8552 | 30/18723 | 2.45e-05 | 2.09e-04 | 25 |
| GO:00513821 | Esophagus | ESCC | kinetochore assembly | 16/8552 | 18/18723 | 1.78e-04 | 1.15e-03 | 16 |
| GO:0031055 | Esophagus | ESCC | chromatin remodeling at centromere | 9/8552 | 10/18723 | 5.09e-03 | 1.92e-02 | 9 |
| GO:0043486 | Esophagus | ESCC | histone exchange | 16/8552 | 22/18723 | 9.46e-03 | 3.28e-02 | 16 |
| GO:0007059 | Liver | HCC | chromosome segregation | 197/7958 | 346/18723 | 3.57e-08 | 7.87e-07 | 197 |
| GO:000632511 | Liver | HCC | chromatin organization | 206/7958 | 409/18723 | 7.23e-04 | 4.41e-03 | 206 |
| GO:00070592 | Oral cavity | OSCC | chromosome segregation | 206/7305 | 346/18723 | 5.82e-15 | 3.76e-13 | 206 |
| GO:0051383 | Oral cavity | OSCC | kinetochore organization | 18/7305 | 23/18723 | 1.47e-04 | 1.04e-03 | 18 |
| GO:0034508 | Oral cavity | OSCC | centromere complex assembly | 21/7305 | 30/18723 | 5.75e-04 | 3.30e-03 | 21 |
| GO:0051382 | Oral cavity | OSCC | kinetochore assembly | 14/7305 | 18/18723 | 9.51e-04 | 4.96e-03 | 14 |
| GO:000632510 | Oral cavity | OSCC | chromatin organization | 190/7305 | 409/18723 | 1.17e-03 | 5.97e-03 | 190 |
| GO:00070591 | Oral cavity | LP | chromosome segregation | 117/4623 | 346/18723 | 7.61e-05 | 9.91e-04 | 117 |
| GO:000705912 | Skin | cSCC | chromosome segregation | 161/4864 | 346/18723 | 8.34e-17 | 8.57e-15 | 161 |
| GO:000632519 | Skin | cSCC | chromatin organization | 147/4864 | 409/18723 | 4.41e-06 | 6.52e-05 | 147 |
| GO:000633812 | Skin | cSCC | chromatin remodeling | 94/4864 | 255/18723 | 7.58e-05 | 7.26e-04 | 94 |
| Page: 1 2 |
| Pathway ID | Tissue | Disease Stage | Description | Gene Ratio | Bg Ratio | pvalue | p.adjust | qvalue | Count |
| Page: 1 |
Top |
Cell-cell communication analysis |
| Identification of potential cell-cell interactions between two cell types and their ligand-receptor pairs for different disease states |
| Ligand | Receptor | LRpair | Pathway | Tissue | Disease Stage |
| Page: 1 |
Top |
Single-cell gene regulatory network inference analysis |
| Find out the significant the regulons (TFs) and the target genes of each regulon across cell types for different disease states |
| TF | Cell Type | Tissue | Disease Stage | Target Gene | RSS | Regulon Activity |
| ∗The dot plots of a searched regulon are shown for all cell subpopulations in each disease state of each tissue based on the regulon specific score inferred using pySCENIC and by calculating the average expression. |
| Page: 1 |
Top |
Somatic mutation of malignant transformation related genes |
| Annotation of somatic variants for genes involved in malignant transformation |
| Hugo Symbol | Variant Class | Variant Classification | dbSNP RS | HGVSc | HGVSp | HGVSp Short | SWISSPROT | BIOTYPE | SIFT | PolyPhen | Tumor Sample Barcode | Tissue | Histology | Sex | Age | Stage | Therapy Types | Drugs | Outcome |
| NPW | SNV | Missense_Mutation | novel | c.413G>T | p.Arg138Ile | p.R138I | Q8N729 | protein_coding | deleterious_low_confidence(0.01) | benign(0.047) | TCGA-AP-A1DV-01 | Endometrium | uterine corpus endometrioid carcinoma | Female | <65 | I/II | Unknown | Unknown | SD |
| NPW | SNV | Missense_Mutation | novel | c.358N>T | p.Ala120Ser | p.A120S | Q8N729 | protein_coding | tolerated(0.29) | possibly_damaging(0.478) | TCGA-F7-A50I-01 | Oral cavity | head & neck squamous cell carcinoma | Male | >=65 | I/II | Unknown | Unknown | SD |
| NPW | SNV | Missense_Mutation | c.226G>A | p.Asp76Asn | p.D76N | Q8N729 | protein_coding | tolerated(0.25) | possibly_damaging(0.541) | TCGA-D7-A4YU-01 | Stomach | stomach adenocarcinoma | Male | >=65 | III/IV | Chemotherapy | capecitabine | SD |
| Page: 1 |
Top |
Related drugs of malignant transformation related genes |
| Identification of chemicals and drugs interact with genes involved in malignant transfromation |
| (DGIdb 4.0) |
| Entrez ID | Symbol | Category | Interaction Types | Drug Claim Name | Drug Name | PMIDs |
| Page: 1 |

Copyright 2023-Present -The University of Texas Health Science Center at Houston |