
|
|||||
|
 | |
| |
| |
| |
| |
| |
|
Gene: MYEOV2 |
Gene summary for MYEOV2 |
| Gene information | Species | Human | Gene symbol | MYEOV2 | Gene ID | 150678 |
| Gene name | COP9 signalosome subunit 9 | |
| Gene Alias | CSNAP | |
| Cytomap | 2q37.3 | |
| Gene Type | protein-coding | GO ID | GO:0006464 | UniProtAcc | Q8WXC6 |
Top |
Malignant transformation analysis |
| Identification of the aberrant gene expression in precancerous and cancerous lesions by comparing the gene expression of stem-like cells in diseased tissues with normal stem cells |
| Entrez ID | Symbol | Replicates | Species | Organ | Tissue | Adj P-value | Log2FC | Malignancy |
| 150678 | MYEOV2 | P1T-E | Human | Esophagus | ESCC | 2.08e-43 | 1.31e+00 | 0.0875 |
| 150678 | MYEOV2 | P2T-E | Human | Esophagus | ESCC | 1.33e-65 | 9.38e-01 | 0.1177 |
| 150678 | MYEOV2 | P4T-E | Human | Esophagus | ESCC | 3.07e-68 | 1.27e+00 | 0.1323 |
| 150678 | MYEOV2 | P5T-E | Human | Esophagus | ESCC | 2.45e-83 | 1.45e+00 | 0.1327 |
| 150678 | MYEOV2 | P8T-E | Human | Esophagus | ESCC | 1.77e-86 | 1.48e+00 | 0.0889 |
| 150678 | MYEOV2 | P9T-E | Human | Esophagus | ESCC | 3.41e-70 | 1.31e+00 | 0.1131 |
| 150678 | MYEOV2 | P10T-E | Human | Esophagus | ESCC | 8.28e-115 | 1.71e+00 | 0.116 |
| 150678 | MYEOV2 | P11T-E | Human | Esophagus | ESCC | 3.44e-33 | 1.00e+00 | 0.1426 |
| 150678 | MYEOV2 | P12T-E | Human | Esophagus | ESCC | 6.78e-98 | 1.74e+00 | 0.1122 |
| 150678 | MYEOV2 | P15T-E | Human | Esophagus | ESCC | 2.22e-83 | 1.61e+00 | 0.1149 |
| 150678 | MYEOV2 | P16T-E | Human | Esophagus | ESCC | 6.31e-57 | 9.96e-01 | 0.1153 |
| 150678 | MYEOV2 | P17T-E | Human | Esophagus | ESCC | 4.19e-37 | 1.10e+00 | 0.1278 |
| 150678 | MYEOV2 | P19T-E | Human | Esophagus | ESCC | 4.38e-27 | 1.50e+00 | 0.1662 |
| 150678 | MYEOV2 | P20T-E | Human | Esophagus | ESCC | 2.44e-69 | 1.26e+00 | 0.1124 |
| 150678 | MYEOV2 | P21T-E | Human | Esophagus | ESCC | 1.77e-104 | 1.81e+00 | 0.1617 |
| 150678 | MYEOV2 | P22T-E | Human | Esophagus | ESCC | 6.60e-110 | 1.60e+00 | 0.1236 |
| 150678 | MYEOV2 | P23T-E | Human | Esophagus | ESCC | 8.82e-66 | 1.36e+00 | 0.108 |
| 150678 | MYEOV2 | P24T-E | Human | Esophagus | ESCC | 1.72e-54 | 8.84e-01 | 0.1287 |
| 150678 | MYEOV2 | P26T-E | Human | Esophagus | ESCC | 7.71e-74 | 1.18e+00 | 0.1276 |
| 150678 | MYEOV2 | P27T-E | Human | Esophagus | ESCC | 3.82e-72 | 1.07e+00 | 0.1055 |
| Page: 1 2 3 4 5 6 7 |
| Tissue | Expression Dynamics | Abbreviation |
| Esophagus | 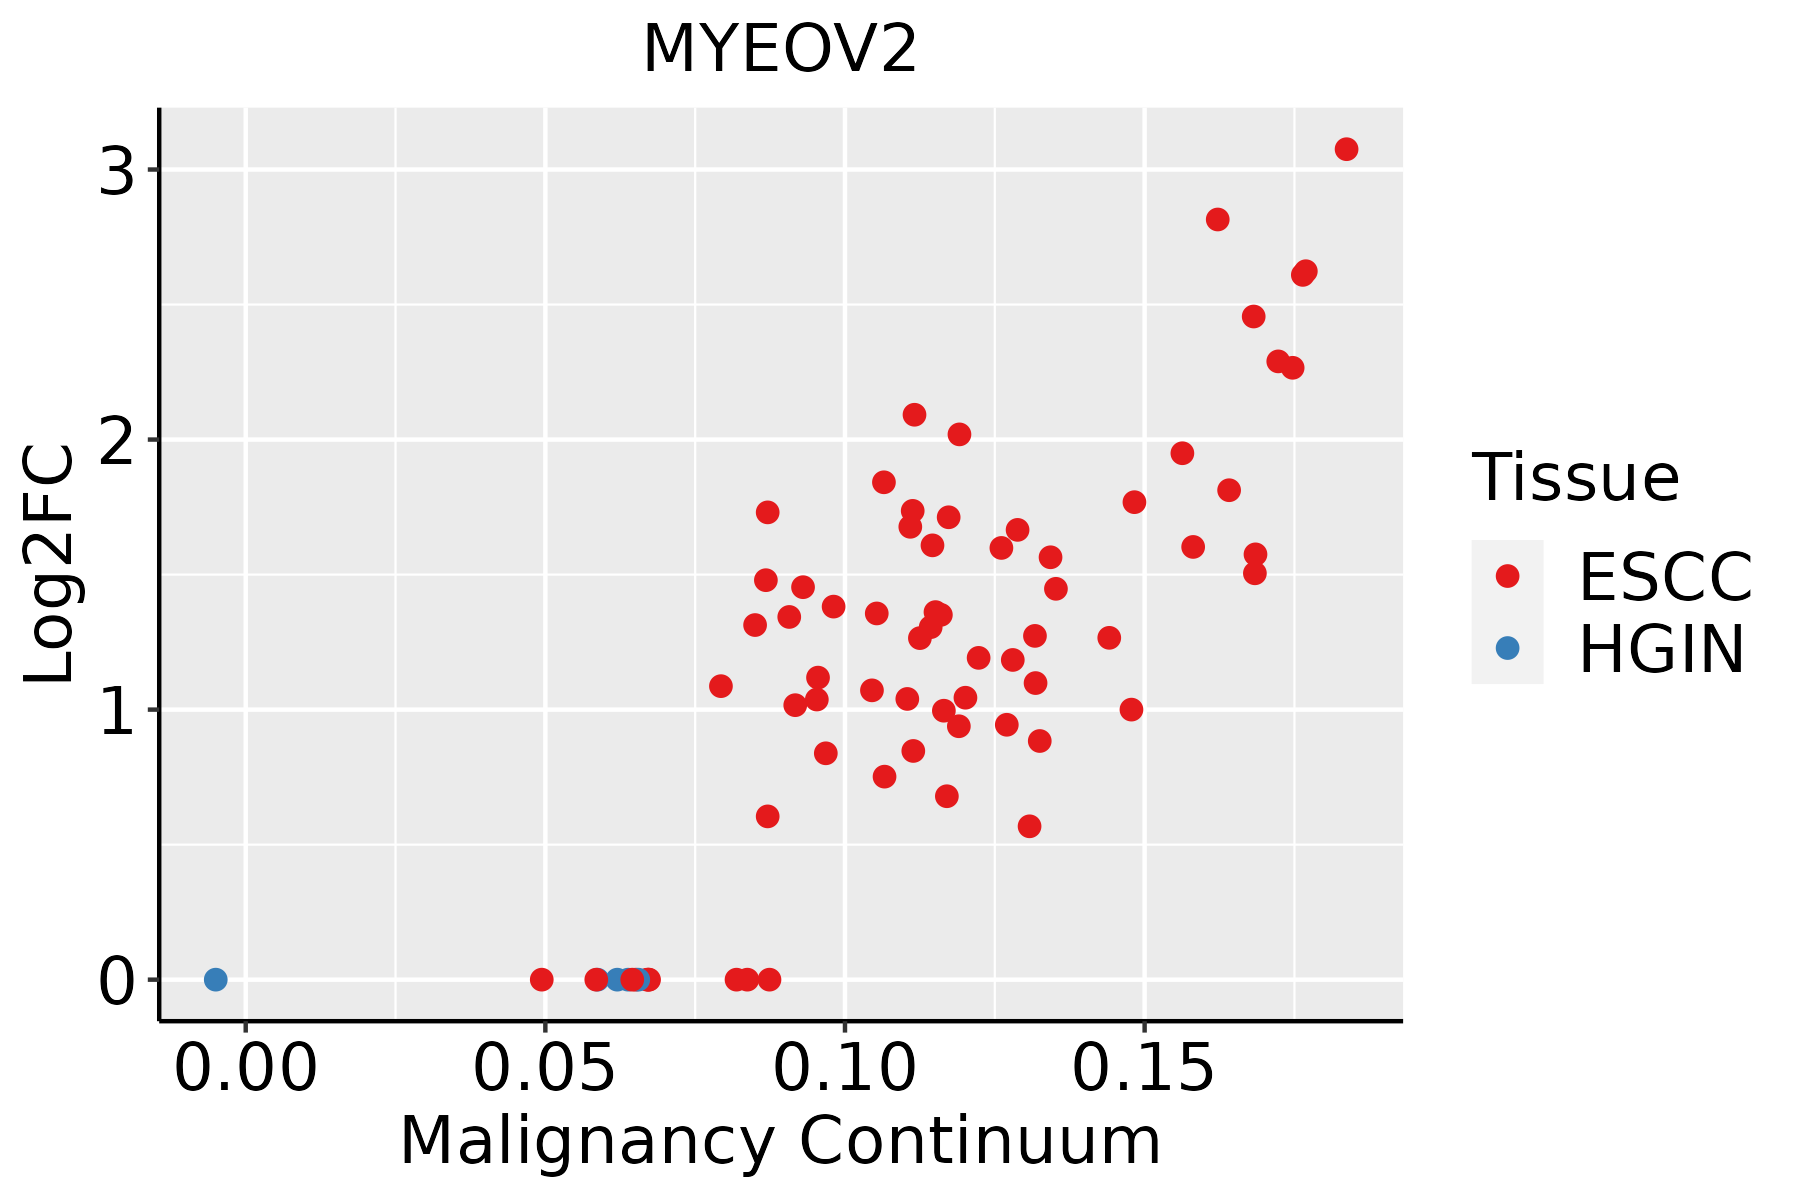 | ESCC: Esophageal squamous cell carcinoma |
| HGIN: High-grade intraepithelial neoplasias | ||
| LGIN: Low-grade intraepithelial neoplasias | ||
| GC | 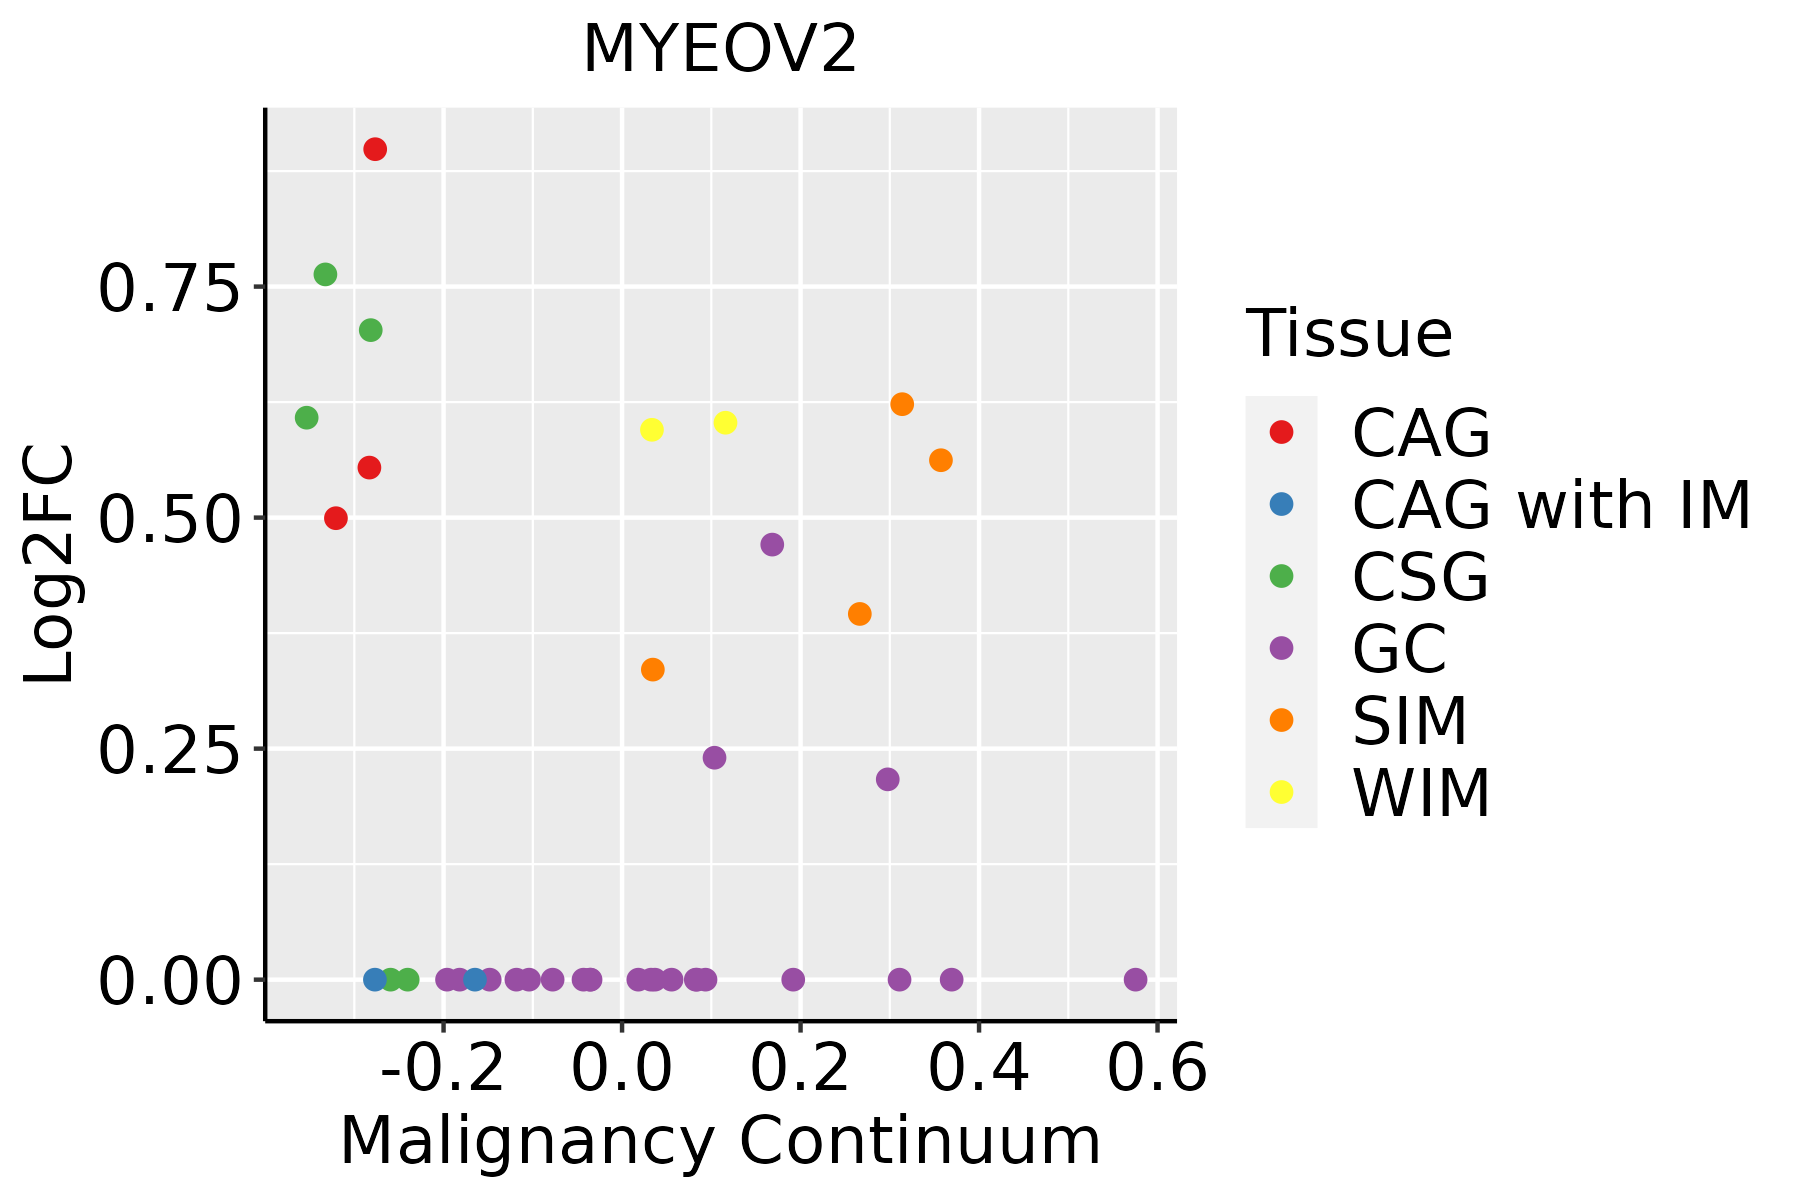 | CAG: Chronic atrophic gastritis |
| CAG with IM: Chronic atrophic gastritis with intestinal metaplasia | ||
| CSG: Chronic superficial gastritis | ||
| GC: Gastric cancer | ||
| SIM: Severe intestinal metaplasia | ||
| WIM: Wild intestinal metaplasia | ||
| Oral Cavity | 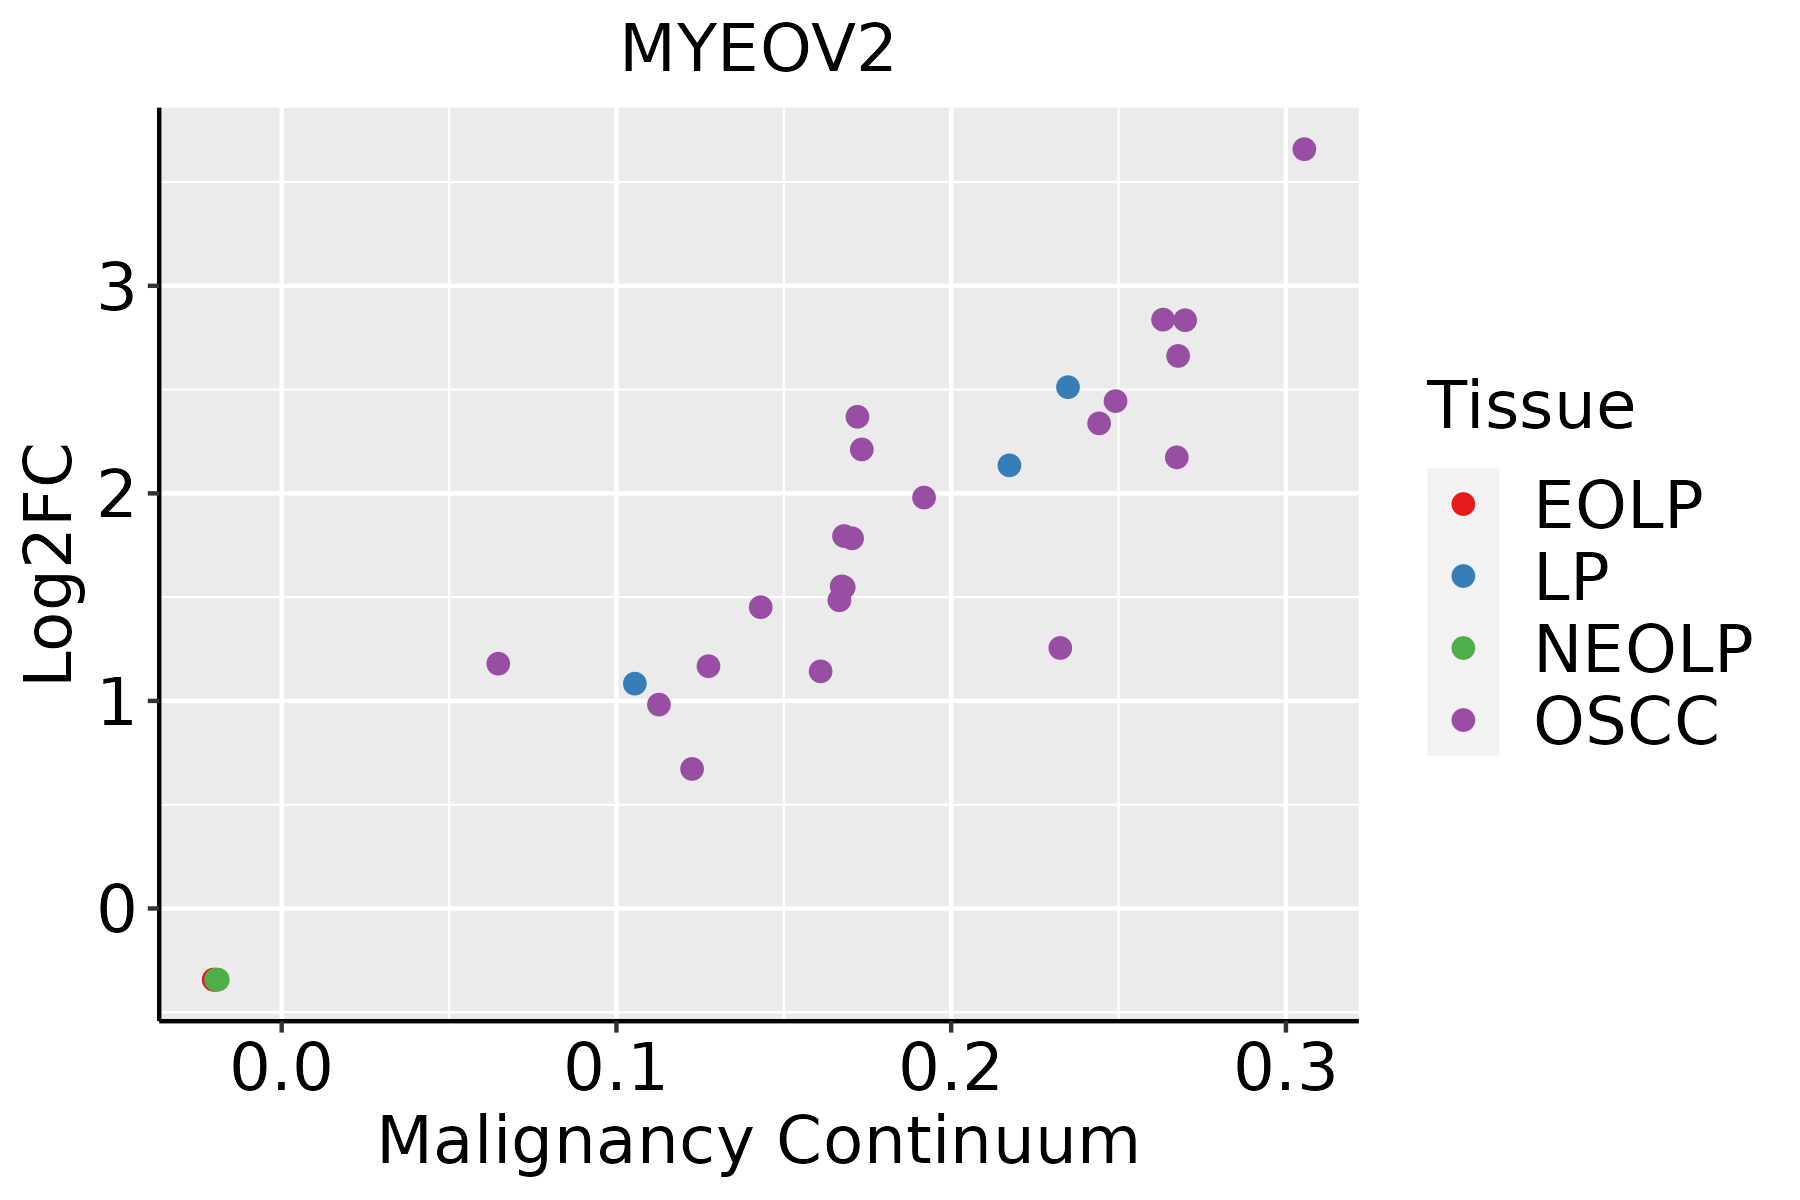 | EOLP: Erosive Oral lichen planus |
| LP: leukoplakia | ||
| NEOLP: Non-erosive oral lichen planus | ||
| OSCC: Oral squamous cell carcinoma | ||
| Prostate | 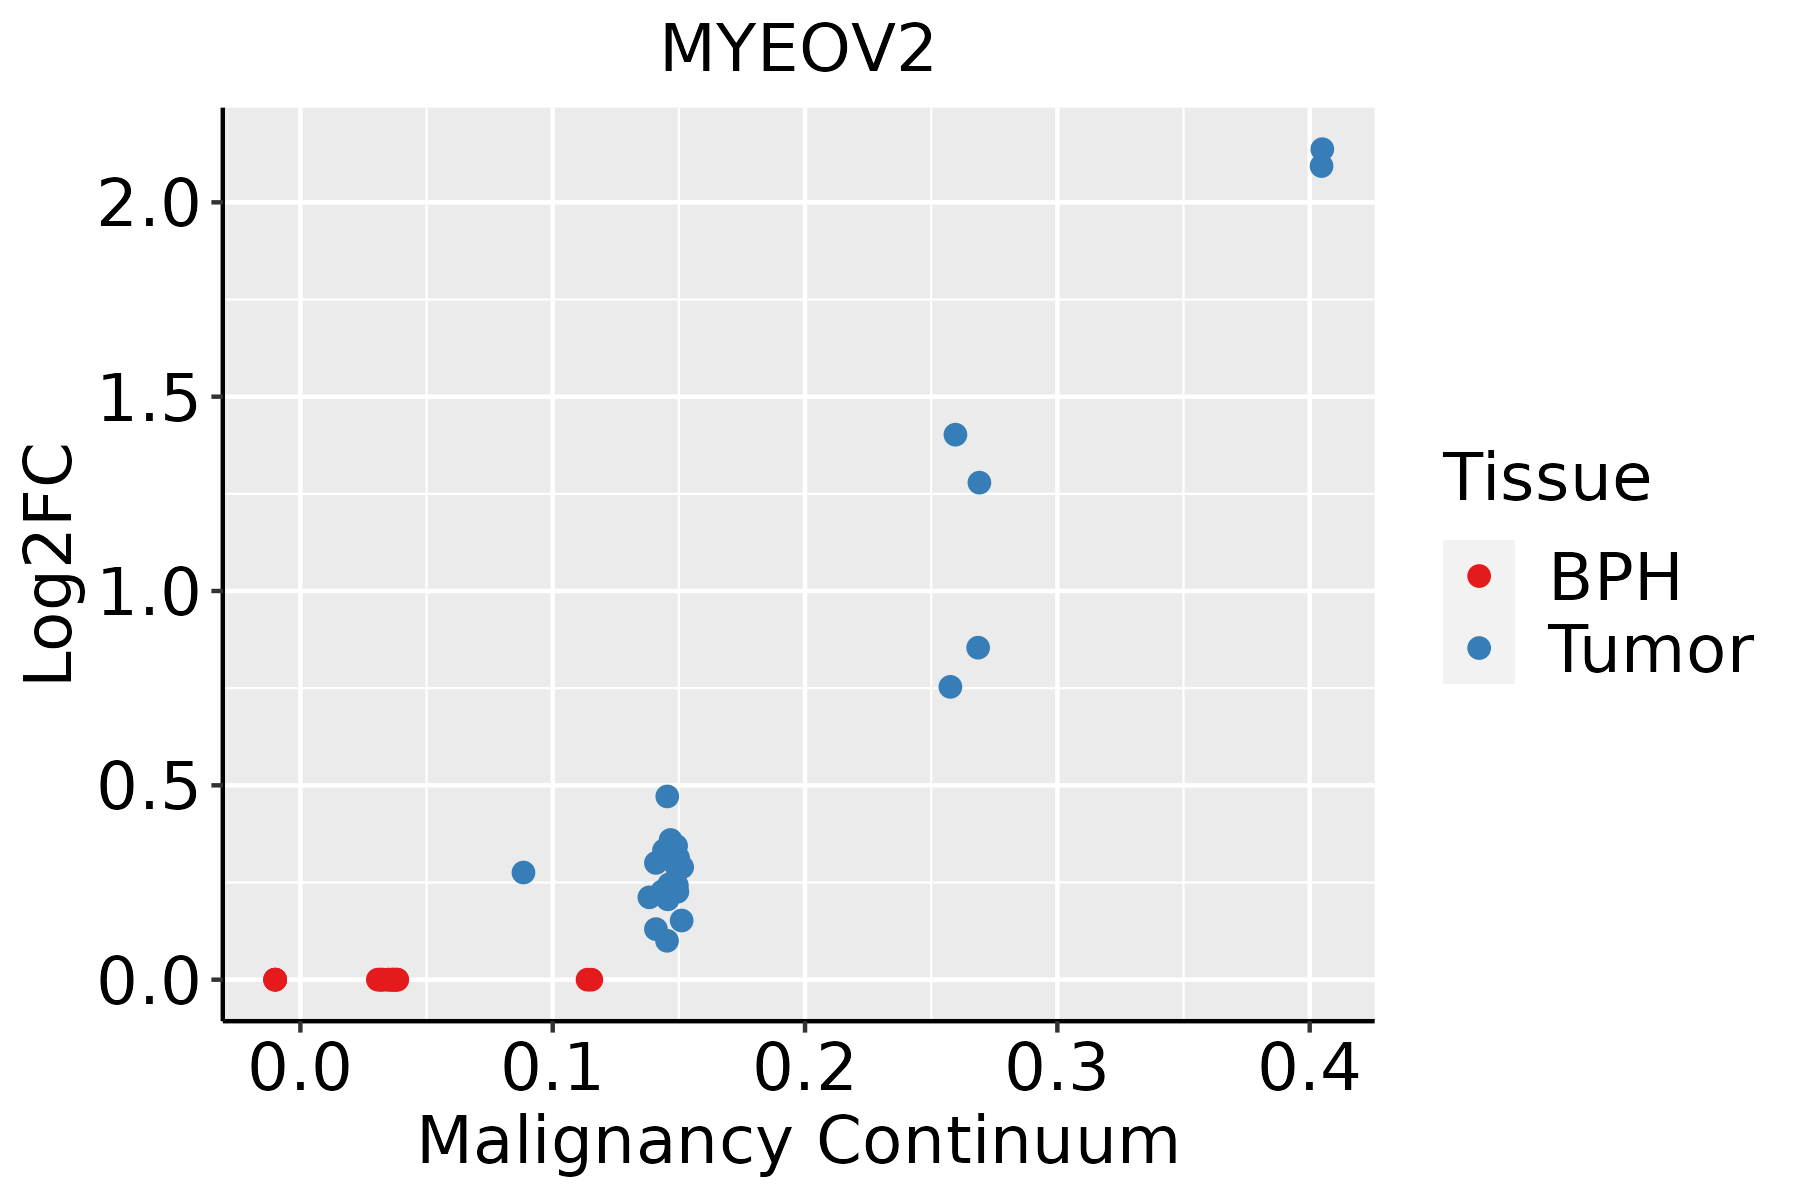 | BPH: Benign Prostatic Hyperplasia |
| Skin | 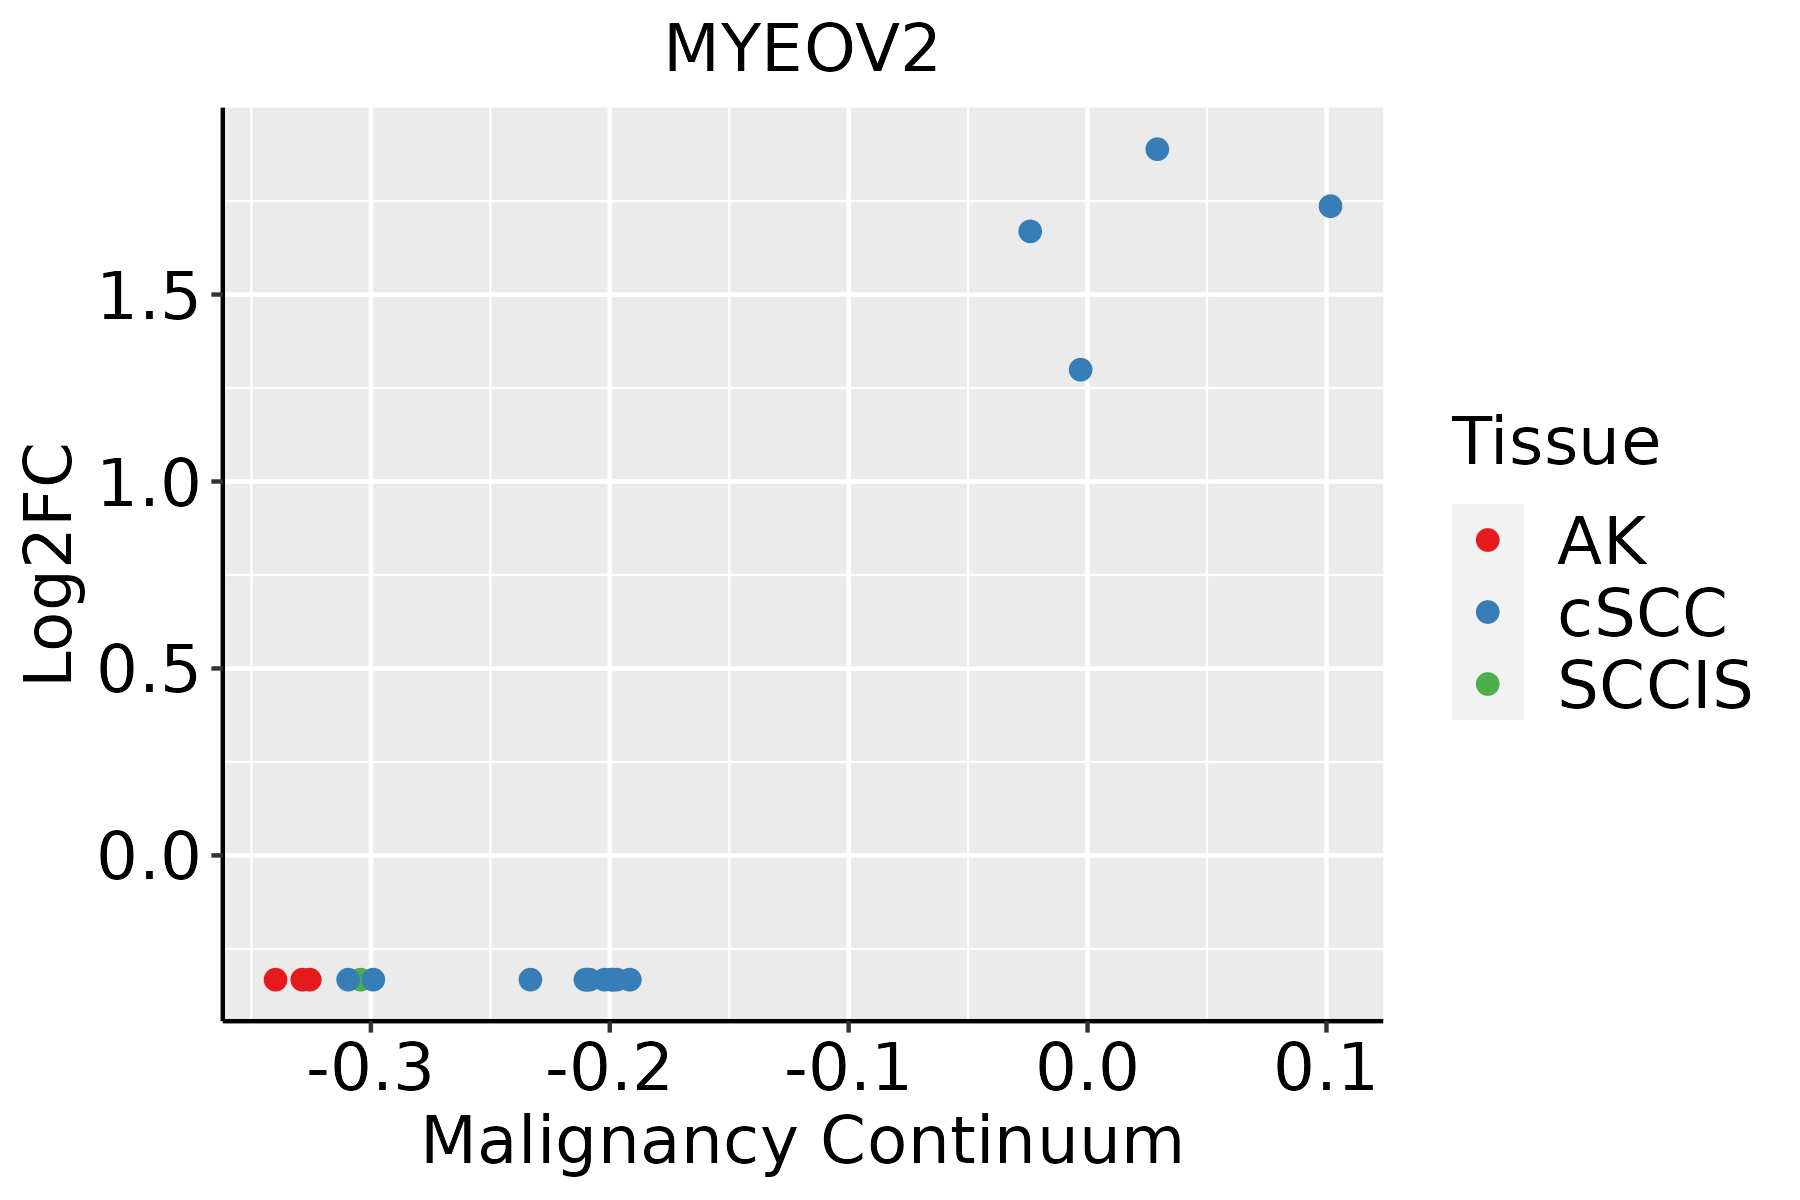 | AK: Actinic keratosis |
| cSCC: Cutaneous squamous cell carcinoma | ||
| SCCIS:squamous cell carcinoma in situ |
| ∗log2FC in expression of this searched gene in stem-like cells from each diseased tissue sample relative to stem-like cells in normal samples in each tissue plotted against the malignancy continuum. Samples are colored based on if they are from different disease stage. |
Top |
Malignant transformation related pathway analysis |
| Find out the enriched GO biological processes and KEGG pathways involved in transition from healthy to precancer to cancer |
| Tissue | Disease Stage | Enriched GO biological Processes |
| Liver | Cyst |  |
| Lung | IAC |  |
| Lung | AIS |  |
| Lung | AAH |  |
| Lung | MIAC |  |
| ∗Top 15 enriched GO BP terms are showed in the bar plot of each disease state in each tissue. Each row represents a significant GO biological process which is colored according to the -log10(p.adjust). |
| Page: 1 2 3 4 5 6 7 8 9 |
| GO ID | Tissue | Disease Stage | Description | Gene Ratio | Bg Ratio | pvalue | p.adjust | Count |
| Page: 1 |
| Pathway ID | Tissue | Disease Stage | Description | Gene Ratio | Bg Ratio | pvalue | p.adjust | qvalue | Count |
| Page: 1 |
Top |
Cell-cell communication analysis |
| Identification of potential cell-cell interactions between two cell types and their ligand-receptor pairs for different disease states |
| Ligand | Receptor | LRpair | Pathway | Tissue | Disease Stage |
| Page: 1 |
Top |
Single-cell gene regulatory network inference analysis |
| Find out the significant the regulons (TFs) and the target genes of each regulon across cell types for different disease states |
| TF | Cell Type | Tissue | Disease Stage | Target Gene | RSS | Regulon Activity |
| ∗The dot plots of a searched regulon are shown for all cell subpopulations in each disease state of each tissue based on the regulon specific score inferred using pySCENIC and by calculating the average expression. |
| Page: 1 |
Top |
Somatic mutation of malignant transformation related genes |
| Annotation of somatic variants for genes involved in malignant transformation |
| Hugo Symbol | Variant Class | Variant Classification | dbSNP RS | HGVSc | HGVSp | HGVSp Short | SWISSPROT | BIOTYPE | SIFT | PolyPhen | Tumor Sample Barcode | Tissue | Histology | Sex | Age | Stage | Therapy Types | Drugs | Outcome |
| Page: 1 |
Top |
Related drugs of malignant transformation related genes |
| Identification of chemicals and drugs interact with genes involved in malignant transfromation |
| (DGIdb 4.0) |
| Entrez ID | Symbol | Category | Interaction Types | Drug Claim Name | Drug Name | PMIDs |
| Page: 1 |

Copyright 2023-Present -The University of Texas Health Science Center at Houston |