
|
|||||
|
 | |
| |
| |
| |
| |
| |
|
Gene: MTRNR2L1 |
Gene summary for MTRNR2L1 |
| Gene information | Species | Human | Gene symbol | MTRNR2L1 | Gene ID | 100462977 |
| Gene name | MT-RNR2 like 1 | |
| Gene Alias | HN1 | |
| Cytomap | 17p11.2 | |
| Gene Type | protein-coding | GO ID | GO:0006915 | UniProtAcc | P0CJ68 |
Top |
Malignant transformation analysis |
| Identification of the aberrant gene expression in precancerous and cancerous lesions by comparing the gene expression of stem-like cells in diseased tissues with normal stem cells |
| Entrez ID | Symbol | Replicates | Species | Organ | Tissue | Adj P-value | Log2FC | Malignancy |
| 100462977 | MTRNR2L1 | HTA11_2487_2000001011 | Human | Colorectum | SER | 3.16e-10 | 3.47e-01 | -0.1808 |
| 100462977 | MTRNR2L1 | HTA11_78_2000001011 | Human | Colorectum | AD | 1.03e-03 | 2.06e-01 | -0.1088 |
| 100462977 | MTRNR2L1 | HTA11_2112_2000001011 | Human | Colorectum | SER | 7.63e-03 | 2.89e-01 | -0.2196 |
| 100462977 | MTRNR2L1 | HTA11_3361_2000001011 | Human | Colorectum | AD | 3.41e-05 | 2.10e-01 | -0.1207 |
| 100462977 | MTRNR2L1 | HTA11_696_2000001011 | Human | Colorectum | AD | 4.65e-06 | 9.23e-02 | -0.1464 |
| 100462977 | MTRNR2L1 | HTA11_866_2000001011 | Human | Colorectum | AD | 3.90e-21 | 3.64e-01 | -0.1001 |
| 100462977 | MTRNR2L1 | HTA11_2992_2000001011 | Human | Colorectum | SER | 6.39e-06 | 4.28e-01 | -0.1706 |
| 100462977 | MTRNR2L1 | HTA11_5212_2000001011 | Human | Colorectum | AD | 1.43e-05 | 3.43e-01 | -0.2061 |
| 100462977 | MTRNR2L1 | HTA11_99999965104_69814 | Human | Colorectum | MSS | 7.48e-34 | 8.70e-01 | 0.281 |
| 100462977 | MTRNR2L1 | HTA11_99999971662_82457 | Human | Colorectum | MSS | 6.50e-04 | 2.29e-02 | 0.3859 |
| 100462977 | MTRNR2L1 | A015-C-203 | Human | Colorectum | FAP | 1.36e-06 | 4.98e-01 | -0.1294 |
| 100462977 | MTRNR2L1 | A015-C-204 | Human | Colorectum | FAP | 4.70e-05 | 4.48e-01 | -0.0228 |
| 100462977 | MTRNR2L1 | A015-C-002 | Human | Colorectum | FAP | 2.37e-09 | 6.78e-01 | -0.0763 |
| 100462977 | MTRNR2L1 | GSM5276934 | Human | Endometrium | EEC | 6.03e-86 | 1.27e+00 | -0.0913 |
| 100462977 | MTRNR2L1 | GSM6177620_NYU_UCEC1_lib2_lib2 | Human | Endometrium | EEC | 1.41e-03 | 3.78e-01 | -0.1875 |
| 100462977 | MTRNR2L1 | GSM6177620_NYU_UCEC1_lib3_lib3 | Human | Endometrium | EEC | 9.28e-04 | 3.83e-01 | -0.1883 |
| 100462977 | MTRNR2L1 | GSM6177621_NYU_UCEC2_lib1_lib1 | Human | Endometrium | EEC | 8.53e-05 | 3.68e-01 | -0.1934 |
| 100462977 | MTRNR2L1 | GSM6177622_NYU_UCEC3_lib1_lib1 | Human | Endometrium | EEC | 1.13e-08 | 4.54e-01 | -0.1917 |
| 100462977 | MTRNR2L1 | GSM6177622_NYU_UCEC3_lib2_lib2 | Human | Endometrium | EEC | 1.60e-02 | 3.00e-01 | -0.1916 |
| 100462977 | MTRNR2L1 | S43 | Human | Liver | Cirrhotic | 2.16e-04 | -1.90e-01 | -0.0187 |
| Page: 1 2 3 4 5 |
| Tissue | Expression Dynamics | Abbreviation |
| Colorectum (GSE201348) | 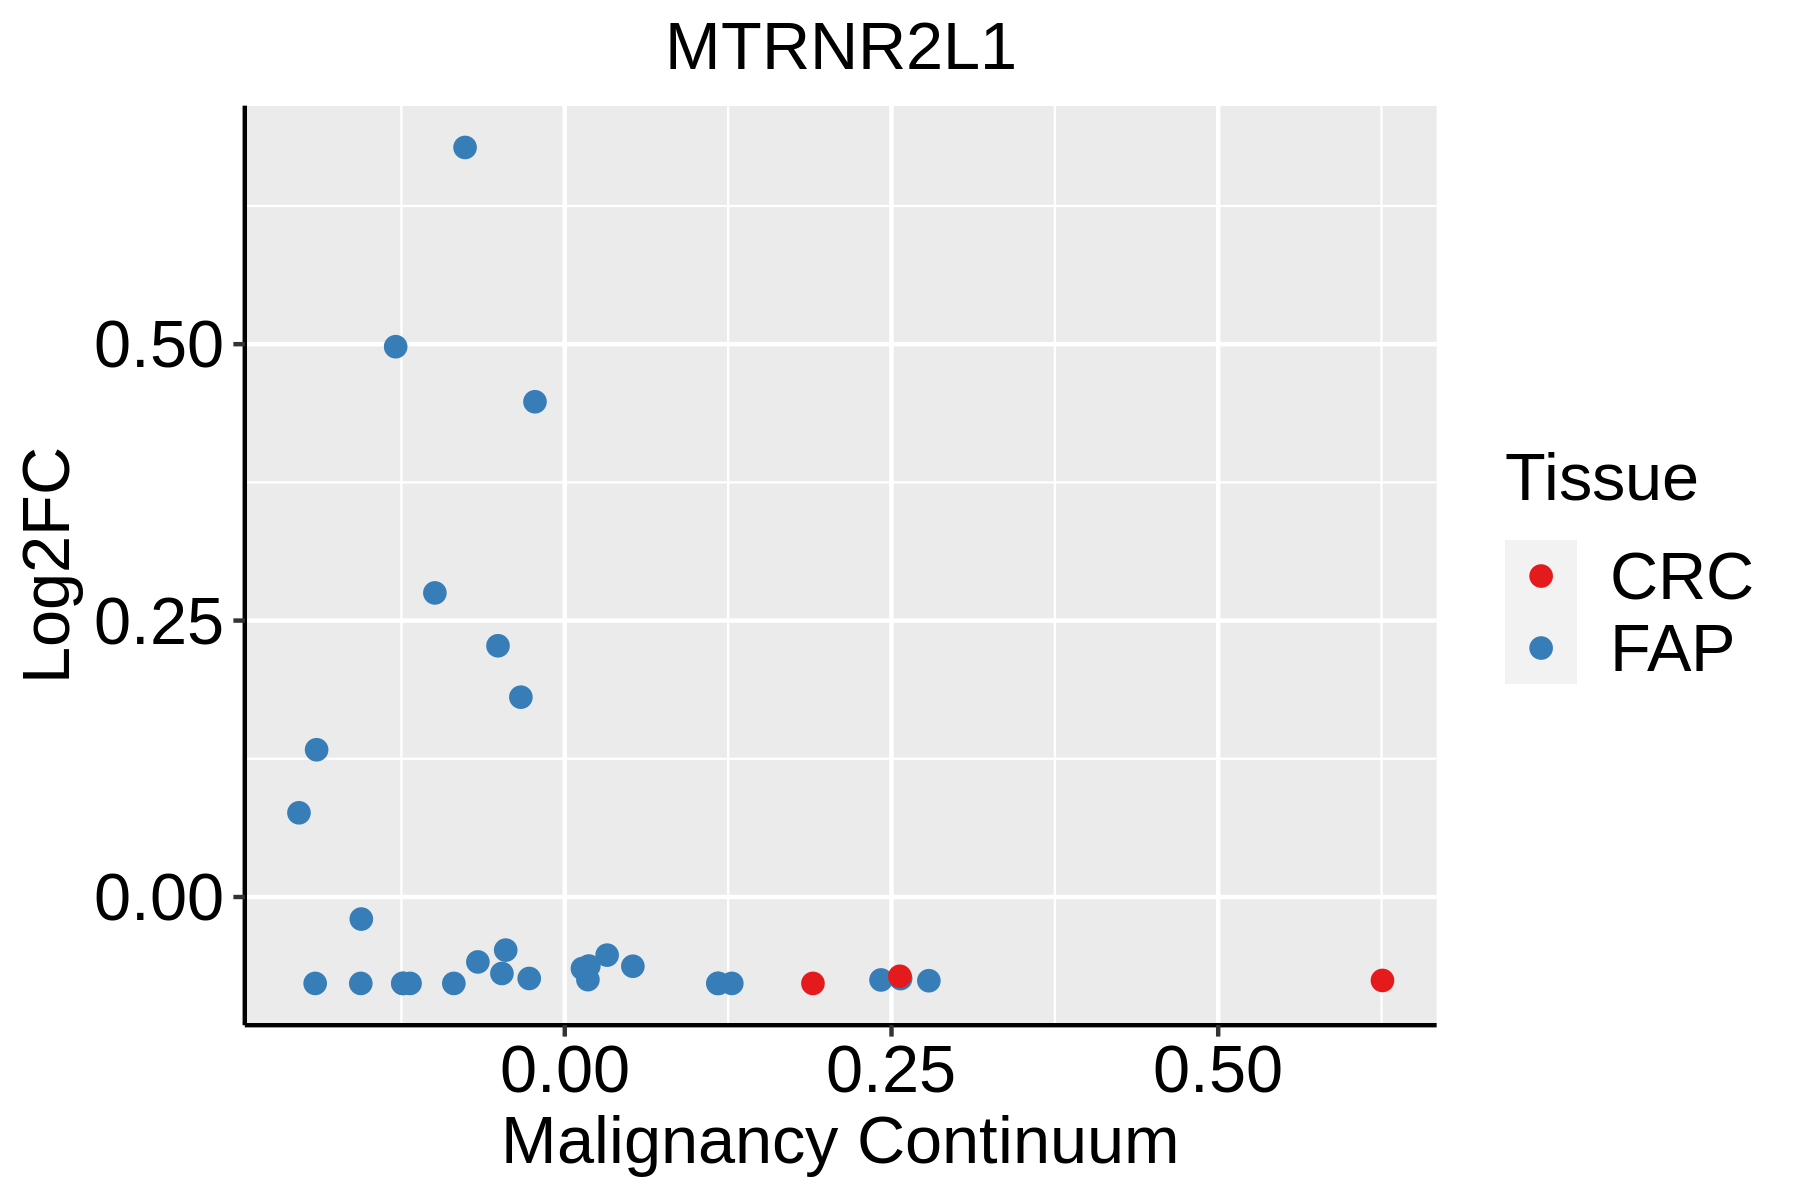 | FAP: Familial adenomatous polyposis |
| CRC: Colorectal cancer | ||
| Colorectum (HTA11) |  | AD: Adenomas |
| SER: Sessile serrated lesions | ||
| MSI-H: Microsatellite-high colorectal cancer | ||
| MSS: Microsatellite stable colorectal cancer | ||
| Endometrium | 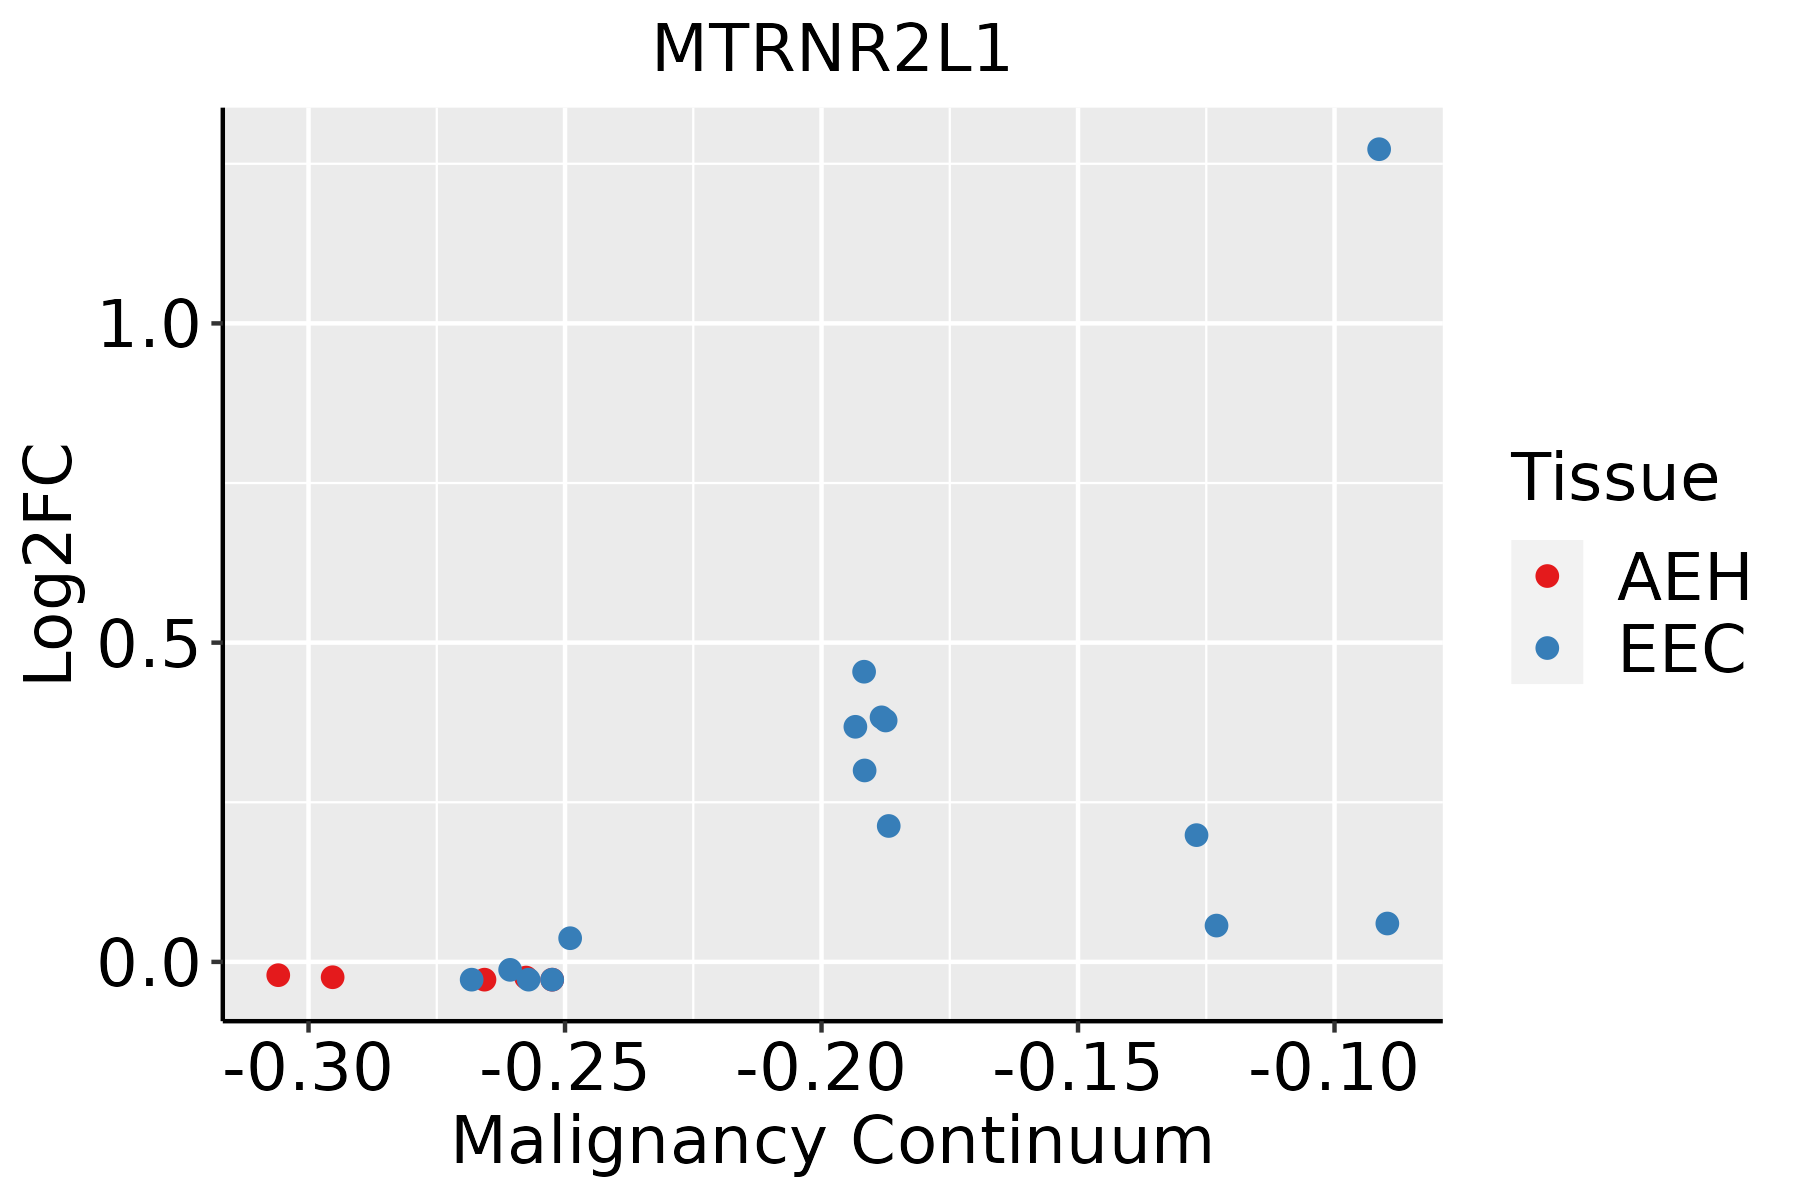 | AEH: Atypical endometrial hyperplasia |
| EEC: Endometrioid Cancer | ||
| GC | 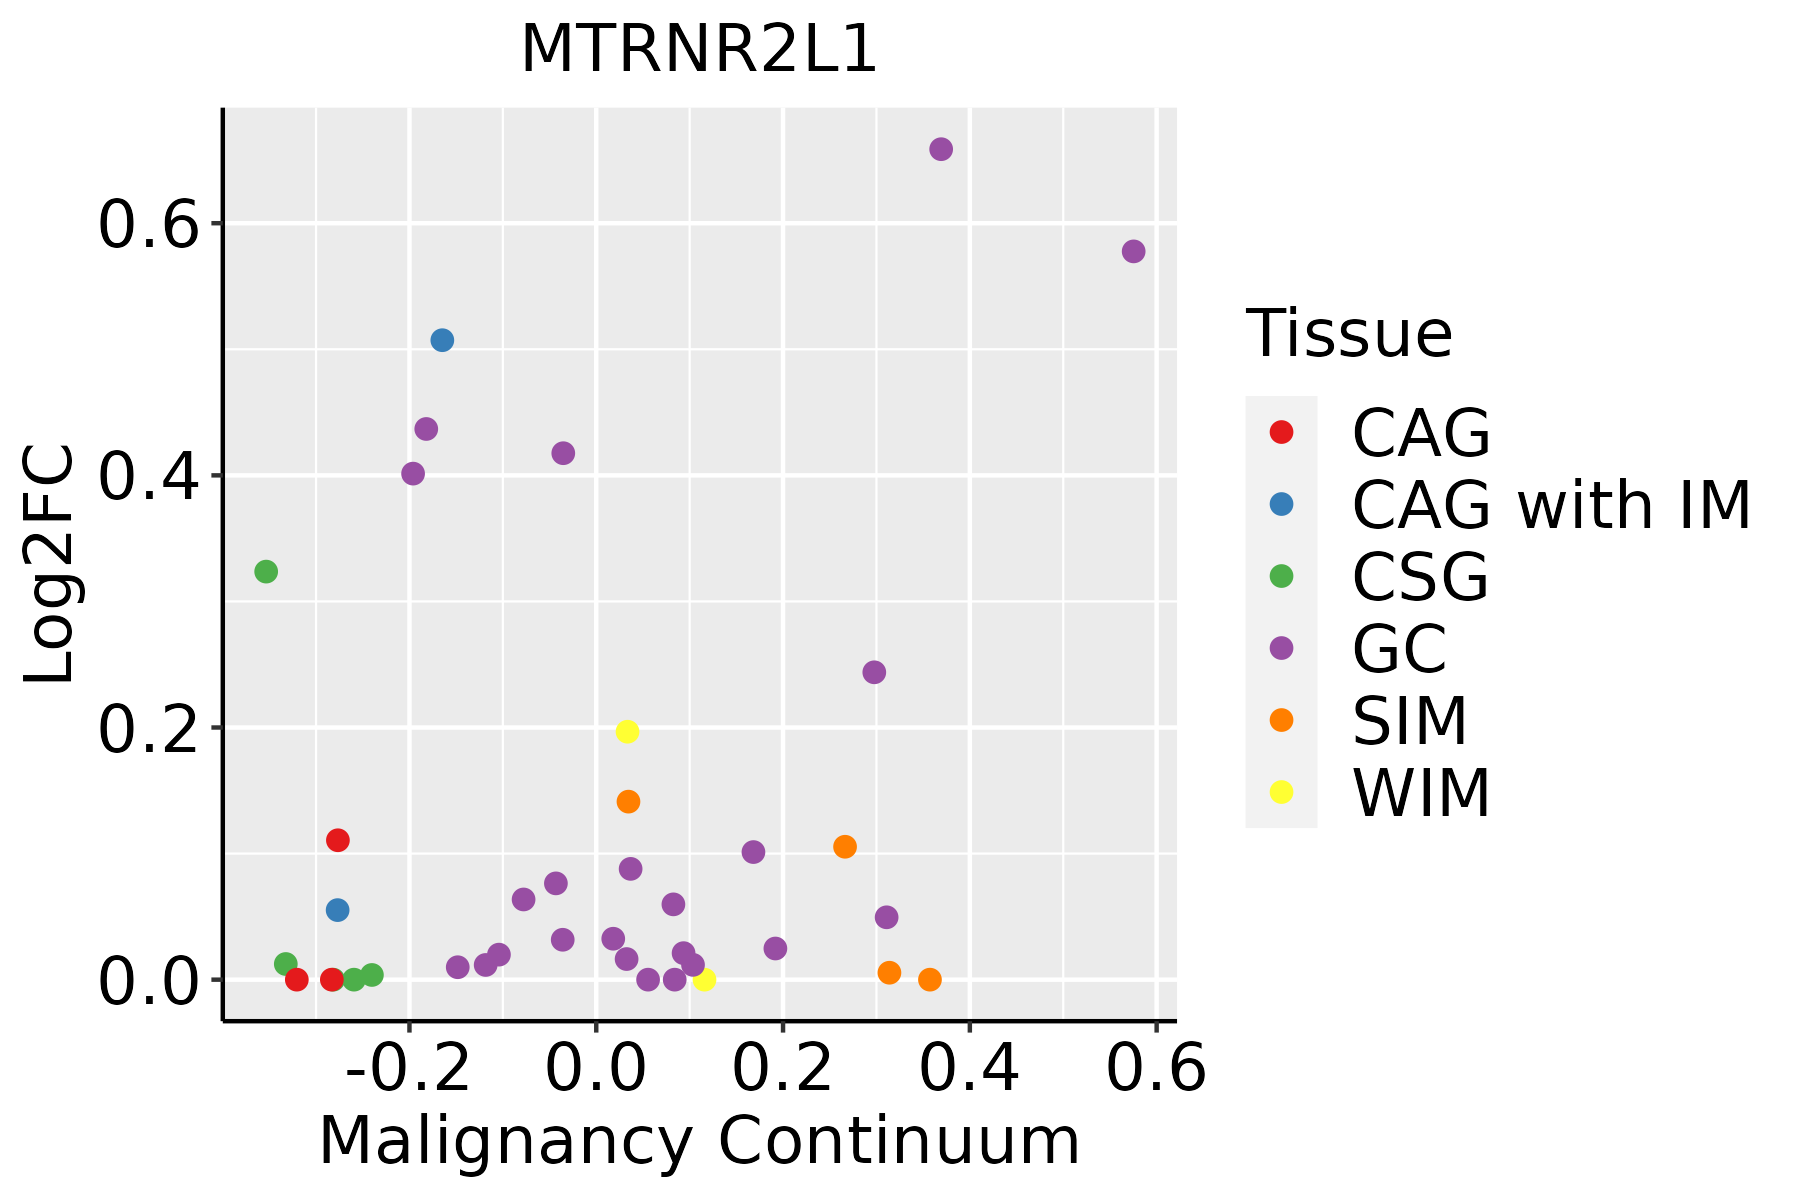 | CAG: Chronic atrophic gastritis |
| CAG with IM: Chronic atrophic gastritis with intestinal metaplasia | ||
| CSG: Chronic superficial gastritis | ||
| GC: Gastric cancer | ||
| SIM: Severe intestinal metaplasia | ||
| WIM: Wild intestinal metaplasia | ||
| Liver |  | HCC: Hepatocellular carcinoma |
| NAFLD: Non-alcoholic fatty liver disease | ||
| Oral Cavity |  | EOLP: Erosive Oral lichen planus |
| LP: leukoplakia | ||
| NEOLP: Non-erosive oral lichen planus | ||
| OSCC: Oral squamous cell carcinoma | ||
| Prostate | 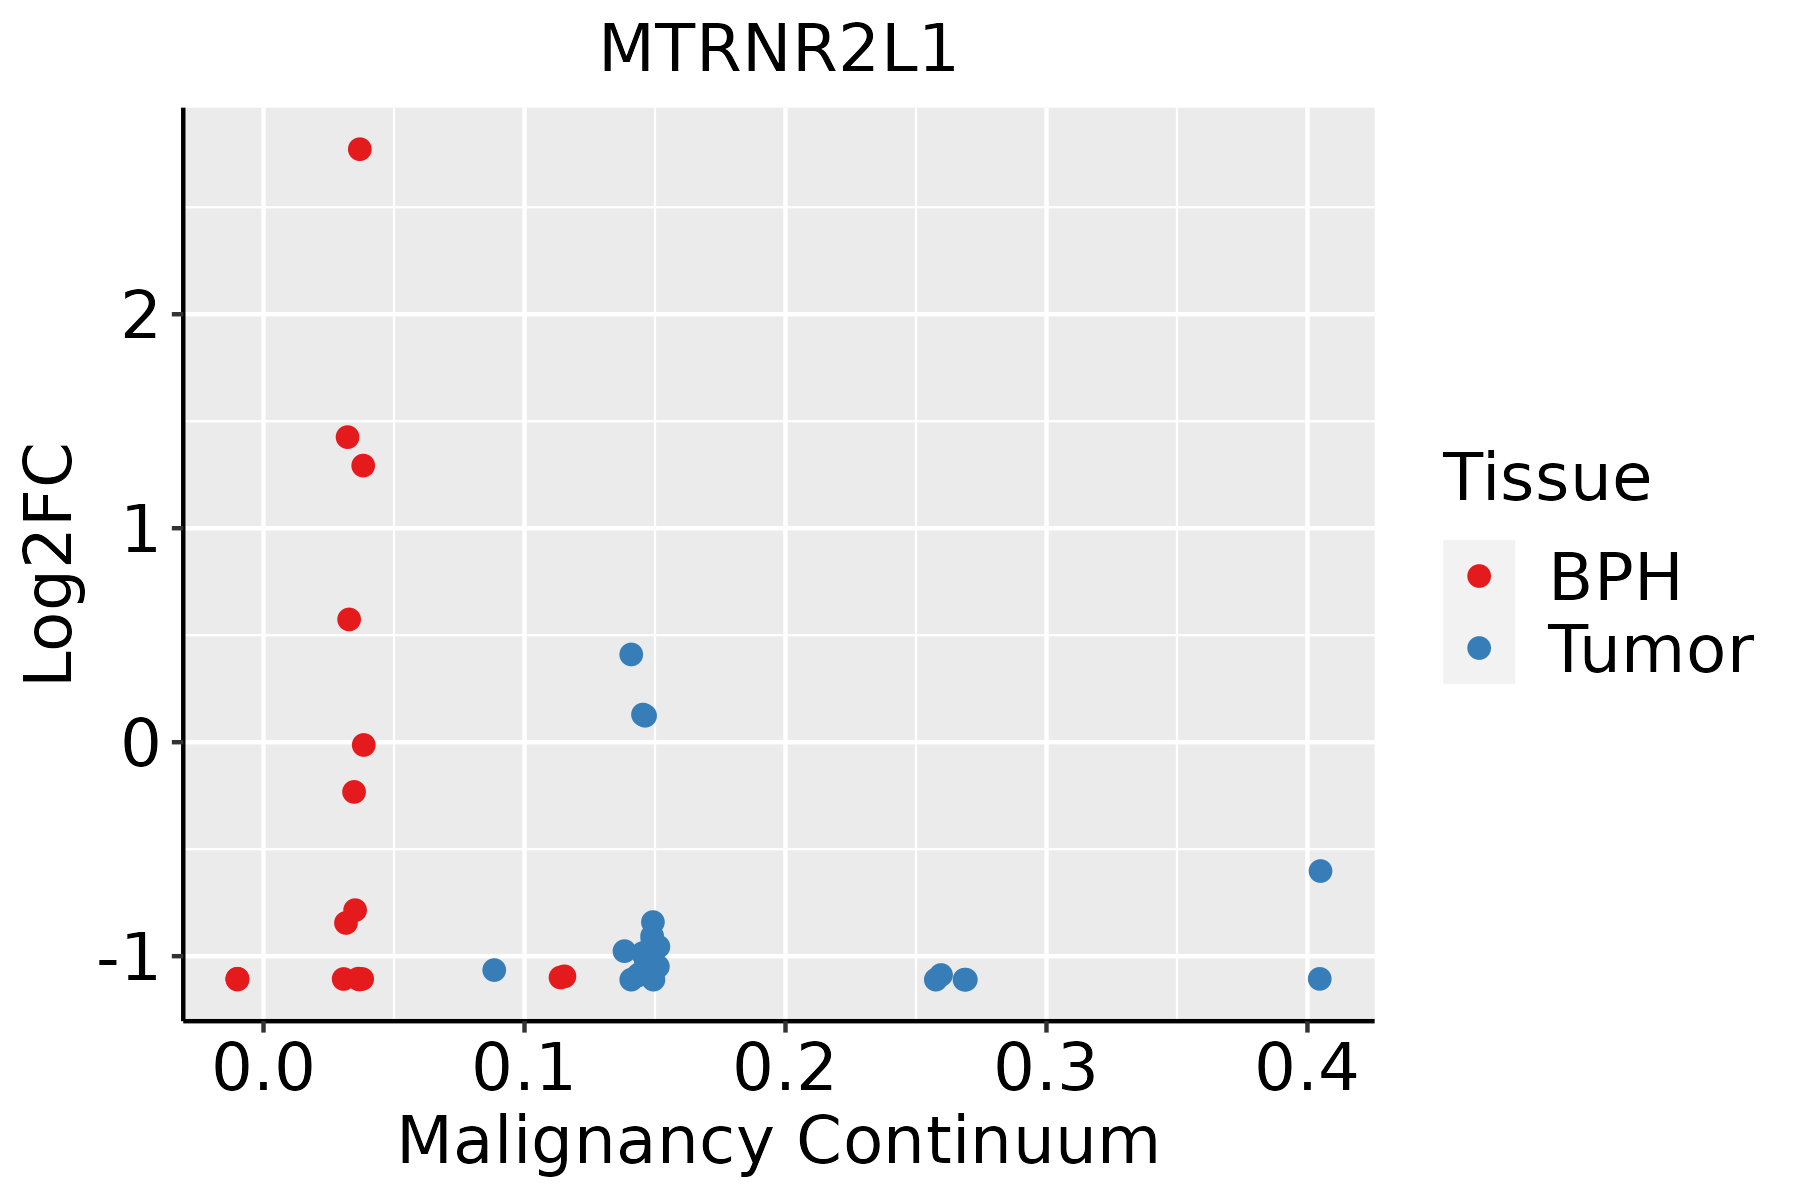 | BPH: Benign Prostatic Hyperplasia |
| Thyroid | 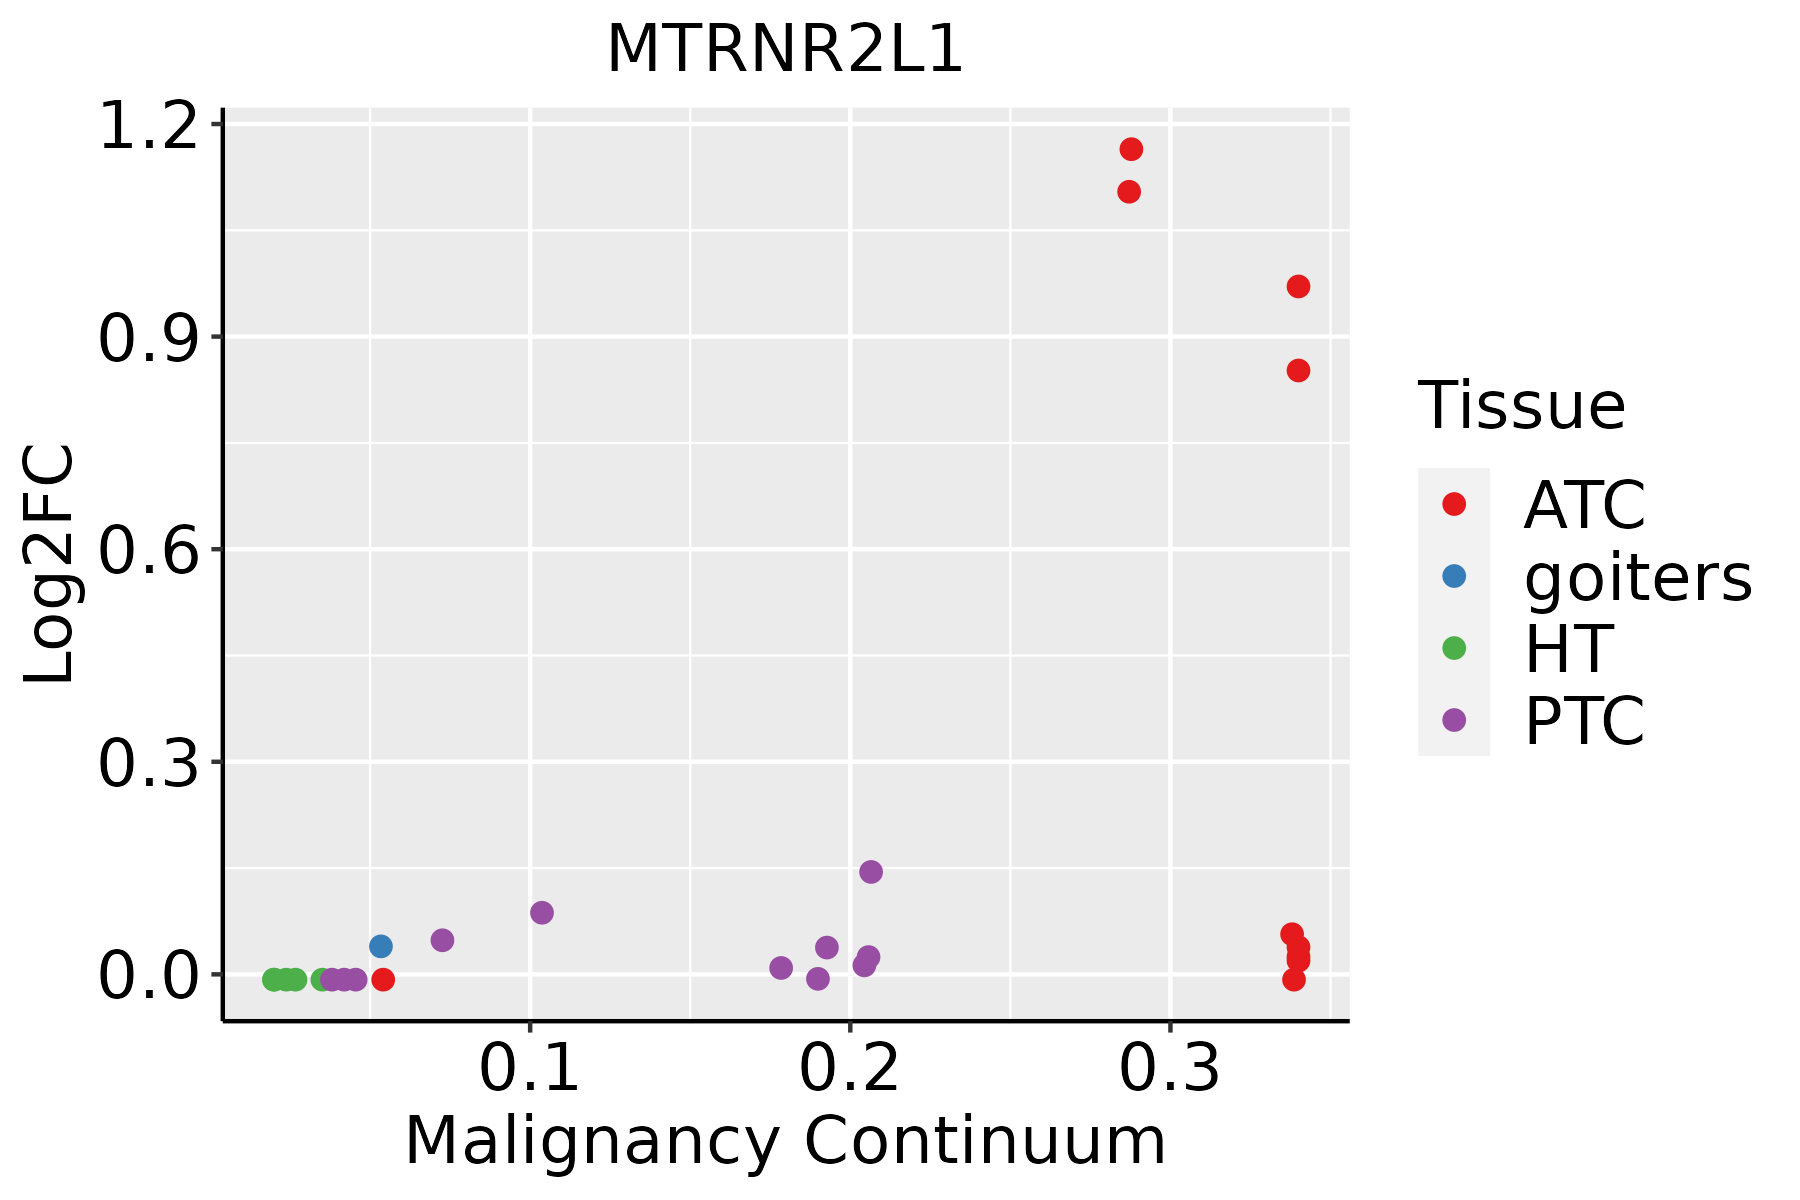 | ATC: Anaplastic thyroid cancer |
| HT: Hashimoto's thyroiditis | ||
| PTC: Papillary thyroid cancer |
| ∗log2FC in expression of this searched gene in stem-like cells from each diseased tissue sample relative to stem-like cells in normal samples in each tissue plotted against the malignancy continuum. Samples are colored based on if they are from different disease stage. |
Top |
Malignant transformation related pathway analysis |
| Find out the enriched GO biological processes and KEGG pathways involved in transition from healthy to precancer to cancer |
| Tissue | Disease Stage | Enriched GO biological Processes |
| Liver | Cyst |  |
| Lung | IAC |  |
| Lung | AIS |  |
| Lung | AAH |  |
| Lung | MIAC |  |
| ∗Top 15 enriched GO BP terms are showed in the bar plot of each disease state in each tissue. Each row represents a significant GO biological process which is colored according to the -log10(p.adjust). |
| Page: 1 2 3 4 5 6 7 8 9 |
| GO ID | Tissue | Disease Stage | Description | Gene Ratio | Bg Ratio | pvalue | p.adjust | Count |
| GO:0097194 | Liver | HCC | execution phase of apoptosis | 48/7958 | 85/18723 | 6.47e-03 | 2.63e-02 | 48 |
| GO:1900117 | Liver | HCC | regulation of execution phase of apoptosis | 19/7958 | 29/18723 | 1.05e-02 | 3.89e-02 | 19 |
| Page: 1 |
| Pathway ID | Tissue | Disease Stage | Description | Gene Ratio | Bg Ratio | pvalue | p.adjust | qvalue | Count |
| Page: 1 |
Top |
Cell-cell communication analysis |
| Identification of potential cell-cell interactions between two cell types and their ligand-receptor pairs for different disease states |
| Ligand | Receptor | LRpair | Pathway | Tissue | Disease Stage |
| Page: 1 |
Top |
Single-cell gene regulatory network inference analysis |
| Find out the significant the regulons (TFs) and the target genes of each regulon across cell types for different disease states |
| TF | Cell Type | Tissue | Disease Stage | Target Gene | RSS | Regulon Activity |
| ∗The dot plots of a searched regulon are shown for all cell subpopulations in each disease state of each tissue based on the regulon specific score inferred using pySCENIC and by calculating the average expression. |
| Page: 1 |
Top |
Somatic mutation of malignant transformation related genes |
| Annotation of somatic variants for genes involved in malignant transformation |
| Hugo Symbol | Variant Class | Variant Classification | dbSNP RS | HGVSc | HGVSp | HGVSp Short | SWISSPROT | BIOTYPE | SIFT | PolyPhen | Tumor Sample Barcode | Tissue | Histology | Sex | Age | Stage | Therapy Types | Drugs | Outcome |
| Page: 1 |
Top |
Related drugs of malignant transformation related genes |
| Identification of chemicals and drugs interact with genes involved in malignant transfromation |
| (DGIdb 4.0) |
| Entrez ID | Symbol | Category | Interaction Types | Drug Claim Name | Drug Name | PMIDs |
| Page: 1 |

Copyright 2023-Present -The University of Texas Health Science Center at Houston |