
|
|||||
|
 | |
| |
| |
| |
| |
| |
|
Gene: ENO2 |
Gene summary for ENO2 |
| Gene information | Species | Human | Gene symbol | ENO2 | Gene ID | 2026 |
| Gene name | enolase 2 | |
| Gene Alias | HEL-S-279 | |
| Cytomap | 12p13.31 | |
| Gene Type | protein-coding | GO ID | GO:0005975 | UniProtAcc | P09104 |
Top |
Malignant transformation analysis |
| Identification of the aberrant gene expression in precancerous and cancerous lesions by comparing the gene expression of stem-like cells in diseased tissues with normal stem cells |
| Entrez ID | Symbol | Replicates | Species | Organ | Tissue | Adj P-value | Log2FC | Malignancy |
| 2026 | ENO2 | GSM4909311 | Human | Breast | IDC | 4.78e-03 | -6.31e-02 | 0.1534 |
| 2026 | ENO2 | GSM4909319 | Human | Breast | IDC | 7.26e-05 | 4.14e-02 | 0.1563 |
| 2026 | ENO2 | ctrl6 | Human | Breast | Precancer | 4.04e-14 | 5.53e-01 | -0.0061 |
| 2026 | ENO2 | brca3 | Human | Breast | Precancer | 9.29e-16 | 3.42e-01 | -0.0263 |
| 2026 | ENO2 | brca7 | Human | Breast | Precancer | 6.56e-06 | 5.98e-01 | -0.009 |
| 2026 | ENO2 | brca10 | Human | Breast | Precancer | 6.76e-08 | 3.39e-01 | -0.0029 |
| 2026 | ENO2 | DCIS2 | Human | Breast | DCIS | 2.92e-03 | -5.64e-02 | 0.0085 |
| 2026 | ENO2 | LZE4T | Human | Esophagus | ESCC | 1.66e-14 | 4.32e-01 | 0.0811 |
| 2026 | ENO2 | LZE7T | Human | Esophagus | ESCC | 1.84e-06 | 2.75e-01 | 0.0667 |
| 2026 | ENO2 | LZE20T | Human | Esophagus | ESCC | 8.23e-03 | 4.11e-01 | 0.0662 |
| 2026 | ENO2 | LZE24T | Human | Esophagus | ESCC | 6.06e-06 | 3.47e-01 | 0.0596 |
| 2026 | ENO2 | LZE6T | Human | Esophagus | ESCC | 3.64e-06 | 4.91e-01 | 0.0845 |
| 2026 | ENO2 | P2T-E | Human | Esophagus | ESCC | 3.37e-04 | 9.39e-02 | 0.1177 |
| 2026 | ENO2 | P4T-E | Human | Esophagus | ESCC | 4.16e-32 | 9.44e-01 | 0.1323 |
| 2026 | ENO2 | P5T-E | Human | Esophagus | ESCC | 2.15e-43 | 8.55e-01 | 0.1327 |
| 2026 | ENO2 | P8T-E | Human | Esophagus | ESCC | 2.23e-07 | 1.43e-01 | 0.0889 |
| 2026 | ENO2 | P9T-E | Human | Esophagus | ESCC | 6.11e-05 | 9.62e-02 | 0.1131 |
| 2026 | ENO2 | P10T-E | Human | Esophagus | ESCC | 6.31e-28 | 6.37e-01 | 0.116 |
| 2026 | ENO2 | P11T-E | Human | Esophagus | ESCC | 6.47e-15 | 3.63e-01 | 0.1426 |
| 2026 | ENO2 | P12T-E | Human | Esophagus | ESCC | 1.39e-38 | 8.46e-01 | 0.1122 |
| Page: 1 2 3 4 5 |
| Tissue | Expression Dynamics | Abbreviation |
| Breast | 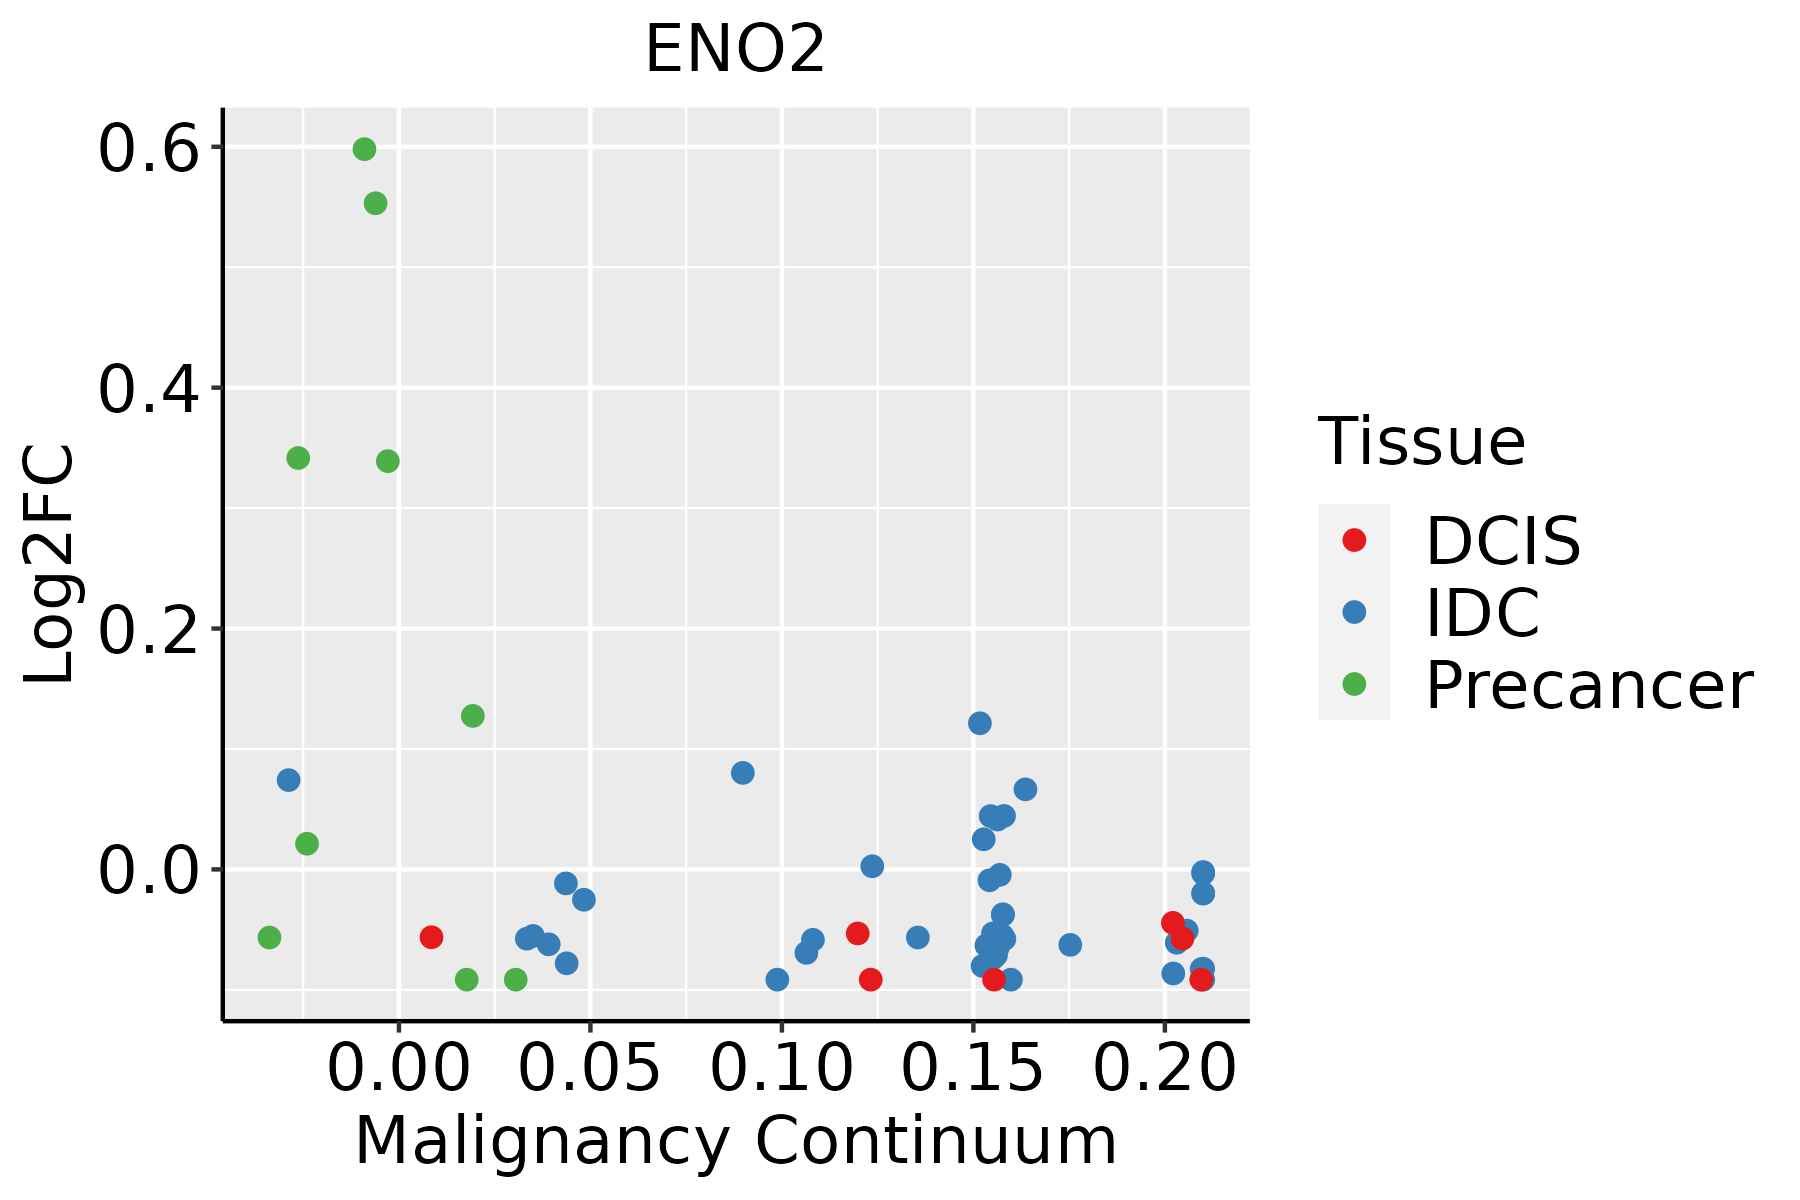 | IDC: Invasive ductal carcinoma |
| DCIS: Ductal carcinoma in situ | ||
| Precancer(BRCA1-mut): Precancerous lesion from BRCA1 mutation carriers | ||
| Esophagus | 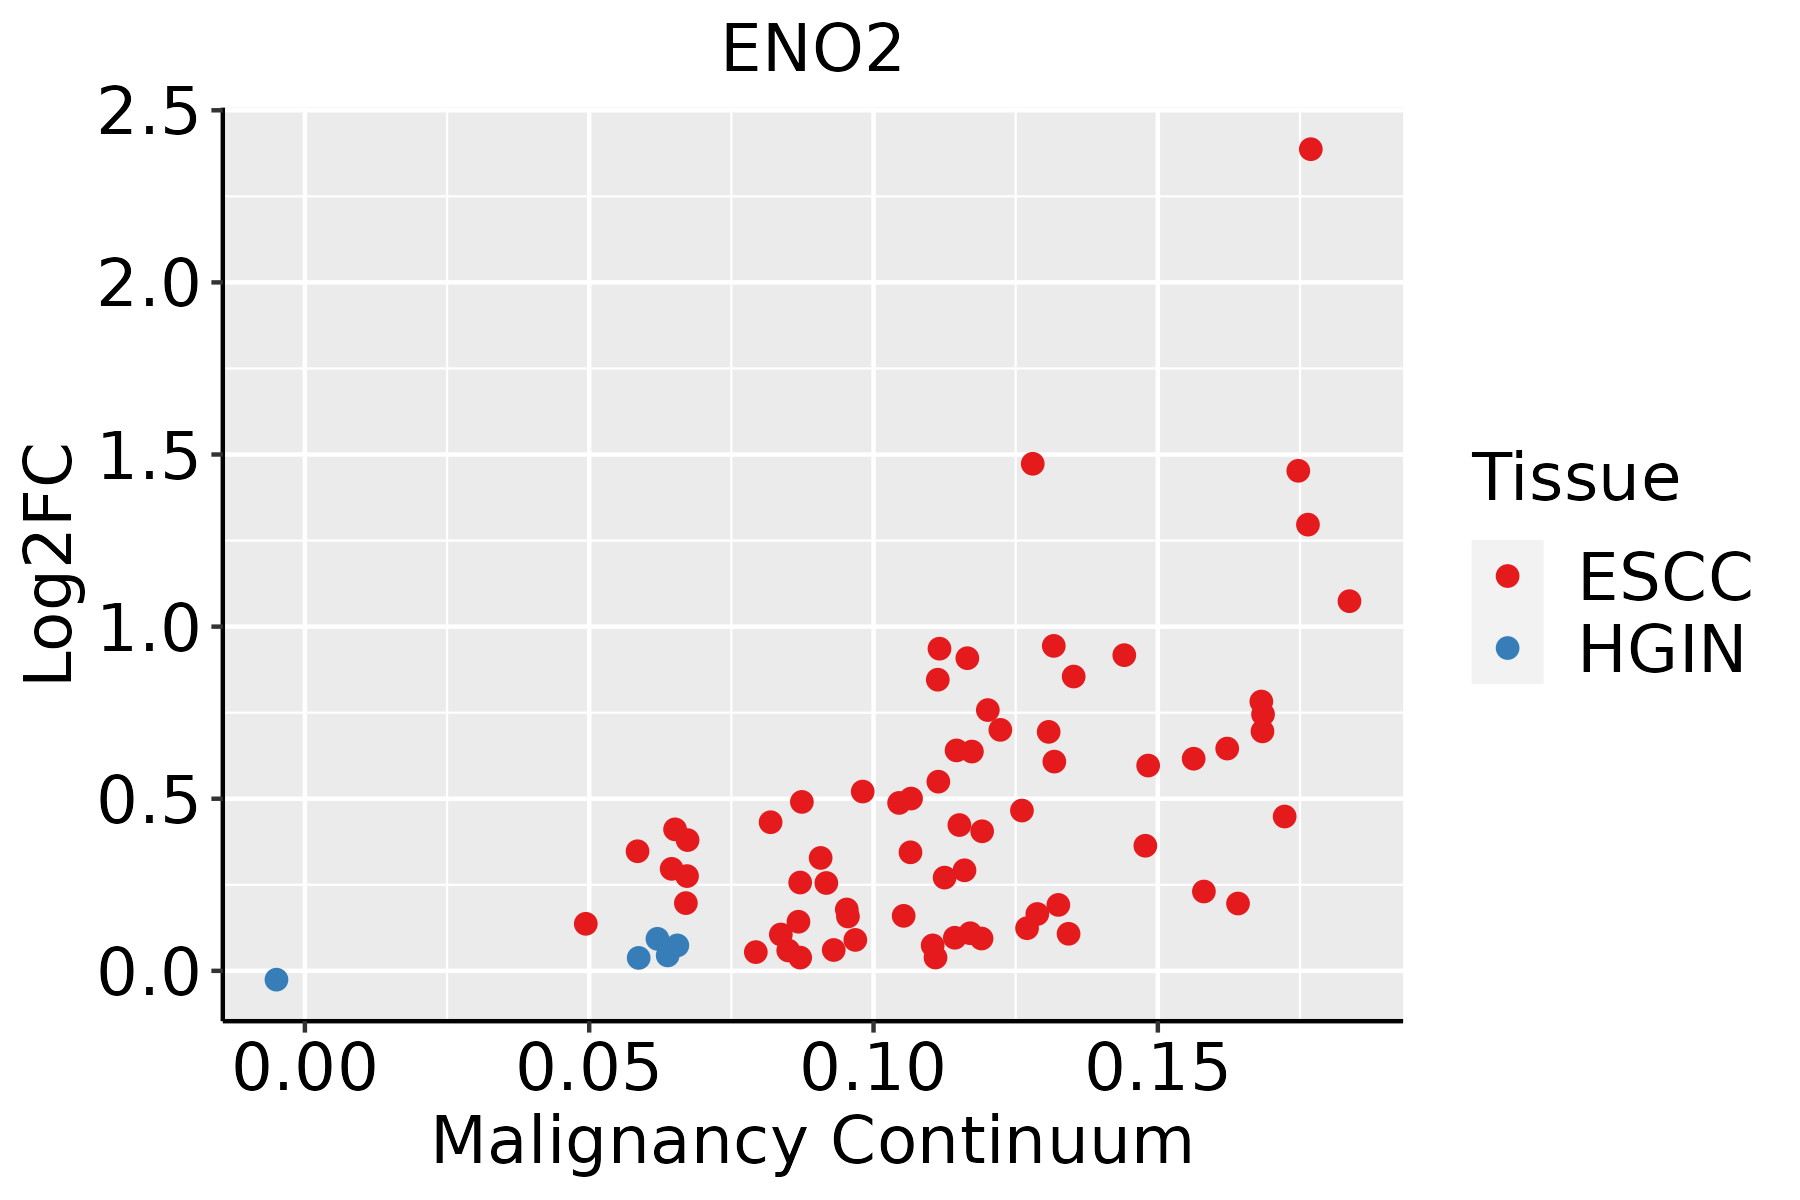 | ESCC: Esophageal squamous cell carcinoma |
| HGIN: High-grade intraepithelial neoplasias | ||
| LGIN: Low-grade intraepithelial neoplasias | ||
| Oral Cavity | 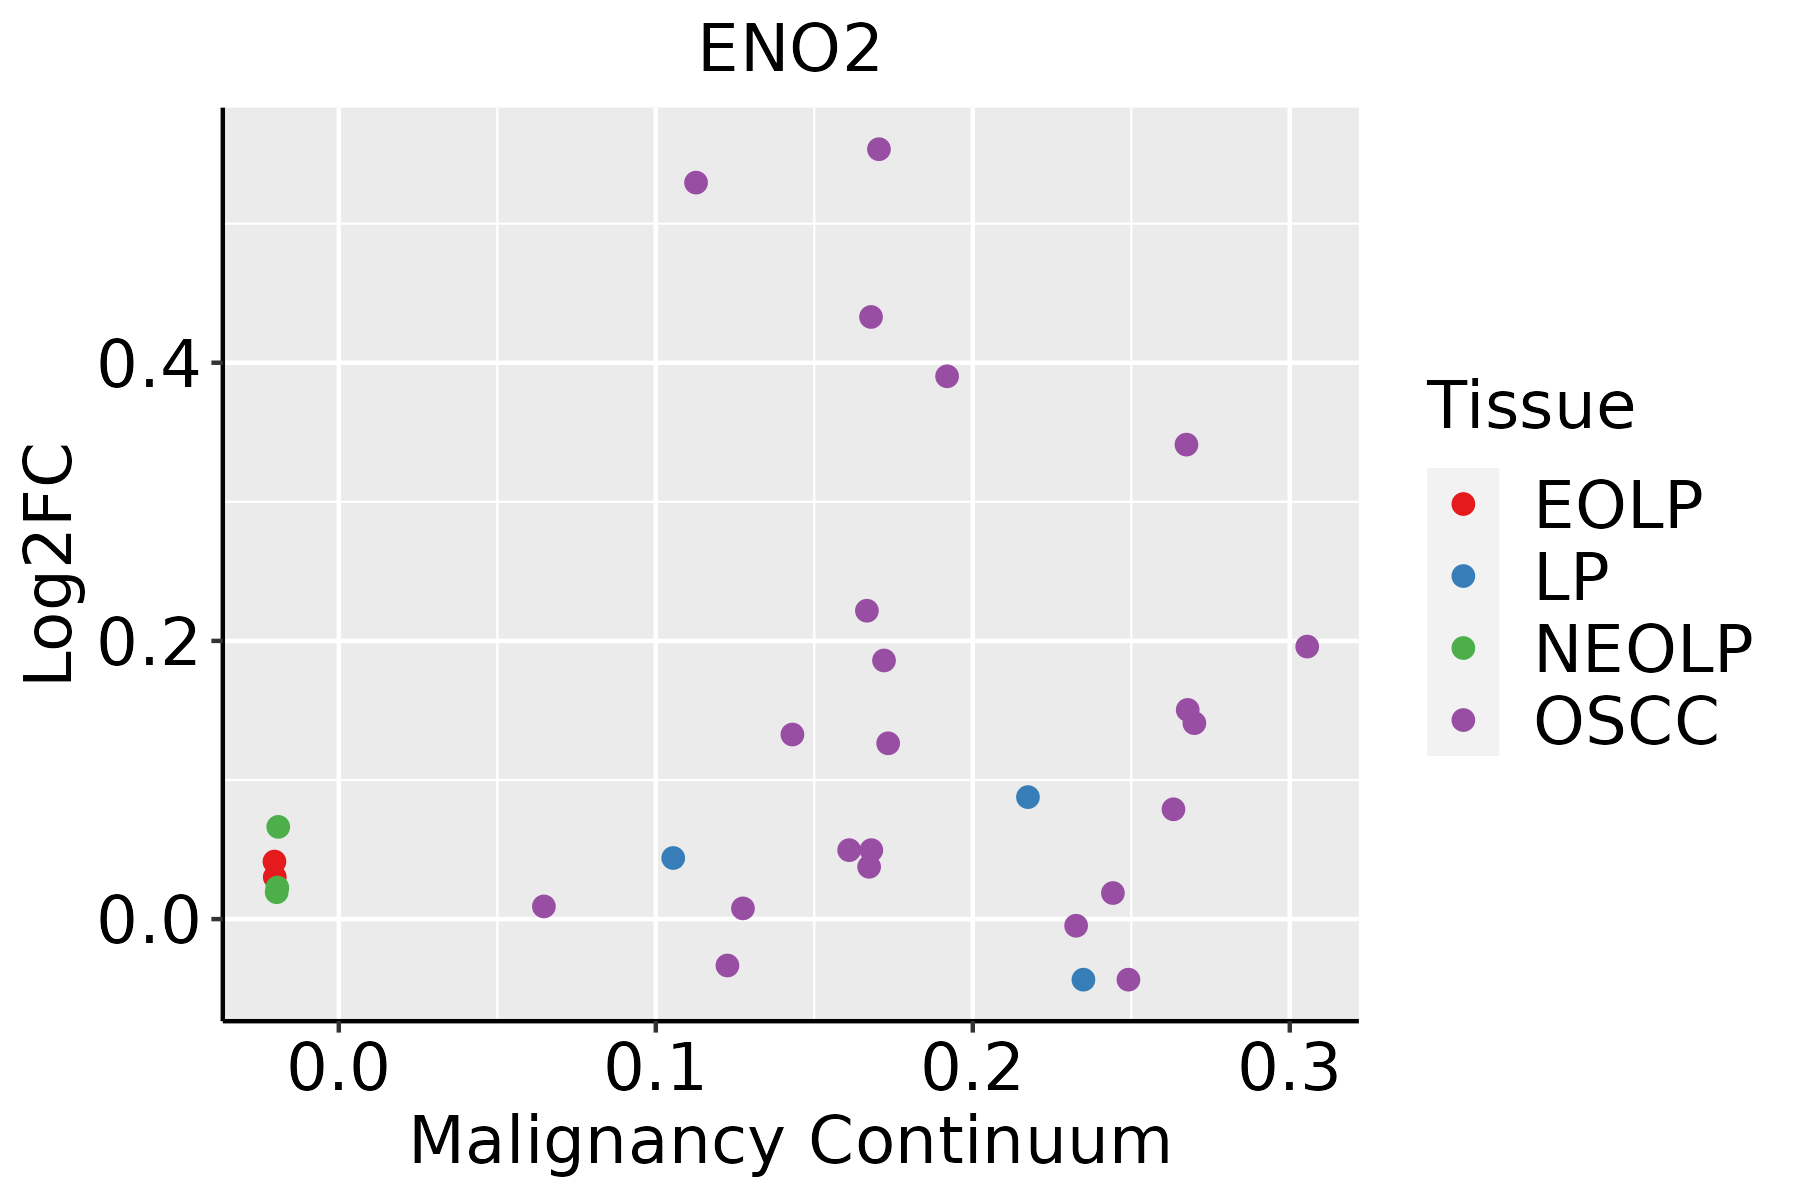 | EOLP: Erosive Oral lichen planus |
| LP: leukoplakia | ||
| NEOLP: Non-erosive oral lichen planus | ||
| OSCC: Oral squamous cell carcinoma | ||
| Thyroid | 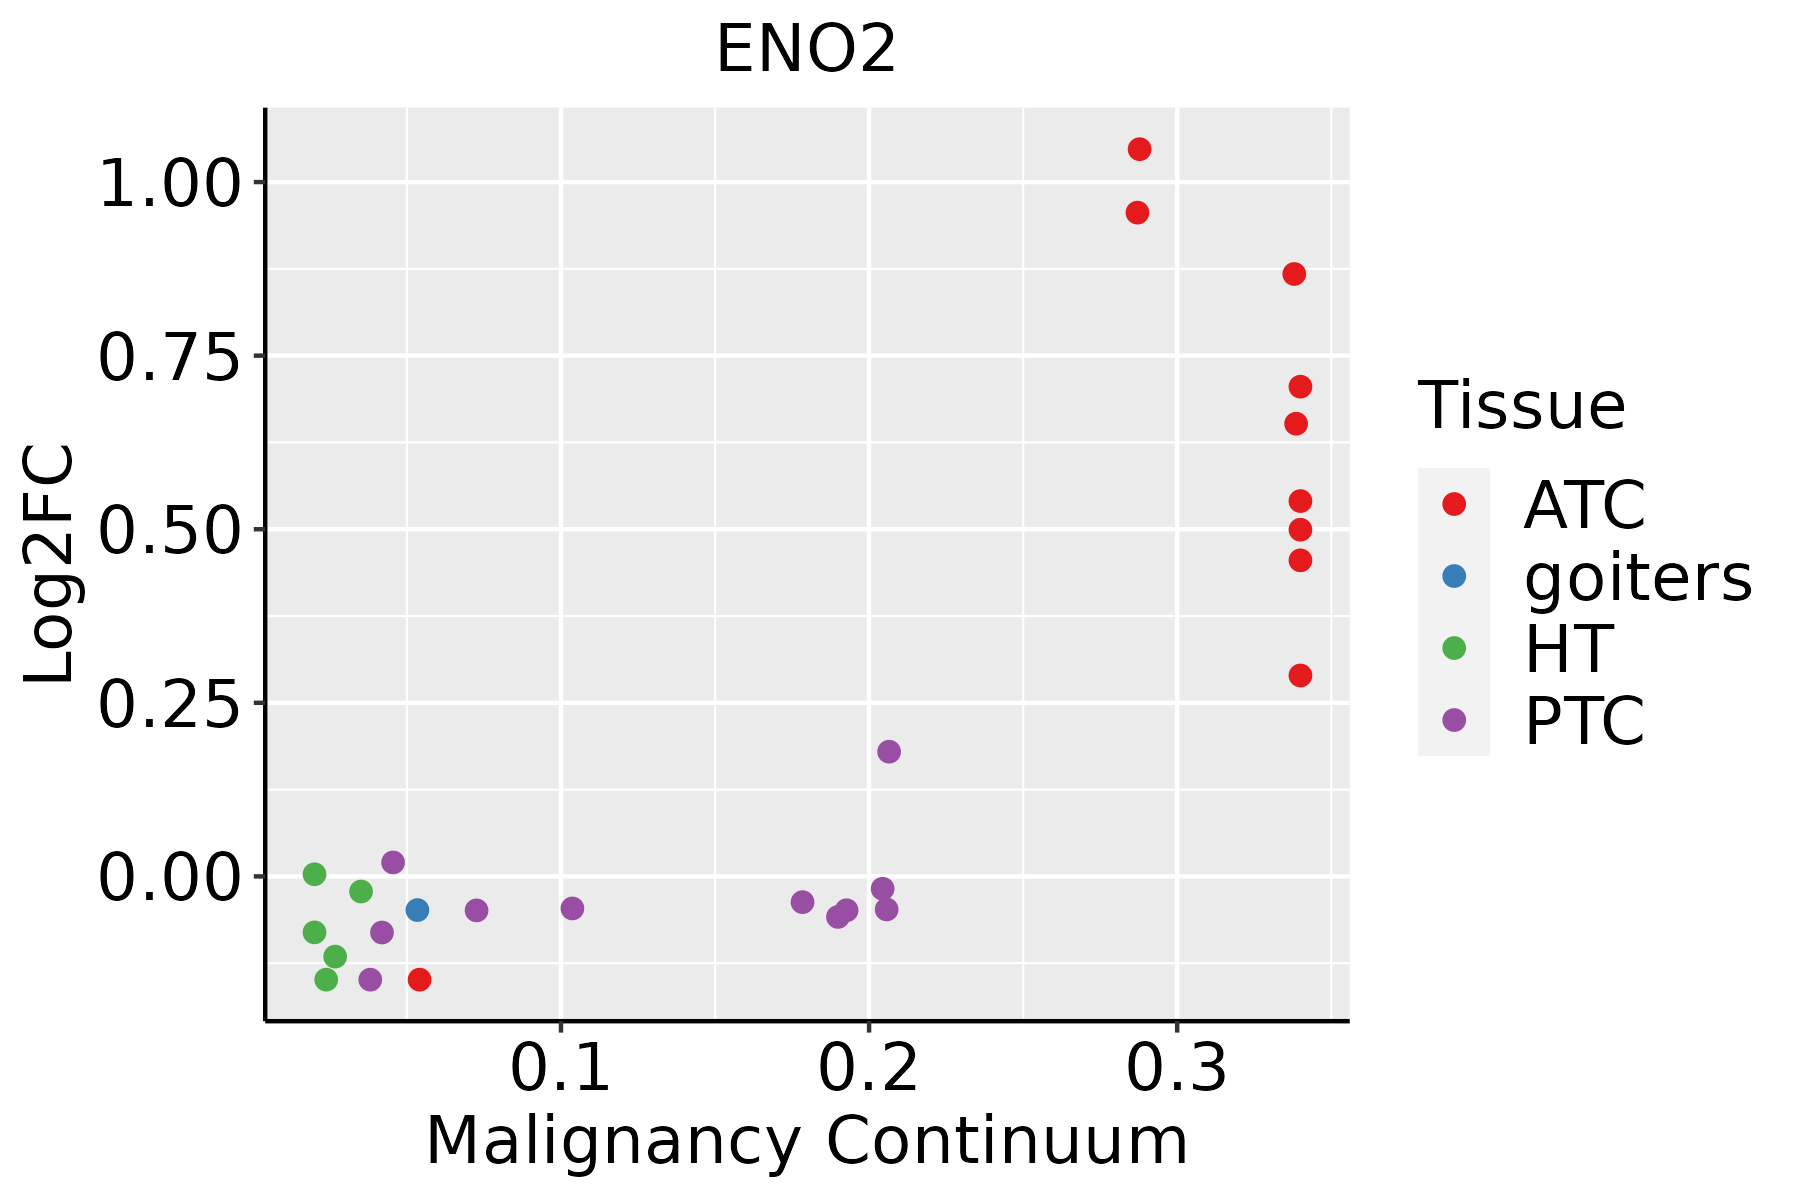 | ATC: Anaplastic thyroid cancer |
| HT: Hashimoto's thyroiditis | ||
| PTC: Papillary thyroid cancer |
| ∗log2FC in expression of this searched gene in stem-like cells from each diseased tissue sample relative to stem-like cells in normal samples in each tissue plotted against the malignancy continuum. Samples are colored based on if they are from different disease stage. |
Top |
Malignant transformation related pathway analysis |
| Find out the enriched GO biological processes and KEGG pathways involved in transition from healthy to precancer to cancer |
| Tissue | Disease Stage | Enriched GO biological Processes |
| Liver | Cyst |  |
| Lung | IAC |  |
| Lung | AIS |  |
| Lung | AAH |  |
| Lung | MIAC |  |
| ∗Top 15 enriched GO BP terms are showed in the bar plot of each disease state in each tissue. Each row represents a significant GO biological process which is colored according to the -log10(p.adjust). |
| Page: 1 2 3 4 5 6 7 8 9 |
| GO ID | Tissue | Disease Stage | Description | Gene Ratio | Bg Ratio | pvalue | p.adjust | Count |
| GO:00460349 | Breast | Precancer | ATP metabolic process | 82/1080 | 277/18723 | 1.94e-36 | 5.19e-33 | 82 |
| GO:00060918 | Breast | Precancer | generation of precursor metabolites and energy | 94/1080 | 490/18723 | 1.54e-25 | 1.64e-22 | 94 |
| GO:00196938 | Breast | Precancer | ribose phosphate metabolic process | 49/1080 | 396/18723 | 3.81e-07 | 1.78e-05 | 49 |
| GO:00091509 | Breast | Precancer | purine ribonucleotide metabolic process | 46/1080 | 368/18723 | 6.47e-07 | 2.71e-05 | 46 |
| GO:00091179 | Breast | Precancer | nucleotide metabolic process | 56/1080 | 489/18723 | 7.40e-07 | 3.00e-05 | 56 |
| GO:00092598 | Breast | Precancer | ribonucleotide metabolic process | 47/1080 | 385/18723 | 9.69e-07 | 3.84e-05 | 47 |
| GO:00469398 | Breast | Precancer | nucleotide phosphorylation | 20/1080 | 101/18723 | 1.07e-06 | 4.18e-05 | 20 |
| GO:00067539 | Breast | Precancer | nucleoside phosphate metabolic process | 56/1080 | 497/18723 | 1.24e-06 | 4.70e-05 | 56 |
| GO:00061639 | Breast | Precancer | purine nucleotide metabolic process | 47/1080 | 396/18723 | 2.14e-06 | 7.50e-05 | 47 |
| GO:00091858 | Breast | Precancer | ribonucleoside diphosphate metabolic process | 20/1080 | 106/18723 | 2.37e-06 | 8.17e-05 | 20 |
| GO:00060968 | Breast | Precancer | glycolytic process | 17/1080 | 81/18723 | 2.94e-06 | 9.73e-05 | 17 |
| GO:00061658 | Breast | Precancer | nucleoside diphosphate phosphorylation | 19/1080 | 99/18723 | 3.23e-06 | 1.05e-04 | 19 |
| GO:00067578 | Breast | Precancer | ATP generation from ADP | 17/1080 | 82/18723 | 3.52e-06 | 1.13e-04 | 17 |
| GO:00091328 | Breast | Precancer | nucleoside diphosphate metabolic process | 21/1080 | 124/18723 | 7.98e-06 | 2.17e-04 | 21 |
| GO:00725219 | Breast | Precancer | purine-containing compound metabolic process | 47/1080 | 416/18723 | 8.19e-06 | 2.20e-04 | 47 |
| GO:00460318 | Breast | Precancer | ADP metabolic process | 17/1080 | 90/18723 | 1.31e-05 | 3.30e-04 | 17 |
| GO:00091359 | Breast | Precancer | purine nucleoside diphosphate metabolic process | 18/1080 | 103/18723 | 2.24e-05 | 5.20e-04 | 18 |
| GO:00091799 | Breast | Precancer | purine ribonucleoside diphosphate metabolic process | 18/1080 | 103/18723 | 2.24e-05 | 5.20e-04 | 18 |
| GO:00060908 | Breast | Precancer | pyruvate metabolic process | 18/1080 | 106/18723 | 3.35e-05 | 7.29e-04 | 18 |
| GO:00160527 | Breast | Precancer | carbohydrate catabolic process | 21/1080 | 154/18723 | 2.10e-04 | 3.28e-03 | 21 |
| Page: 1 2 3 4 5 6 7 |
| Pathway ID | Tissue | Disease Stage | Description | Gene Ratio | Bg Ratio | pvalue | p.adjust | qvalue | Count |
| hsa0406616 | Breast | Precancer | HIF-1 signaling pathway | 23/684 | 109/8465 | 1.51e-05 | 1.59e-04 | 1.22e-04 | 23 |
| hsa0001010 | Breast | Precancer | Glycolysis / Gluconeogenesis | 13/684 | 67/8465 | 2.39e-03 | 1.51e-02 | 1.16e-02 | 13 |
| hsa030186 | Breast | Precancer | RNA degradation | 14/684 | 79/8465 | 3.97e-03 | 2.37e-02 | 1.81e-02 | 14 |
| hsa0120012 | Breast | Precancer | Carbon metabolism | 18/684 | 115/8465 | 4.79e-03 | 2.75e-02 | 2.11e-02 | 18 |
| hsa0406617 | Breast | Precancer | HIF-1 signaling pathway | 23/684 | 109/8465 | 1.51e-05 | 1.59e-04 | 1.22e-04 | 23 |
| hsa0001013 | Breast | Precancer | Glycolysis / Gluconeogenesis | 13/684 | 67/8465 | 2.39e-03 | 1.51e-02 | 1.16e-02 | 13 |
| hsa0301811 | Breast | Precancer | RNA degradation | 14/684 | 79/8465 | 3.97e-03 | 2.37e-02 | 1.81e-02 | 14 |
| hsa0120013 | Breast | Precancer | Carbon metabolism | 18/684 | 115/8465 | 4.79e-03 | 2.75e-02 | 2.11e-02 | 18 |
| hsa0406642 | Breast | DCIS | HIF-1 signaling pathway | 22/846 | 109/8465 | 9.83e-04 | 7.05e-03 | 5.20e-03 | 22 |
| hsa0406652 | Breast | DCIS | HIF-1 signaling pathway | 22/846 | 109/8465 | 9.83e-04 | 7.05e-03 | 5.20e-03 | 22 |
| hsa0301824 | Esophagus | ESCC | RNA degradation | 62/4205 | 79/8465 | 1.18e-07 | 9.39e-07 | 4.81e-07 | 62 |
| hsa0120023 | Esophagus | ESCC | Carbon metabolism | 79/4205 | 115/8465 | 2.50e-05 | 1.21e-04 | 6.22e-05 | 79 |
| hsa0406629 | Esophagus | ESCC | HIF-1 signaling pathway | 75/4205 | 109/8465 | 3.66e-05 | 1.68e-04 | 8.60e-05 | 75 |
| hsa0123023 | Esophagus | ESCC | Biosynthesis of amino acids | 49/4205 | 75/8465 | 4.35e-03 | 1.12e-02 | 5.74e-03 | 49 |
| hsa0001016 | Esophagus | ESCC | Glycolysis / Gluconeogenesis | 42/4205 | 67/8465 | 2.15e-02 | 4.78e-02 | 2.45e-02 | 42 |
| hsa0301834 | Esophagus | ESCC | RNA degradation | 62/4205 | 79/8465 | 1.18e-07 | 9.39e-07 | 4.81e-07 | 62 |
| hsa0120033 | Esophagus | ESCC | Carbon metabolism | 79/4205 | 115/8465 | 2.50e-05 | 1.21e-04 | 6.22e-05 | 79 |
| hsa04066113 | Esophagus | ESCC | HIF-1 signaling pathway | 75/4205 | 109/8465 | 3.66e-05 | 1.68e-04 | 8.60e-05 | 75 |
| hsa0123033 | Esophagus | ESCC | Biosynthesis of amino acids | 49/4205 | 75/8465 | 4.35e-03 | 1.12e-02 | 5.74e-03 | 49 |
| hsa0001017 | Esophagus | ESCC | Glycolysis / Gluconeogenesis | 42/4205 | 67/8465 | 2.15e-02 | 4.78e-02 | 2.45e-02 | 42 |
| Page: 1 2 |
Top |
Cell-cell communication analysis |
| Identification of potential cell-cell interactions between two cell types and their ligand-receptor pairs for different disease states |
| Ligand | Receptor | LRpair | Pathway | Tissue | Disease Stage |
| Page: 1 |
Top |
Single-cell gene regulatory network inference analysis |
| Find out the significant the regulons (TFs) and the target genes of each regulon across cell types for different disease states |
| TF | Cell Type | Tissue | Disease Stage | Target Gene | RSS | Regulon Activity |
| ∗The dot plots of a searched regulon are shown for all cell subpopulations in each disease state of each tissue based on the regulon specific score inferred using pySCENIC and by calculating the average expression. |
| Page: 1 |
Top |
Somatic mutation of malignant transformation related genes |
| Annotation of somatic variants for genes involved in malignant transformation |
| Hugo Symbol | Variant Class | Variant Classification | dbSNP RS | HGVSc | HGVSp | HGVSp Short | SWISSPROT | BIOTYPE | SIFT | PolyPhen | Tumor Sample Barcode | Tissue | Histology | Sex | Age | Stage | Therapy Types | Drugs | Outcome |
| ENO2 | SNV | Missense_Mutation | novel | c.1140N>A | p.Phe380Leu | p.F380L | P09104 | protein_coding | deleterious_low_confidence(0.01) | possibly_damaging(0.849) | TCGA-A2-A0YK-01 | Breast | breast invasive carcinoma | Female | <65 | I/II | Chemotherapy | cytoxan | SD |
| ENO2 | SNV | Missense_Mutation | novel | c.46N>A | p.Gly16Arg | p.G16R | P09104 | protein_coding | deleterious_low_confidence(0) | probably_damaging(0.999) | TCGA-2W-A8YY-01 | Cervix | cervical & endocervical cancer | Female | <65 | I/II | Chemotherapy | cisplatin | CR |
| ENO2 | SNV | Missense_Mutation | rs781991731 | c.220N>A | p.Ala74Thr | p.A74T | P09104 | protein_coding | deleterious_low_confidence(0.01) | benign(0.217) | TCGA-2W-A8YY-01 | Cervix | cervical & endocervical cancer | Female | <65 | I/II | Chemotherapy | cisplatin | CR |
| ENO2 | SNV | Missense_Mutation | novel | c.176G>A | p.Gly59Asp | p.G59D | P09104 | protein_coding | deleterious_low_confidence(0) | probably_damaging(0.999) | TCGA-AA-3947-01 | Colorectum | colon adenocarcinoma | Female | <65 | I/II | Unknown | Unknown | SD |
| ENO2 | SNV | Missense_Mutation | rs781871089 | c.1067N>T | p.Ala356Val | p.A356V | P09104 | protein_coding | deleterious_low_confidence(0.05) | benign(0.192) | TCGA-CK-6746-01 | Colorectum | colon adenocarcinoma | Female | >=65 | I/II | Unknown | Unknown | SD |
| ENO2 | SNV | Missense_Mutation | rs151259229 | c.758N>A | p.Arg253His | p.R253H | P09104 | protein_coding | deleterious_low_confidence(0.03) | benign(0.035) | TCGA-AG-3731-01 | Colorectum | rectum adenocarcinoma | Male | >=65 | III/IV | Chemotherapy | folinic | PR |
| ENO2 | SNV | Missense_Mutation | c.196G>A | p.Val66Met | p.V66M | P09104 | protein_coding | deleterious_low_confidence(0) | probably_damaging(0.992) | TCGA-A5-A0VQ-01 | Endometrium | uterine corpus endometrioid carcinoma | Female | <65 | I/II | Chemotherapy | carboplatin | SD | |
| ENO2 | SNV | Missense_Mutation | rs373556957 | c.980N>A | p.Arg327His | p.R327H | P09104 | protein_coding | deleterious_low_confidence(0.03) | probably_damaging(0.988) | TCGA-AJ-A3BH-01 | Endometrium | uterine corpus endometrioid carcinoma | Female | Unknown | I/II | Unknown | Unknown | SD |
| ENO2 | SNV | Missense_Mutation | novel | c.635N>A | p.Gly212Asp | p.G212D | P09104 | protein_coding | deleterious_low_confidence(0) | probably_damaging(0.987) | TCGA-AP-A059-01 | Endometrium | uterine corpus endometrioid carcinoma | Female | >=65 | I/II | Unknown | Unknown | SD |
| ENO2 | SNV | Missense_Mutation | c.13N>C | p.Lys5Gln | p.K5Q | P09104 | protein_coding | tolerated_low_confidence(0.06) | benign(0.153) | TCGA-AP-A0LM-01 | Endometrium | uterine corpus endometrioid carcinoma | Female | <65 | III/IV | Chemotherapy | cisplatin | SD |
| Page: 1 2 3 |
Top |
Related drugs of malignant transformation related genes |
| Identification of chemicals and drugs interact with genes involved in malignant transfromation |
| (DGIdb 4.0) |
| Entrez ID | Symbol | Category | Interaction Types | Drug Claim Name | Drug Name | PMIDs |
| 2026 | ENO2 | CELL SURFACE | NERVE GROWTH FACTOR | 6793214 | ||
| 2026 | ENO2 | CELL SURFACE | INDOMETHACIN | INDOMETHACIN | 12711954 | |
| 2026 | ENO2 | CELL SURFACE | SODIUM BUTYRATE | 7276941 | ||
| 2026 | ENO2 | CELL SURFACE | STREPTOZOTOCIN | STREPTOZOCIN | 2146046 | |
| 2026 | ENO2 | CELL SURFACE | INSULIN | INSULIN | 7276941 | |
| 2026 | ENO2 | CELL SURFACE | GABAPENTIN | GABAPENTIN | 15780189 | |
| 2026 | ENO2 | CELL SURFACE | FLOXURIDINE | FLOXURIDINE | 2146046 | |
| 2026 | ENO2 | CELL SURFACE | FENRETINIDE | FENRETINIDE | 17110918 | |
| 2026 | ENO2 | CELL SURFACE | TRIIODOTHYRONINE | LIOTHYRONINE SODIUM | 3455610 | |
| 2026 | ENO2 | CELL SURFACE | PROPOFOL | PROPOFOL | 16027086 |
| Page: 1 |

Copyright 2023-Present -The University of Texas Health Science Center at Houston |