
|
|||||
|
 | |
| |
| |
| |
| |
| |
|
Gene: COL5A3 |
Gene summary for COL5A3 |
| Gene information | Species | Human | Gene symbol | COL5A3 | Gene ID | 50509 |
| Gene name | collagen type V alpha 3 chain | |
| Gene Alias | COL5A3 | |
| Cytomap | 19p13.2 | |
| Gene Type | protein-coding | GO ID | GO:0007155 | UniProtAcc | P25940 |
Top |
Malignant transformation analysis |
| Identification of the aberrant gene expression in precancerous and cancerous lesions by comparing the gene expression of stem-like cells in diseased tissues with normal stem cells |
| Entrez ID | Symbol | Replicates | Species | Organ | Tissue | Adj P-value | Log2FC | Malignancy |
| 50509 | COL5A3 | P9T-E | Human | Esophagus | ESCC | 2.30e-02 | 1.72e-01 | 0.1131 |
| 50509 | COL5A3 | P19T-E | Human | Esophagus | ESCC | 7.48e-03 | 4.59e-01 | 0.1662 |
| 50509 | COL5A3 | P24T-E | Human | Esophagus | ESCC | 2.23e-03 | 2.57e-01 | 0.1287 |
| 50509 | COL5A3 | P32T-E | Human | Esophagus | ESCC | 1.40e-10 | 4.70e-01 | 0.1666 |
| 50509 | COL5A3 | P36T-E | Human | Esophagus | ESCC | 2.82e-02 | 1.14e-01 | 0.1187 |
| 50509 | COL5A3 | P37T-E | Human | Esophagus | ESCC | 1.24e-21 | 5.57e-01 | 0.1371 |
| 50509 | COL5A3 | P44T-E | Human | Esophagus | ESCC | 2.29e-03 | 2.03e-01 | 0.1096 |
| 50509 | COL5A3 | P83T-E | Human | Esophagus | ESCC | 1.82e-04 | 2.01e-01 | 0.1738 |
| 50509 | COL5A3 | P91T-E | Human | Esophagus | ESCC | 1.76e-08 | 7.74e-01 | 0.1828 |
| 50509 | COL5A3 | P107T-E | Human | Esophagus | ESCC | 8.09e-05 | 1.78e-01 | 0.171 |
| 50509 | COL5A3 | ATC12 | Human | Thyroid | ATC | 2.23e-73 | 1.79e+00 | 0.34 |
| 50509 | COL5A3 | ATC13 | Human | Thyroid | ATC | 1.83e-47 | 1.10e+00 | 0.34 |
| 50509 | COL5A3 | ATC2 | Human | Thyroid | ATC | 1.60e-07 | 9.53e-01 | 0.34 |
| 50509 | COL5A3 | ATC3 | Human | Thyroid | ATC | 6.48e-06 | 4.71e-01 | 0.338 |
| 50509 | COL5A3 | ATC4 | Human | Thyroid | ATC | 2.07e-86 | 2.09e+00 | 0.34 |
| 50509 | COL5A3 | ATC5 | Human | Thyroid | ATC | 1.88e-57 | 1.21e+00 | 0.34 |
| Page: 1 |
| Tissue | Expression Dynamics | Abbreviation |
| Esophagus | 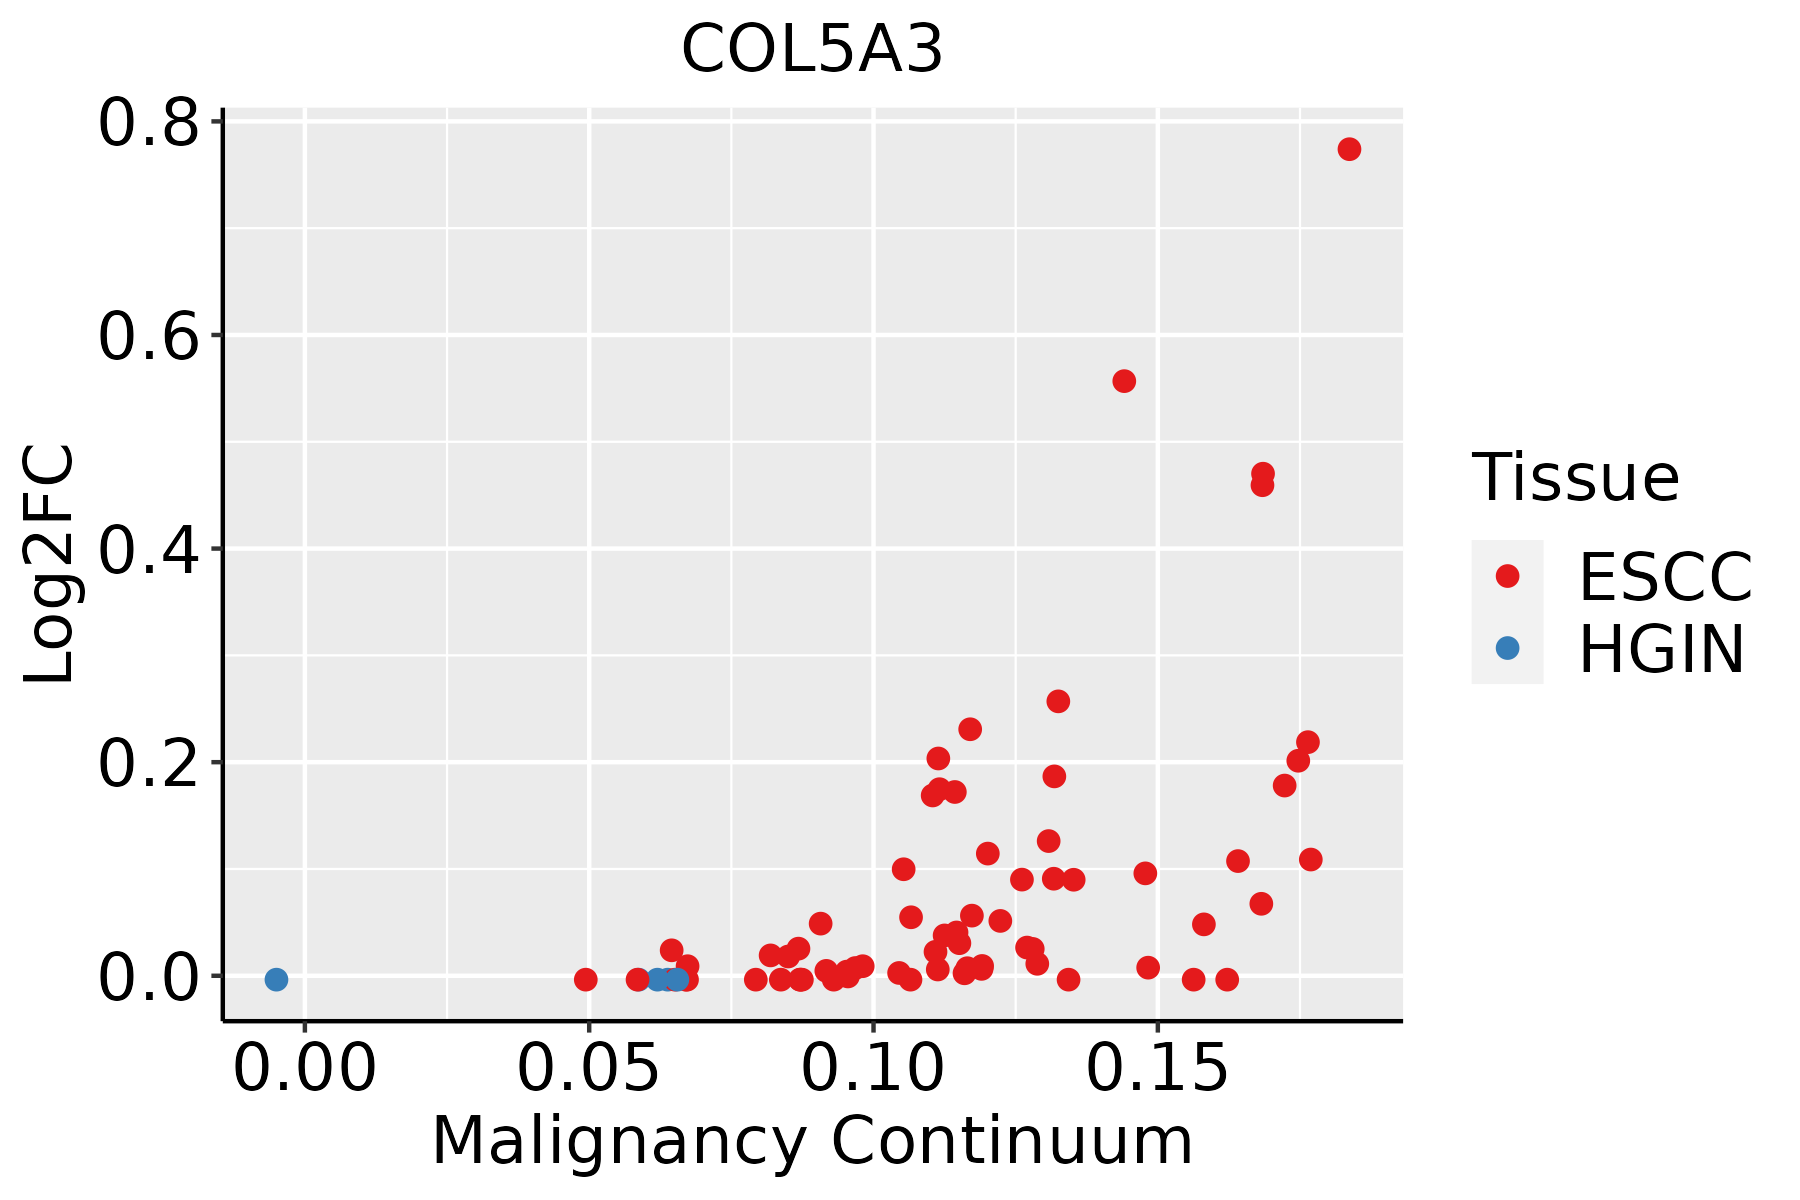 | ESCC: Esophageal squamous cell carcinoma |
| HGIN: High-grade intraepithelial neoplasias | ||
| LGIN: Low-grade intraepithelial neoplasias | ||
| Thyroid | 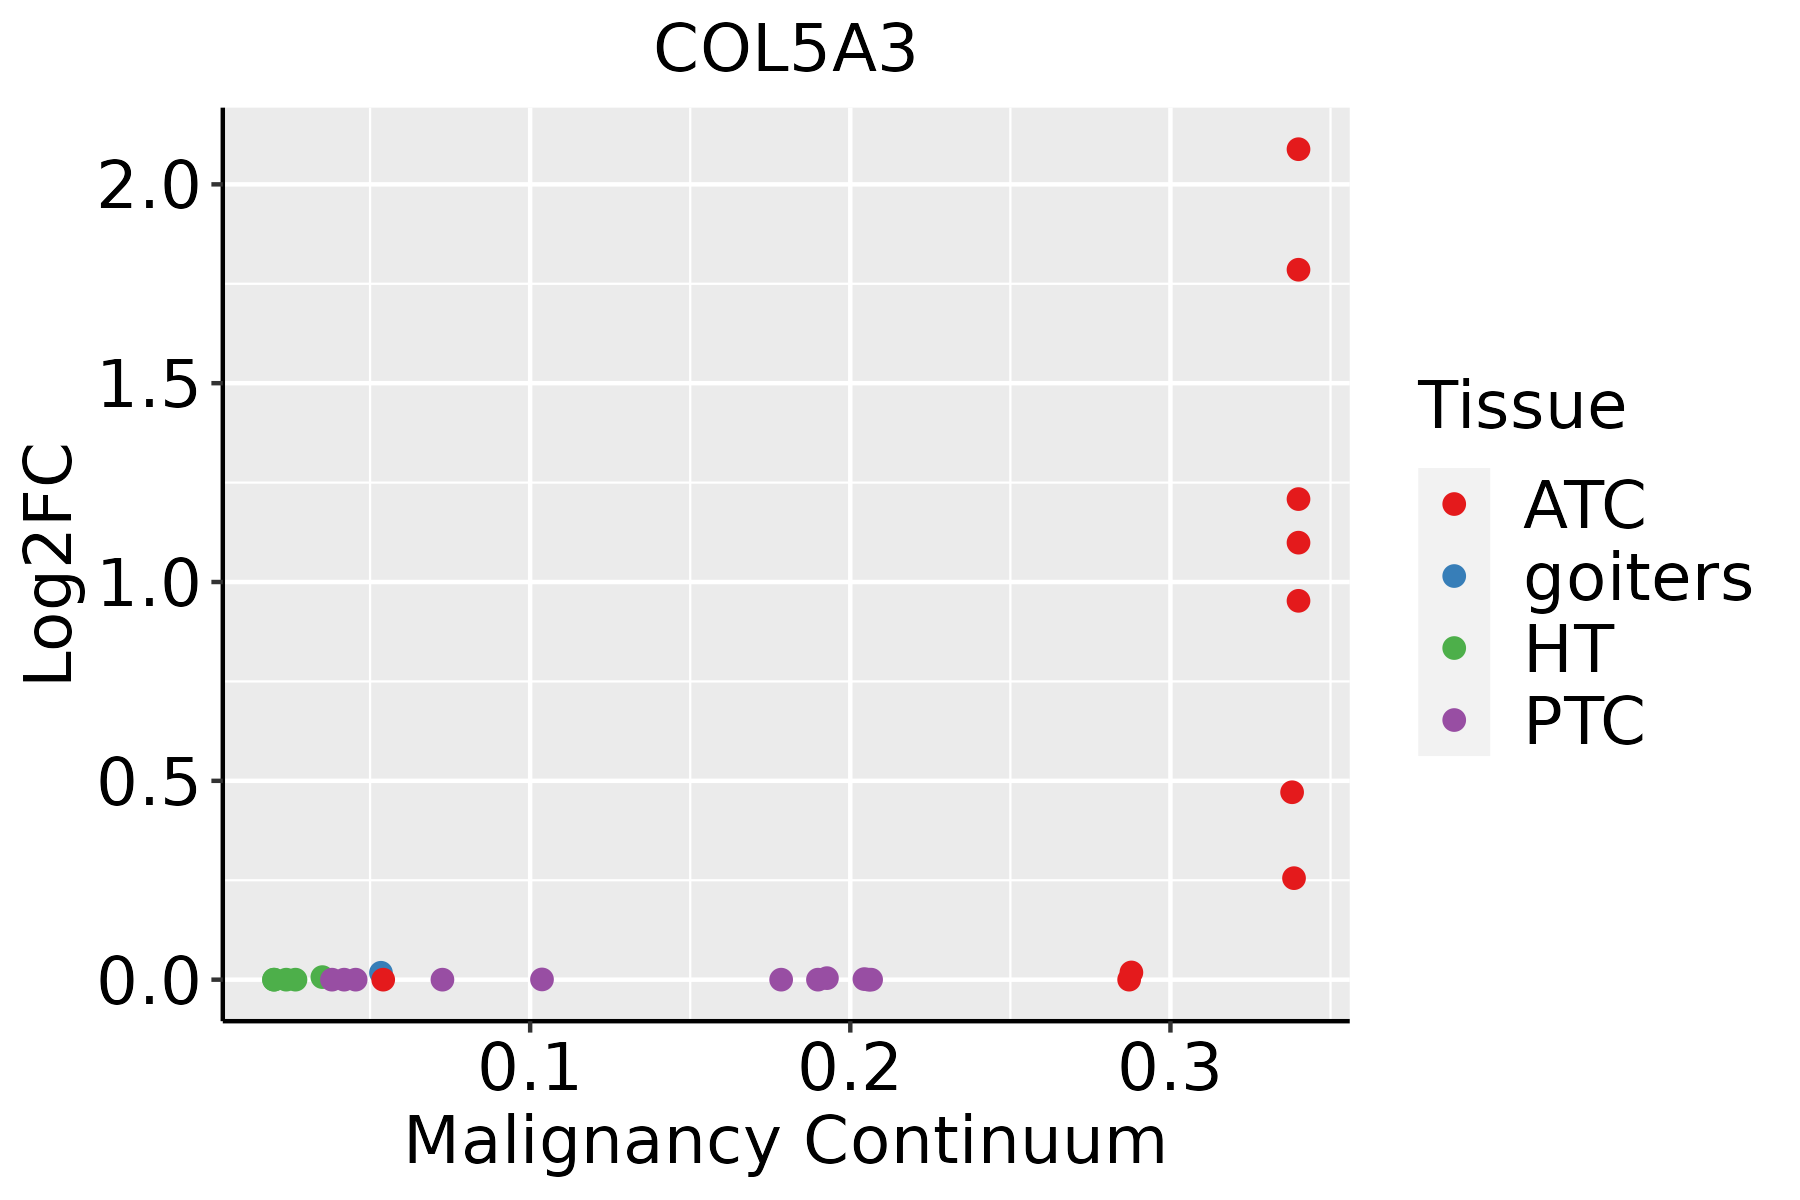 | ATC: Anaplastic thyroid cancer |
| HT: Hashimoto's thyroiditis | ||
| PTC: Papillary thyroid cancer |
| ∗log2FC in expression of this searched gene in stem-like cells from each diseased tissue sample relative to stem-like cells in normal samples in each tissue plotted against the malignancy continuum. Samples are colored based on if they are from different disease stage. |
Top |
Malignant transformation related pathway analysis |
| Find out the enriched GO biological processes and KEGG pathways involved in transition from healthy to precancer to cancer |
| Tissue | Disease Stage | Enriched GO biological Processes |
| Liver | Cyst |  |
| Lung | IAC |  |
| Lung | AIS |  |
| Lung | AAH |  |
| Lung | MIAC |  |
| ∗Top 15 enriched GO BP terms are showed in the bar plot of each disease state in each tissue. Each row represents a significant GO biological process which is colored according to the -log10(p.adjust). |
| Page: 1 2 3 4 5 6 7 8 9 |
| GO ID | Tissue | Disease Stage | Description | Gene Ratio | Bg Ratio | pvalue | p.adjust | Count |
| GO:003158919 | Esophagus | ESCC | cell-substrate adhesion | 221/8552 | 363/18723 | 3.06e-09 | 6.62e-08 | 221 |
| GO:00435888 | Esophagus | ESCC | skin development | 163/8552 | 263/18723 | 6.48e-08 | 1.14e-06 | 163 |
| GO:000716018 | Esophagus | ESCC | cell-matrix adhesion | 141/8552 | 233/18723 | 3.33e-06 | 3.71e-05 | 141 |
| GO:00301984 | Esophagus | ESCC | extracellular matrix organization | 171/8552 | 301/18723 | 6.08e-05 | 4.67e-04 | 171 |
| GO:00430624 | Esophagus | ESCC | extracellular structure organization | 171/8552 | 302/18723 | 7.73e-05 | 5.76e-04 | 171 |
| GO:00452294 | Esophagus | ESCC | external encapsulating structure organization | 172/8552 | 304/18723 | 7.80e-05 | 5.80e-04 | 172 |
| GO:00301993 | Esophagus | ESCC | collagen fibril organization | 40/8552 | 61/18723 | 1.35e-03 | 6.44e-03 | 40 |
| GO:003158928 | Thyroid | ATC | cell-substrate adhesion | 195/6293 | 363/18723 | 1.58e-15 | 1.17e-13 | 195 |
| GO:0007160111 | Thyroid | ATC | cell-matrix adhesion | 128/6293 | 233/18723 | 1.49e-11 | 5.41e-10 | 128 |
| GO:003019812 | Thyroid | ATC | extracellular matrix organization | 152/6293 | 301/18723 | 8.63e-10 | 2.24e-08 | 152 |
| GO:004306212 | Thyroid | ATC | extracellular structure organization | 152/6293 | 302/18723 | 1.17e-09 | 2.94e-08 | 152 |
| GO:004522912 | Thyroid | ATC | external encapsulating structure organization | 152/6293 | 304/18723 | 2.11e-09 | 5.08e-08 | 152 |
| GO:003019911 | Thyroid | ATC | collagen fibril organization | 43/6293 | 61/18723 | 4.24e-09 | 9.57e-08 | 43 |
| Page: 1 |
| Pathway ID | Tissue | Disease Stage | Description | Gene Ratio | Bg Ratio | pvalue | p.adjust | qvalue | Count |
| Page: 1 |
Top |
Cell-cell communication analysis |
| Identification of potential cell-cell interactions between two cell types and their ligand-receptor pairs for different disease states |
| Ligand | Receptor | LRpair | Pathway | Tissue | Disease Stage |
| Page: 1 |
Top |
Single-cell gene regulatory network inference analysis |
| Find out the significant the regulons (TFs) and the target genes of each regulon across cell types for different disease states |
| TF | Cell Type | Tissue | Disease Stage | Target Gene | RSS | Regulon Activity |
| ∗The dot plots of a searched regulon are shown for all cell subpopulations in each disease state of each tissue based on the regulon specific score inferred using pySCENIC and by calculating the average expression. |
| Page: 1 |
Top |
Somatic mutation of malignant transformation related genes |
| Annotation of somatic variants for genes involved in malignant transformation |
| Hugo Symbol | Variant Class | Variant Classification | dbSNP RS | HGVSc | HGVSp | HGVSp Short | SWISSPROT | BIOTYPE | SIFT | PolyPhen | Tumor Sample Barcode | Tissue | Histology | Sex | Age | Stage | Therapy Types | Drugs | Outcome |
| COL5A3 | SNV | Missense_Mutation | c.2325N>T | p.Glu775Asp | p.E775D | P25940 | protein_coding | tolerated(0.14) | benign(0.204) | TCGA-A2-A04R-01 | Breast | breast invasive carcinoma | Female | <65 | I/II | Chemotherapy | taxol | SD | |
| COL5A3 | SNV | Missense_Mutation | novel | c.226N>T | p.Pro76Ser | p.P76S | P25940 | protein_coding | deleterious(0.02) | possibly_damaging(0.622) | TCGA-A7-A0DB-01 | Breast | breast invasive carcinoma | Female | <65 | I/II | Hormone Therapy | arimidex | SD |
| COL5A3 | SNV | Missense_Mutation | c.4865N>G | p.Asp1622Gly | p.D1622G | P25940 | protein_coding | tolerated(0.1) | benign(0.131) | TCGA-AN-A0AK-01 | Breast | breast invasive carcinoma | Female | >=65 | I/II | Unknown | Unknown | SD | |
| COL5A3 | SNV | Missense_Mutation | rs375719134 | c.1844N>A | p.Arg615His | p.R615H | P25940 | protein_coding | tolerated(0.37) | benign(0.215) | TCGA-AN-A0AK-01 | Breast | breast invasive carcinoma | Female | >=65 | I/II | Unknown | Unknown | SD |
| COL5A3 | SNV | Missense_Mutation | c.781N>A | p.Gly261Arg | p.G261R | P25940 | protein_coding | tolerated(0.37) | probably_damaging(0.998) | TCGA-AR-A1AK-01 | Breast | breast invasive carcinoma | Female | >=65 | I/II | Hormone Therapy | anastrozole | SD | |
| COL5A3 | SNV | Missense_Mutation | novel | c.4721T>G | p.Val1574Gly | p.V1574G | P25940 | protein_coding | deleterious(0.01) | probably_damaging(0.999) | TCGA-AR-A1AP-01 | Breast | breast invasive carcinoma | Female | >=65 | I/II | Hormone Therapy | anastrozole | SD |
| COL5A3 | SNV | Missense_Mutation | c.2341N>C | p.Ala781Pro | p.A781P | P25940 | protein_coding | tolerated(0.43) | benign(0.026) | TCGA-BH-A0B4-01 | Breast | breast invasive carcinoma | Male | >=65 | III/IV | Hormone Therapy | tamoxiphen | SD | |
| COL5A3 | SNV | Missense_Mutation | c.1217N>T | p.Ser406Leu | p.S406L | P25940 | protein_coding | tolerated(0.07) | benign(0.001) | TCGA-BH-A2L8-01 | Breast | breast invasive carcinoma | Female | <65 | I/II | Chemotherapy | cytoxan | CR | |
| COL5A3 | SNV | Missense_Mutation | rs138241329 | c.1649N>A | p.Arg550His | p.R550H | P25940 | protein_coding | deleterious(0) | possibly_damaging(0.791) | TCGA-C8-A26Y-01 | Breast | breast invasive carcinoma | Female | >=65 | I/II | Unknown | Unknown | SD |
| COL5A3 | SNV | Missense_Mutation | rs770509108 | c.2306N>T | p.Ala769Val | p.A769V | P25940 | protein_coding | tolerated(0.28) | benign(0) | TCGA-D8-A1JP-01 | Breast | breast invasive carcinoma | Female | >=65 | I/II | Hormone Therapy | tamoxiphen | SD |
| Page: 1 2 3 4 5 6 7 8 9 10 11 12 13 14 15 16 17 18 19 20 |
Top |
Related drugs of malignant transformation related genes |
| Identification of chemicals and drugs interact with genes involved in malignant transfromation |
| (DGIdb 4.0) |
| Entrez ID | Symbol | Category | Interaction Types | Drug Claim Name | Drug Name | PMIDs |
| 50509 | COL5A3 | DRUGGABLE GENOME | CHEMBL2095222 | OCRIPLASMIN | ||
| 50509 | COL5A3 | DRUGGABLE GENOME | CHEMBL2108709 | COLLAGENASE CLOSTRIDIUM HISTOLYTICUM |
| Page: 1 |

Copyright 2023-Present -The University of Texas Health Science Center at Houston |