
|
|||||
|
 | |
| |
| |
| |
| |
| |
|
Gene: CHTF8 |
Gene summary for CHTF8 |
| Gene information | Species | Human | Gene symbol | CHTF8 | Gene ID | 54921 |
| Gene name | chromosome transmission fidelity factor 8 | |
| Gene Alias | CTF8 | |
| Cytomap | 16q22.1 | |
| Gene Type | protein-coding | GO ID | GO:0000070 | UniProtAcc | P0CG13 |
Top |
Malignant transformation analysis |
| Identification of the aberrant gene expression in precancerous and cancerous lesions by comparing the gene expression of stem-like cells in diseased tissues with normal stem cells |
| Entrez ID | Symbol | Replicates | Species | Organ | Tissue | Adj P-value | Log2FC | Malignancy |
| 54921 | CHTF8 | HTA11_3410_2000001011 | Human | Colorectum | AD | 5.92e-04 | 1.20e-01 | 0.0155 |
| 54921 | CHTF8 | HTA11_2487_2000001011 | Human | Colorectum | SER | 1.29e-05 | 2.17e-01 | -0.1808 |
| 54921 | CHTF8 | HTA11_1938_2000001011 | Human | Colorectum | AD | 2.44e-12 | 4.34e-01 | -0.0811 |
| 54921 | CHTF8 | HTA11_78_2000001011 | Human | Colorectum | AD | 8.31e-04 | 2.08e-01 | -0.1088 |
| 54921 | CHTF8 | HTA11_347_2000001011 | Human | Colorectum | AD | 9.00e-15 | 3.66e-01 | -0.1954 |
| 54921 | CHTF8 | HTA11_411_2000001011 | Human | Colorectum | SER | 2.77e-02 | 5.17e-01 | -0.2602 |
| 54921 | CHTF8 | HTA11_3361_2000001011 | Human | Colorectum | AD | 6.06e-08 | 3.82e-01 | -0.1207 |
| 54921 | CHTF8 | HTA11_83_2000001011 | Human | Colorectum | SER | 3.05e-05 | 3.36e-01 | -0.1526 |
| 54921 | CHTF8 | HTA11_696_2000001011 | Human | Colorectum | AD | 1.82e-07 | 3.22e-01 | -0.1464 |
| 54921 | CHTF8 | HTA11_866_2000001011 | Human | Colorectum | AD | 2.26e-02 | 1.99e-01 | -0.1001 |
| 54921 | CHTF8 | HTA11_1391_2000001011 | Human | Colorectum | AD | 1.19e-17 | 5.00e-01 | -0.059 |
| 54921 | CHTF8 | HTA11_546_2000001011 | Human | Colorectum | AD | 9.37e-07 | 3.45e-01 | -0.0842 |
| 54921 | CHTF8 | HTA11_866_3004761011 | Human | Colorectum | AD | 1.83e-12 | 3.56e-01 | 0.096 |
| 54921 | CHTF8 | HTA11_4255_2000001011 | Human | Colorectum | SER | 3.13e-04 | 3.32e-01 | 0.0446 |
| 54921 | CHTF8 | HTA11_8622_2000001021 | Human | Colorectum | SER | 1.08e-04 | 3.56e-01 | 0.0528 |
| 54921 | CHTF8 | HTA11_7663_2000001011 | Human | Colorectum | SER | 4.12e-04 | 3.71e-01 | 0.0131 |
| 54921 | CHTF8 | HTA11_10711_2000001011 | Human | Colorectum | AD | 8.57e-04 | 2.71e-01 | 0.0338 |
| 54921 | CHTF8 | HTA11_7696_3000711011 | Human | Colorectum | AD | 5.19e-04 | 2.75e-01 | 0.0674 |
| 54921 | CHTF8 | HTA11_6818_2000001011 | Human | Colorectum | AD | 2.35e-04 | 4.06e-01 | 0.0112 |
| 54921 | CHTF8 | HTA11_7469_2000001011 | Human | Colorectum | AD | 1.92e-03 | 4.10e-01 | -0.0124 |
| Page: 1 2 3 4 5 6 7 |
| Tissue | Expression Dynamics | Abbreviation |
| Colorectum (GSE201348) |  | FAP: Familial adenomatous polyposis |
| CRC: Colorectal cancer | ||
| Colorectum (HTA11) |  | AD: Adenomas |
| SER: Sessile serrated lesions | ||
| MSI-H: Microsatellite-high colorectal cancer | ||
| MSS: Microsatellite stable colorectal cancer | ||
| Esophagus | 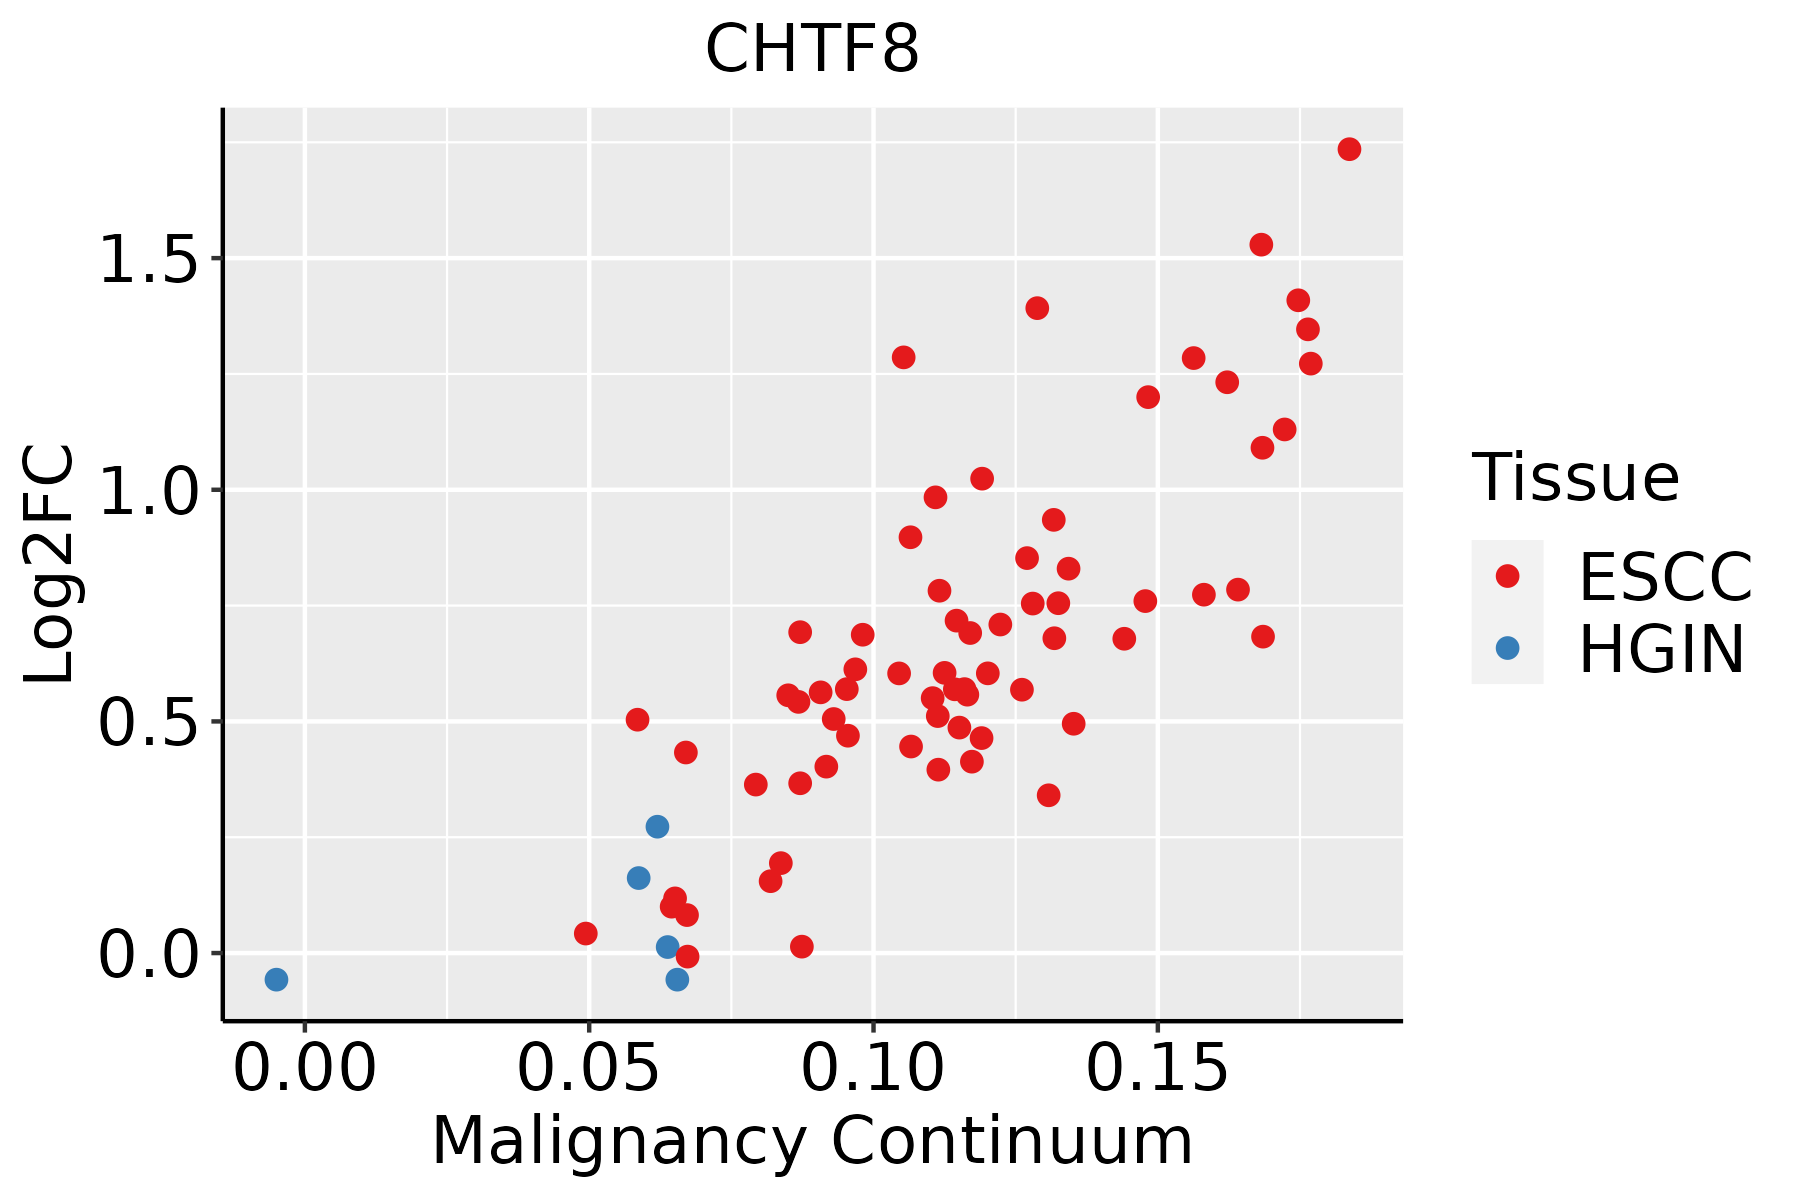 | ESCC: Esophageal squamous cell carcinoma |
| HGIN: High-grade intraepithelial neoplasias | ||
| LGIN: Low-grade intraepithelial neoplasias | ||
| Liver |  | HCC: Hepatocellular carcinoma |
| NAFLD: Non-alcoholic fatty liver disease | ||
| Oral Cavity |  | EOLP: Erosive Oral lichen planus |
| LP: leukoplakia | ||
| NEOLP: Non-erosive oral lichen planus | ||
| OSCC: Oral squamous cell carcinoma | ||
| Prostate | 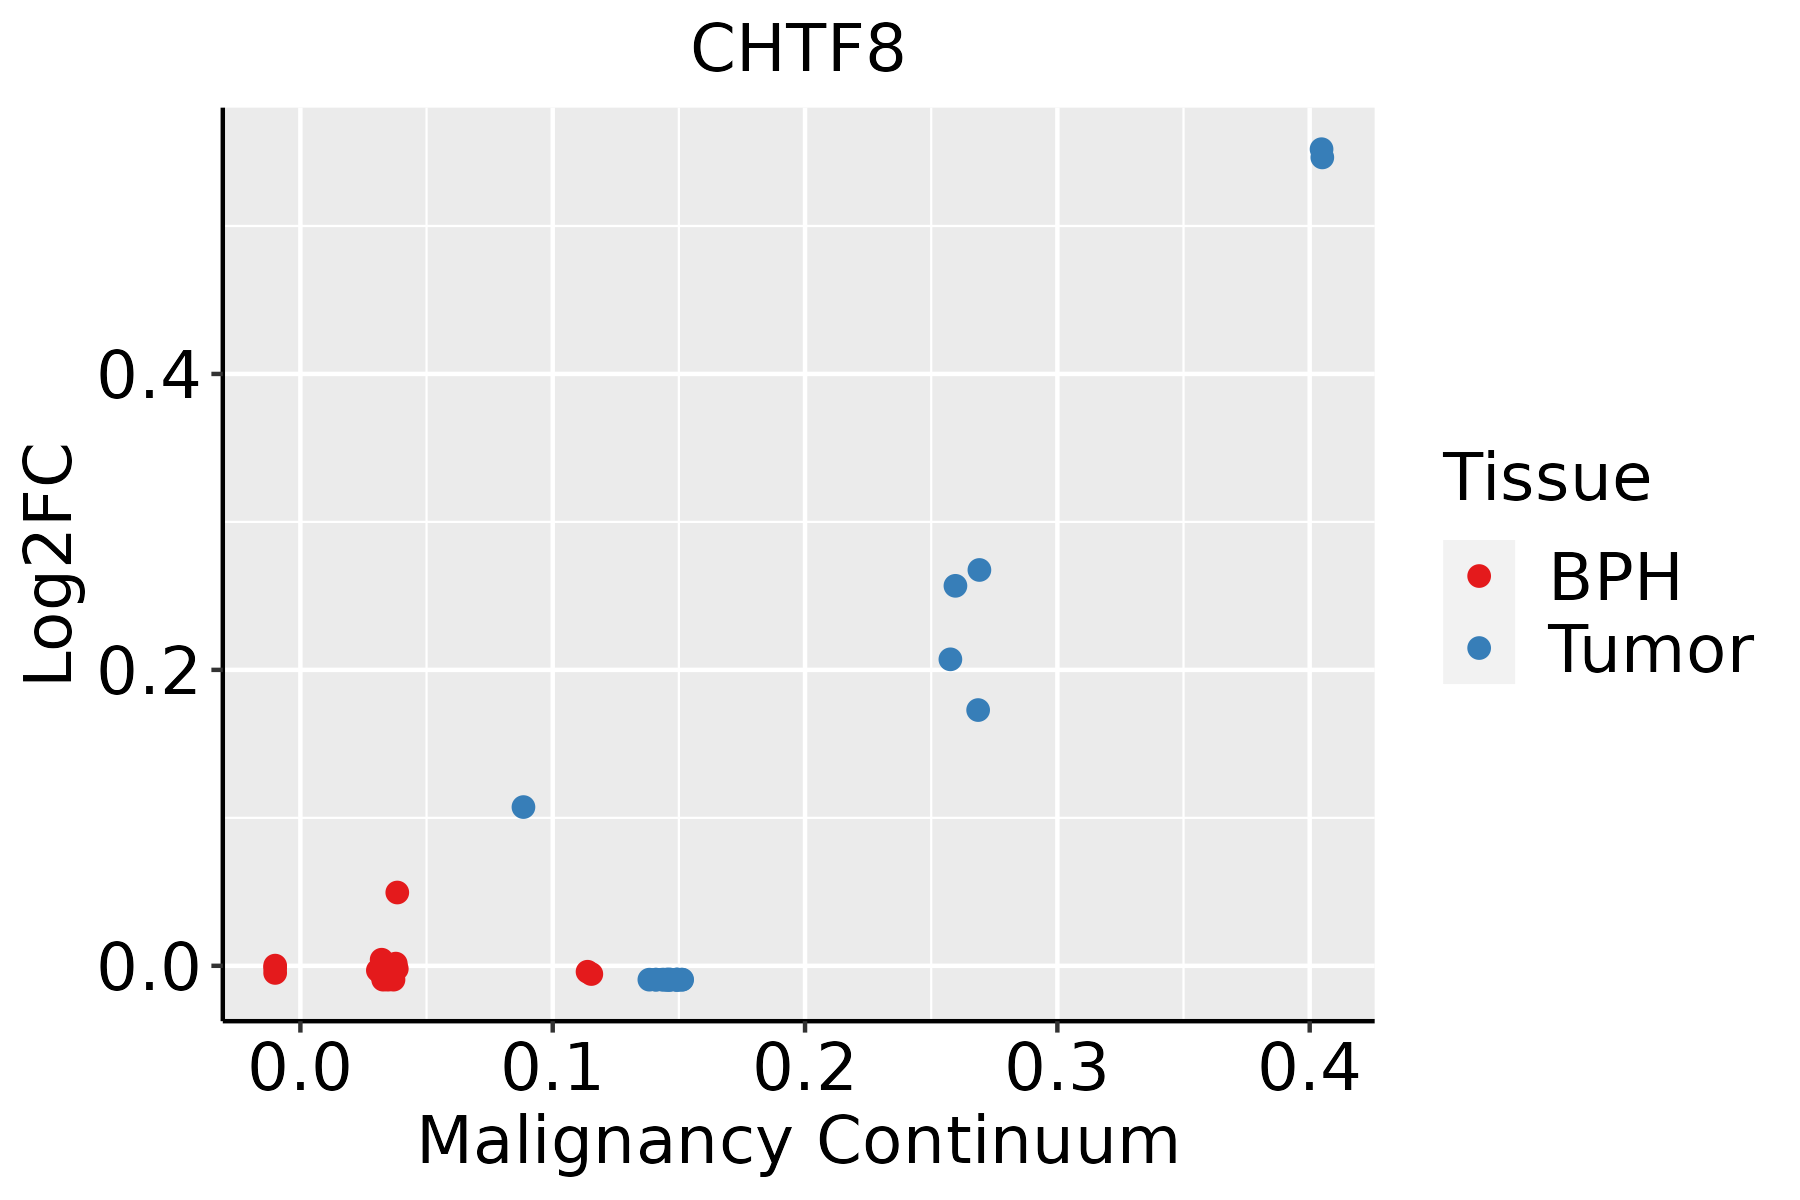 | BPH: Benign Prostatic Hyperplasia |
| Skin |  | AK: Actinic keratosis |
| cSCC: Cutaneous squamous cell carcinoma | ||
| SCCIS:squamous cell carcinoma in situ |
| ∗log2FC in expression of this searched gene in stem-like cells from each diseased tissue sample relative to stem-like cells in normal samples in each tissue plotted against the malignancy continuum. Samples are colored based on if they are from different disease stage. |
Top |
Malignant transformation related pathway analysis |
| Find out the enriched GO biological processes and KEGG pathways involved in transition from healthy to precancer to cancer |
| Tissue | Disease Stage | Enriched GO biological Processes |
| Liver | Cyst |  |
| Lung | IAC |  |
| Lung | AIS |  |
| Lung | AAH |  |
| Lung | MIAC |  |
| ∗Top 15 enriched GO BP terms are showed in the bar plot of each disease state in each tissue. Each row represents a significant GO biological process which is colored according to the -log10(p.adjust). |
| Page: 1 2 3 4 5 6 7 8 9 |
| GO ID | Tissue | Disease Stage | Description | Gene Ratio | Bg Ratio | pvalue | p.adjust | Count |
| GO:0051052 | Colorectum | AD | regulation of DNA metabolic process | 116/3918 | 359/18723 | 2.47e-07 | 1.00e-05 | 116 |
| GO:0051054 | Colorectum | AD | positive regulation of DNA metabolic process | 73/3918 | 201/18723 | 3.27e-07 | 1.29e-05 | 73 |
| GO:2000278 | Colorectum | AD | regulation of DNA biosynthetic process | 41/3918 | 106/18723 | 2.17e-05 | 4.33e-04 | 41 |
| GO:2000573 | Colorectum | AD | positive regulation of DNA biosynthetic process | 28/3918 | 66/18723 | 6.35e-05 | 1.05e-03 | 28 |
| GO:0071897 | Colorectum | AD | DNA biosynthetic process | 55/3918 | 180/18723 | 1.46e-03 | 1.24e-02 | 55 |
| GO:0032392 | Colorectum | AD | DNA geometric change | 31/3918 | 90/18723 | 2.02e-03 | 1.63e-02 | 31 |
| GO:0007064 | Colorectum | AD | mitotic sister chromatid cohesion | 13/3918 | 28/18723 | 2.22e-03 | 1.75e-02 | 13 |
| GO:0007062 | Colorectum | AD | sister chromatid cohesion | 23/3918 | 62/18723 | 2.51e-03 | 1.92e-02 | 23 |
| GO:0140014 | Colorectum | AD | mitotic nuclear division | 78/3918 | 287/18723 | 6.48e-03 | 4.05e-02 | 78 |
| GO:20002781 | Colorectum | SER | regulation of DNA biosynthetic process | 33/2897 | 106/18723 | 3.83e-05 | 9.82e-04 | 33 |
| GO:00510541 | Colorectum | SER | positive regulation of DNA metabolic process | 53/2897 | 201/18723 | 4.51e-05 | 1.13e-03 | 53 |
| GO:00510521 | Colorectum | SER | regulation of DNA metabolic process | 83/2897 | 359/18723 | 8.03e-05 | 1.77e-03 | 83 |
| GO:20005731 | Colorectum | SER | positive regulation of DNA biosynthetic process | 22/2897 | 66/18723 | 2.44e-04 | 4.17e-03 | 22 |
| GO:00718971 | Colorectum | SER | DNA biosynthetic process | 43/2897 | 180/18723 | 1.99e-03 | 1.98e-02 | 43 |
| GO:00510522 | Colorectum | MSS | regulation of DNA metabolic process | 108/3467 | 359/18723 | 5.86e-08 | 3.10e-06 | 108 |
| GO:00510542 | Colorectum | MSS | positive regulation of DNA metabolic process | 69/3467 | 201/18723 | 6.33e-08 | 3.26e-06 | 69 |
| GO:20002782 | Colorectum | MSS | regulation of DNA biosynthetic process | 37/3467 | 106/18723 | 4.48e-05 | 8.28e-04 | 37 |
| GO:20005732 | Colorectum | MSS | positive regulation of DNA biosynthetic process | 26/3467 | 66/18723 | 5.97e-05 | 1.04e-03 | 26 |
| GO:00323921 | Colorectum | MSS | DNA geometric change | 29/3467 | 90/18723 | 1.26e-03 | 1.20e-02 | 29 |
| GO:00718972 | Colorectum | MSS | DNA biosynthetic process | 50/3467 | 180/18723 | 1.45e-03 | 1.35e-02 | 50 |
| Page: 1 2 3 4 5 6 7 |
| Pathway ID | Tissue | Disease Stage | Description | Gene Ratio | Bg Ratio | pvalue | p.adjust | qvalue | Count |
| Page: 1 |
Top |
Cell-cell communication analysis |
| Identification of potential cell-cell interactions between two cell types and their ligand-receptor pairs for different disease states |
| Ligand | Receptor | LRpair | Pathway | Tissue | Disease Stage |
| Page: 1 |
Top |
Single-cell gene regulatory network inference analysis |
| Find out the significant the regulons (TFs) and the target genes of each regulon across cell types for different disease states |
| TF | Cell Type | Tissue | Disease Stage | Target Gene | RSS | Regulon Activity |
| ∗The dot plots of a searched regulon are shown for all cell subpopulations in each disease state of each tissue based on the regulon specific score inferred using pySCENIC and by calculating the average expression. |
| Page: 1 |
Top |
Somatic mutation of malignant transformation related genes |
| Annotation of somatic variants for genes involved in malignant transformation |
| Hugo Symbol | Variant Class | Variant Classification | dbSNP RS | HGVSc | HGVSp | HGVSp Short | SWISSPROT | BIOTYPE | SIFT | PolyPhen | Tumor Sample Barcode | Tissue | Histology | Sex | Age | Stage | Therapy Types | Drugs | Outcome |
| CHTF8 | SNV | Missense_Mutation | novel | c.160N>A | p.Val54Met | p.V54M | P0CG13 | protein_coding | deleterious(0) | probably_damaging(0.977) | TCGA-AJ-A3OJ-01 | Endometrium | uterine corpus endometrioid carcinoma | Female | <65 | I/II | Chemotherapy | carboplatin | CR |
| CHTF8 | SNV | Missense_Mutation | c.361N>T | p.Val121Leu | p.V121L | P0CG13 | protein_coding | tolerated(0.1) | possibly_damaging(0.573) | TCGA-AP-A059-01 | Endometrium | uterine corpus endometrioid carcinoma | Female | >=65 | I/II | Unknown | Unknown | SD | |
| CHTF8 | SNV | Missense_Mutation | c.140A>T | p.Glu47Val | p.E47V | P0CG13 | protein_coding | tolerated(0.11) | possibly_damaging(0.795) | TCGA-55-A57B-01 | Lung | lung adenocarcinoma | Female | >=65 | I/II | Unknown | Unknown | SD | |
| CHTF8 | SNV | Missense_Mutation | c.309N>C | p.Lys103Asn | p.K103N | P0CG13 | protein_coding | deleterious(0) | probably_damaging(0.999) | TCGA-60-2698-01 | Lung | lung squamous cell carcinoma | Male | <65 | I/II | Chemotherapy | mithramycin | PD | |
| CHTF8 | SNV | Missense_Mutation | rs769216163 | c.277C>T | p.Arg93Trp | p.R93W | P0CG13 | protein_coding | tolerated(0.07) | benign(0) | TCGA-94-7943-01 | Lung | lung squamous cell carcinoma | Male | >=65 | I/II | Unknown | Unknown | PD |
| CHTF8 | SNV | Missense_Mutation | rs774439830 | c.70N>T | p.Gly24Trp | p.G24W | P0CG13 | protein_coding | deleterious(0) | probably_damaging(1) | TCGA-CN-5363-01 | Oral cavity | head & neck squamous cell carcinoma | Male | <65 | I/II | Unknown | Unknown | PD |
| CHTF8 | SNV | Missense_Mutation | novel | c.212N>T | p.Ala71Val | p.A71V | P0CG13 | protein_coding | tolerated(0.15) | possibly_damaging(0.836) | TCGA-XK-AAIW-01 | Prostate | prostate adenocarcinoma | Male | >=65 | 9 | Unknown | Unknown | PD |
| CHTF8 | SNV | Missense_Mutation | rs183034674 | c.86N>A | p.Arg29His | p.R29H | P0CG13 | protein_coding | tolerated(0.06) | probably_damaging(0.984) | TCGA-VQ-A8P2-01 | Stomach | stomach adenocarcinoma | Male | >=65 | III/IV | Unspecific | Complete Response | |
| CHTF8 | deletion | Frame_Shift_Del | novel | c.86_123delNNNNNNNNNNNNNNNNNNNNNNNNNNNNNNNNNNNNNN | p.Arg29ProfsTer6 | p.R29Pfs*6 | P0CG13 | protein_coding | TCGA-D7-6524-01 | Stomach | stomach adenocarcinoma | Male | <65 | I/II | Unknown | Unknown | PD | ||
| CHTF8 | SNV | Missense_Mutation | novel | c.325N>A | p.Arg109Ser | p.R109S | P0CG13 | protein_coding | deleterious(0) | probably_damaging(0.988) | TCGA-BJ-A290-01 | Thyroid | thyroid carcinoma | Male | >=65 | III/IV | Unknown | Unknown | PD |
| Page: 1 |
Top |
Related drugs of malignant transformation related genes |
| Identification of chemicals and drugs interact with genes involved in malignant transfromation |
| (DGIdb 4.0) |
| Entrez ID | Symbol | Category | Interaction Types | Drug Claim Name | Drug Name | PMIDs |
| Page: 1 |

Copyright 2023-Present -The University of Texas Health Science Center at Houston |