
|
|||||
|
 | |
| |
| |
| |
| |
| |
|
Gene: CFAP298 |
Gene summary for CFAP298 |
| Gene information | Species | Human | Gene symbol | CFAP298 | Gene ID | 56683 |
| Gene name | cilia and flagella associated protein 298 | |
| Gene Alias | C21orf48 | |
| Cytomap | 21q22.11 | |
| Gene Type | protein-coding | GO ID | GO:0003341 | UniProtAcc | P57076 |
Top |
Malignant transformation analysis |
| Identification of the aberrant gene expression in precancerous and cancerous lesions by comparing the gene expression of stem-like cells in diseased tissues with normal stem cells |
| Entrez ID | Symbol | Replicates | Species | Organ | Tissue | Adj P-value | Log2FC | Malignancy |
| 56683 | CFAP298 | GSM4909285 | Human | Breast | IDC | 2.04e-31 | 6.04e-01 | 0.21 |
| 56683 | CFAP298 | GSM4909290 | Human | Breast | IDC | 8.74e-04 | 2.32e-01 | 0.2096 |
| 56683 | CFAP298 | GSM4909293 | Human | Breast | IDC | 2.41e-03 | 1.87e-01 | 0.1581 |
| 56683 | CFAP298 | GSM4909298 | Human | Breast | IDC | 8.43e-09 | 3.28e-01 | 0.1551 |
| 56683 | CFAP298 | GSM4909304 | Human | Breast | IDC | 6.07e-03 | 2.42e-01 | 0.1636 |
| 56683 | CFAP298 | GSM4909305 | Human | Breast | IDC | 2.70e-03 | 1.98e-01 | 0.0436 |
| 56683 | CFAP298 | GSM4909308 | Human | Breast | IDC | 1.21e-04 | 1.88e-01 | 0.158 |
| 56683 | CFAP298 | GSM4909311 | Human | Breast | IDC | 2.77e-03 | 4.46e-02 | 0.1534 |
| 56683 | CFAP298 | GSM4909312 | Human | Breast | IDC | 7.09e-03 | 2.95e-01 | 0.1552 |
| 56683 | CFAP298 | GSM4909315 | Human | Breast | IDC | 4.84e-12 | 4.58e-01 | 0.21 |
| 56683 | CFAP298 | GSM4909316 | Human | Breast | IDC | 3.75e-04 | 4.64e-01 | 0.21 |
| 56683 | CFAP298 | GSM4909319 | Human | Breast | IDC | 5.37e-07 | -2.39e-02 | 0.1563 |
| 56683 | CFAP298 | brca1 | Human | Breast | Precancer | 7.43e-04 | -1.21e-01 | -0.0338 |
| 56683 | CFAP298 | brca2 | Human | Breast | Precancer | 3.51e-04 | -1.21e-01 | -0.024 |
| 56683 | CFAP298 | brca3 | Human | Breast | Precancer | 3.51e-04 | -1.21e-01 | -0.0263 |
| 56683 | CFAP298 | M1 | Human | Breast | IDC | 5.77e-05 | 2.41e-01 | 0.1577 |
| 56683 | CFAP298 | DCIS2 | Human | Breast | DCIS | 4.02e-64 | 3.21e-01 | 0.0085 |
| 56683 | CFAP298 | AEH-subject1 | Human | Endometrium | AEH | 1.78e-10 | 2.30e-01 | -0.3059 |
| 56683 | CFAP298 | AEH-subject2 | Human | Endometrium | AEH | 1.65e-11 | 2.83e-01 | -0.2525 |
| 56683 | CFAP298 | AEH-subject3 | Human | Endometrium | AEH | 1.17e-28 | 5.41e-01 | -0.2576 |
| Page: 1 2 3 4 |
| Tissue | Expression Dynamics | Abbreviation |
| Breast | 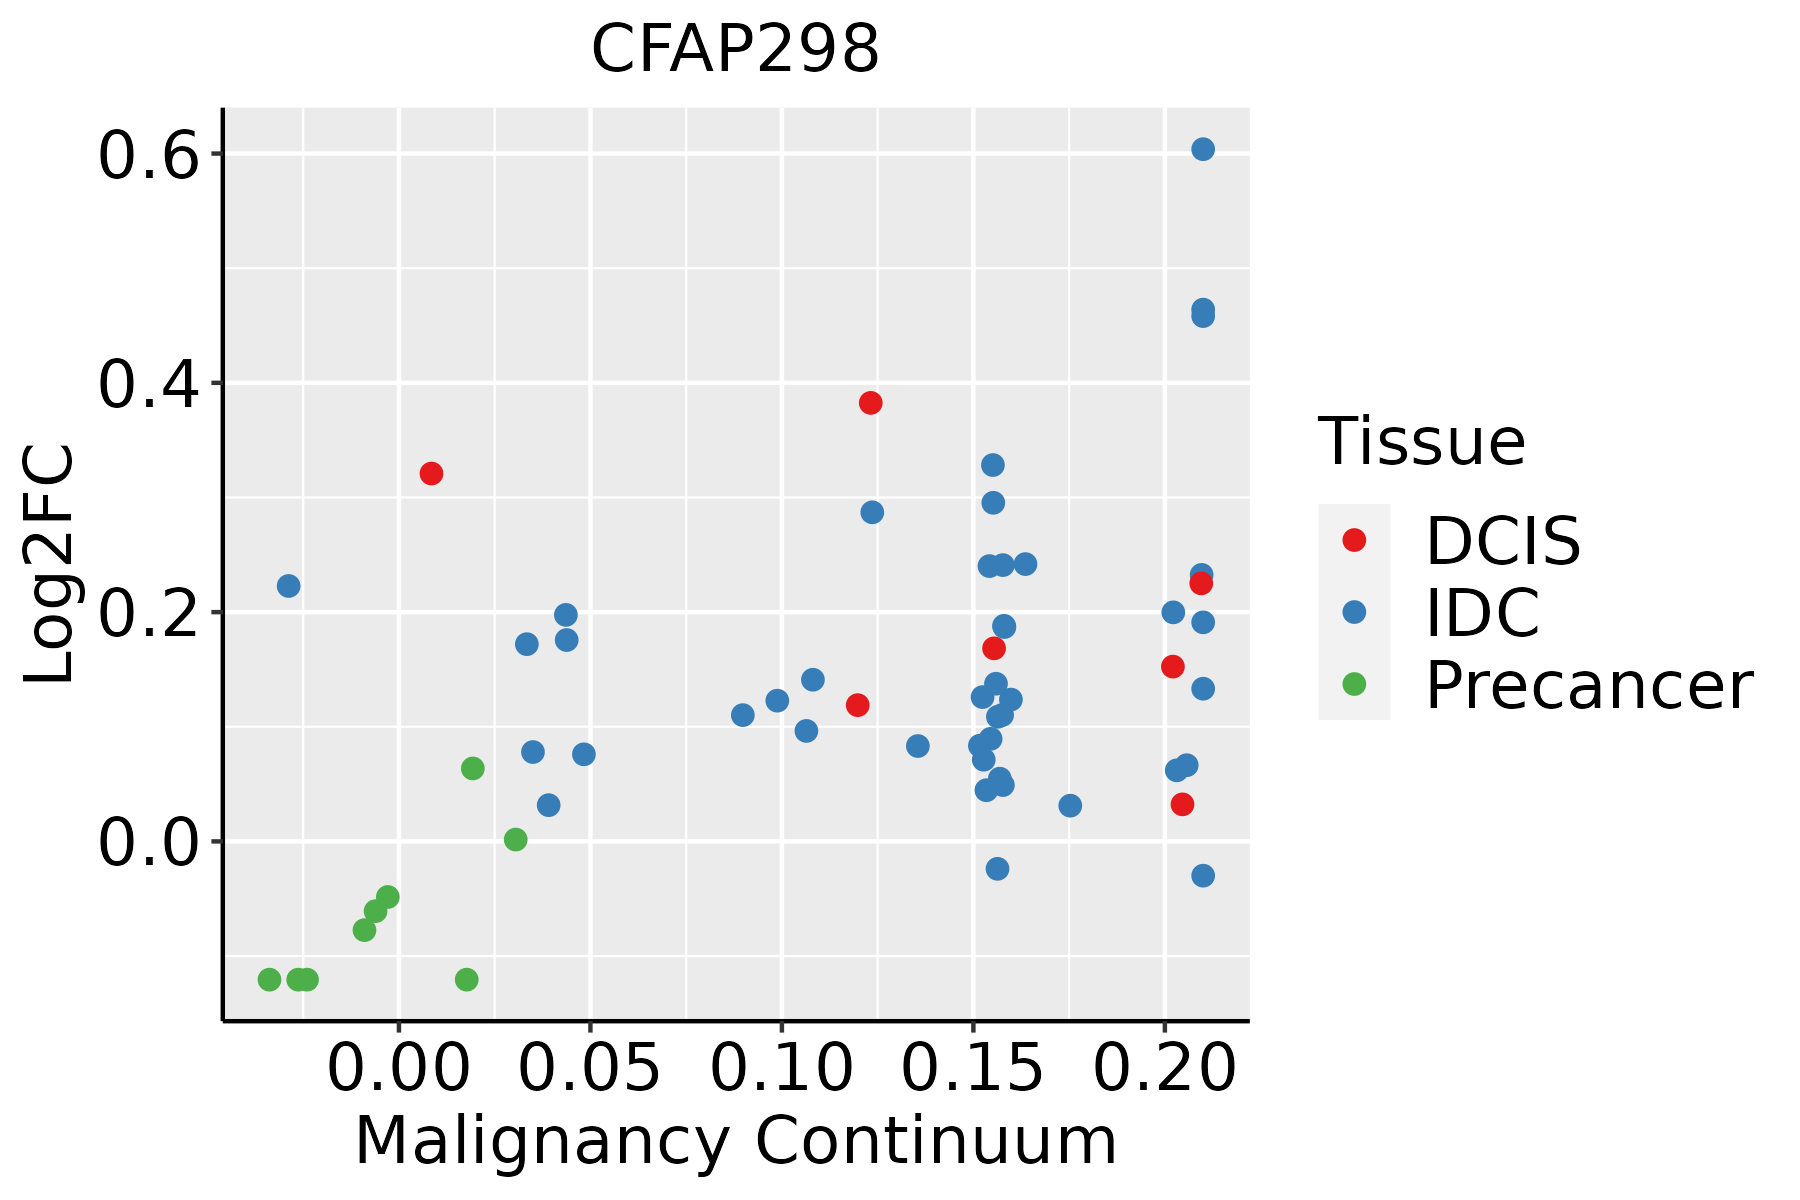 | IDC: Invasive ductal carcinoma |
| DCIS: Ductal carcinoma in situ | ||
| Precancer(BRCA1-mut): Precancerous lesion from BRCA1 mutation carriers | ||
| Endometrium |  | AEH: Atypical endometrial hyperplasia |
| EEC: Endometrioid Cancer | ||
| Esophagus | 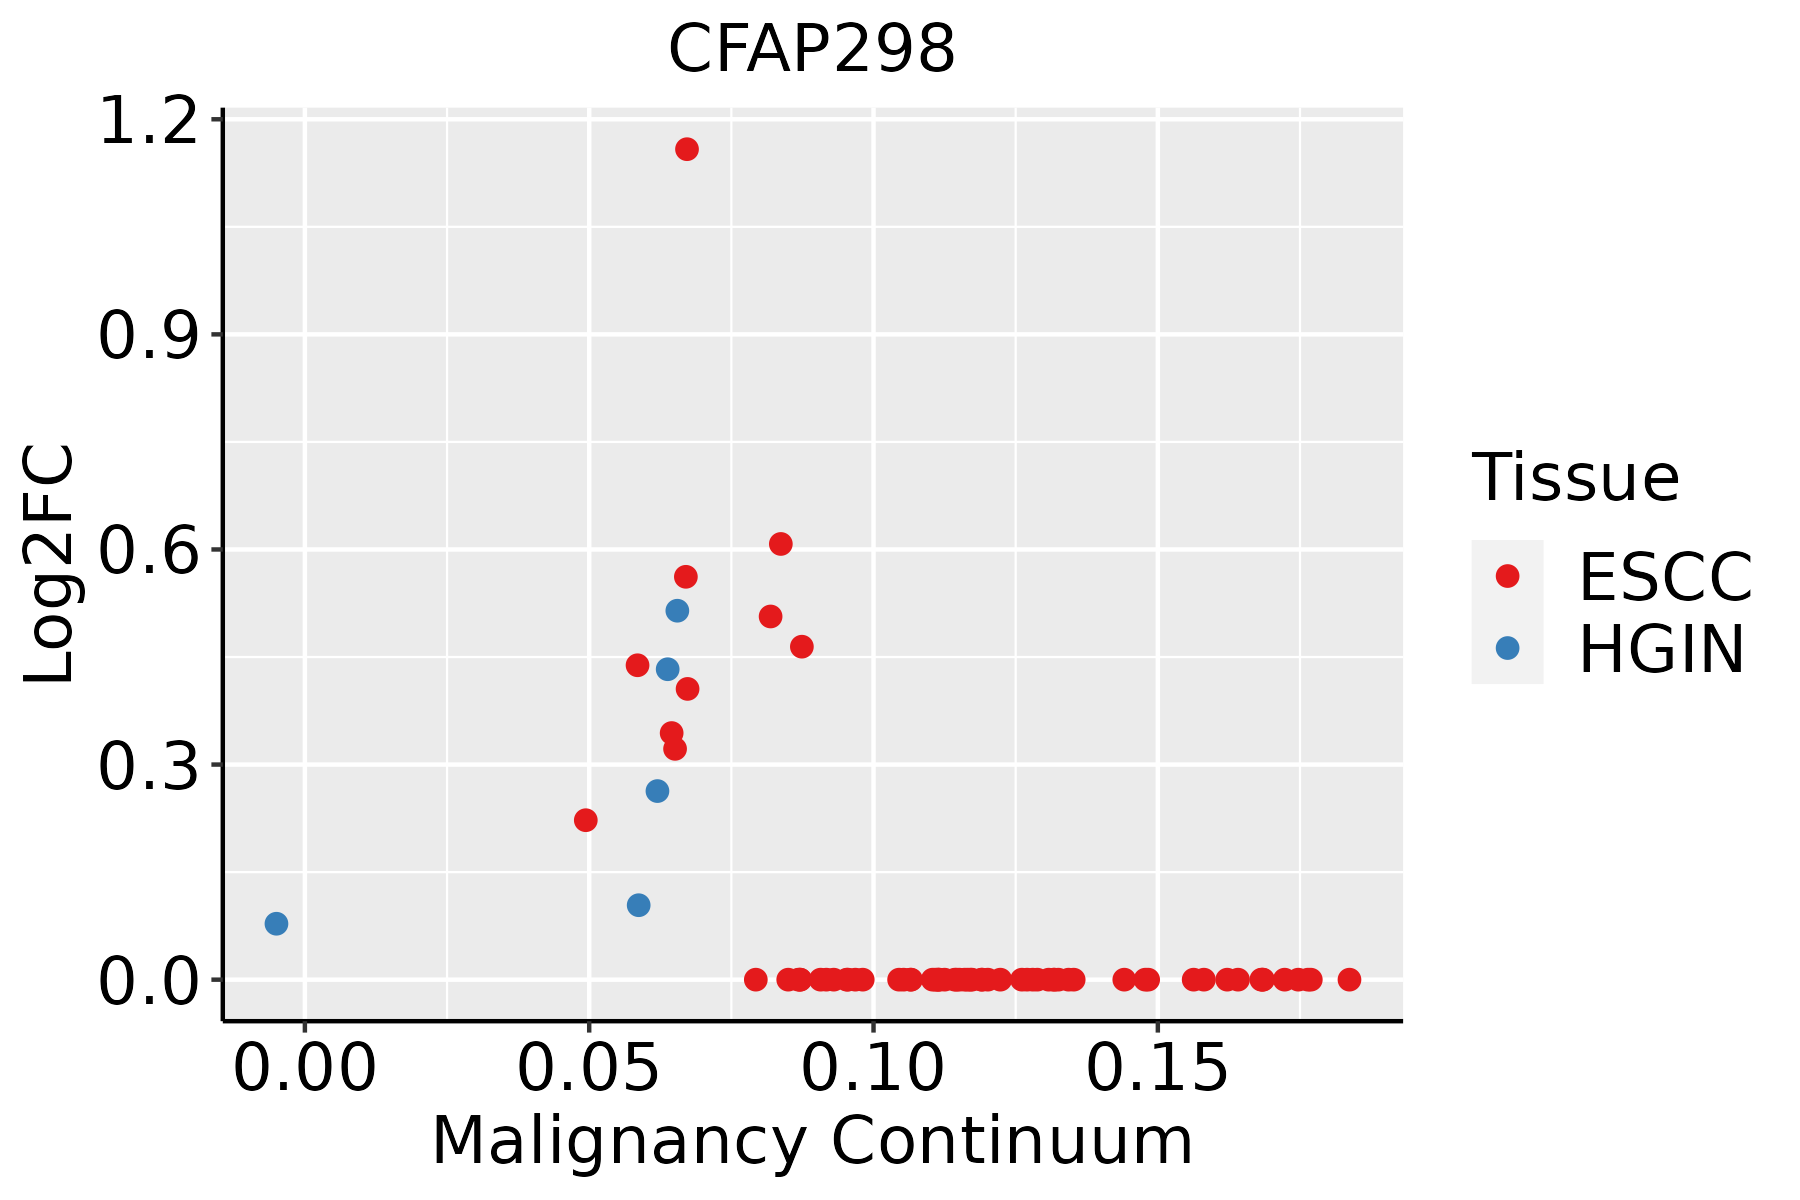 | ESCC: Esophageal squamous cell carcinoma |
| HGIN: High-grade intraepithelial neoplasias | ||
| LGIN: Low-grade intraepithelial neoplasias | ||
| Liver |  | HCC: Hepatocellular carcinoma |
| NAFLD: Non-alcoholic fatty liver disease | ||
| Thyroid | 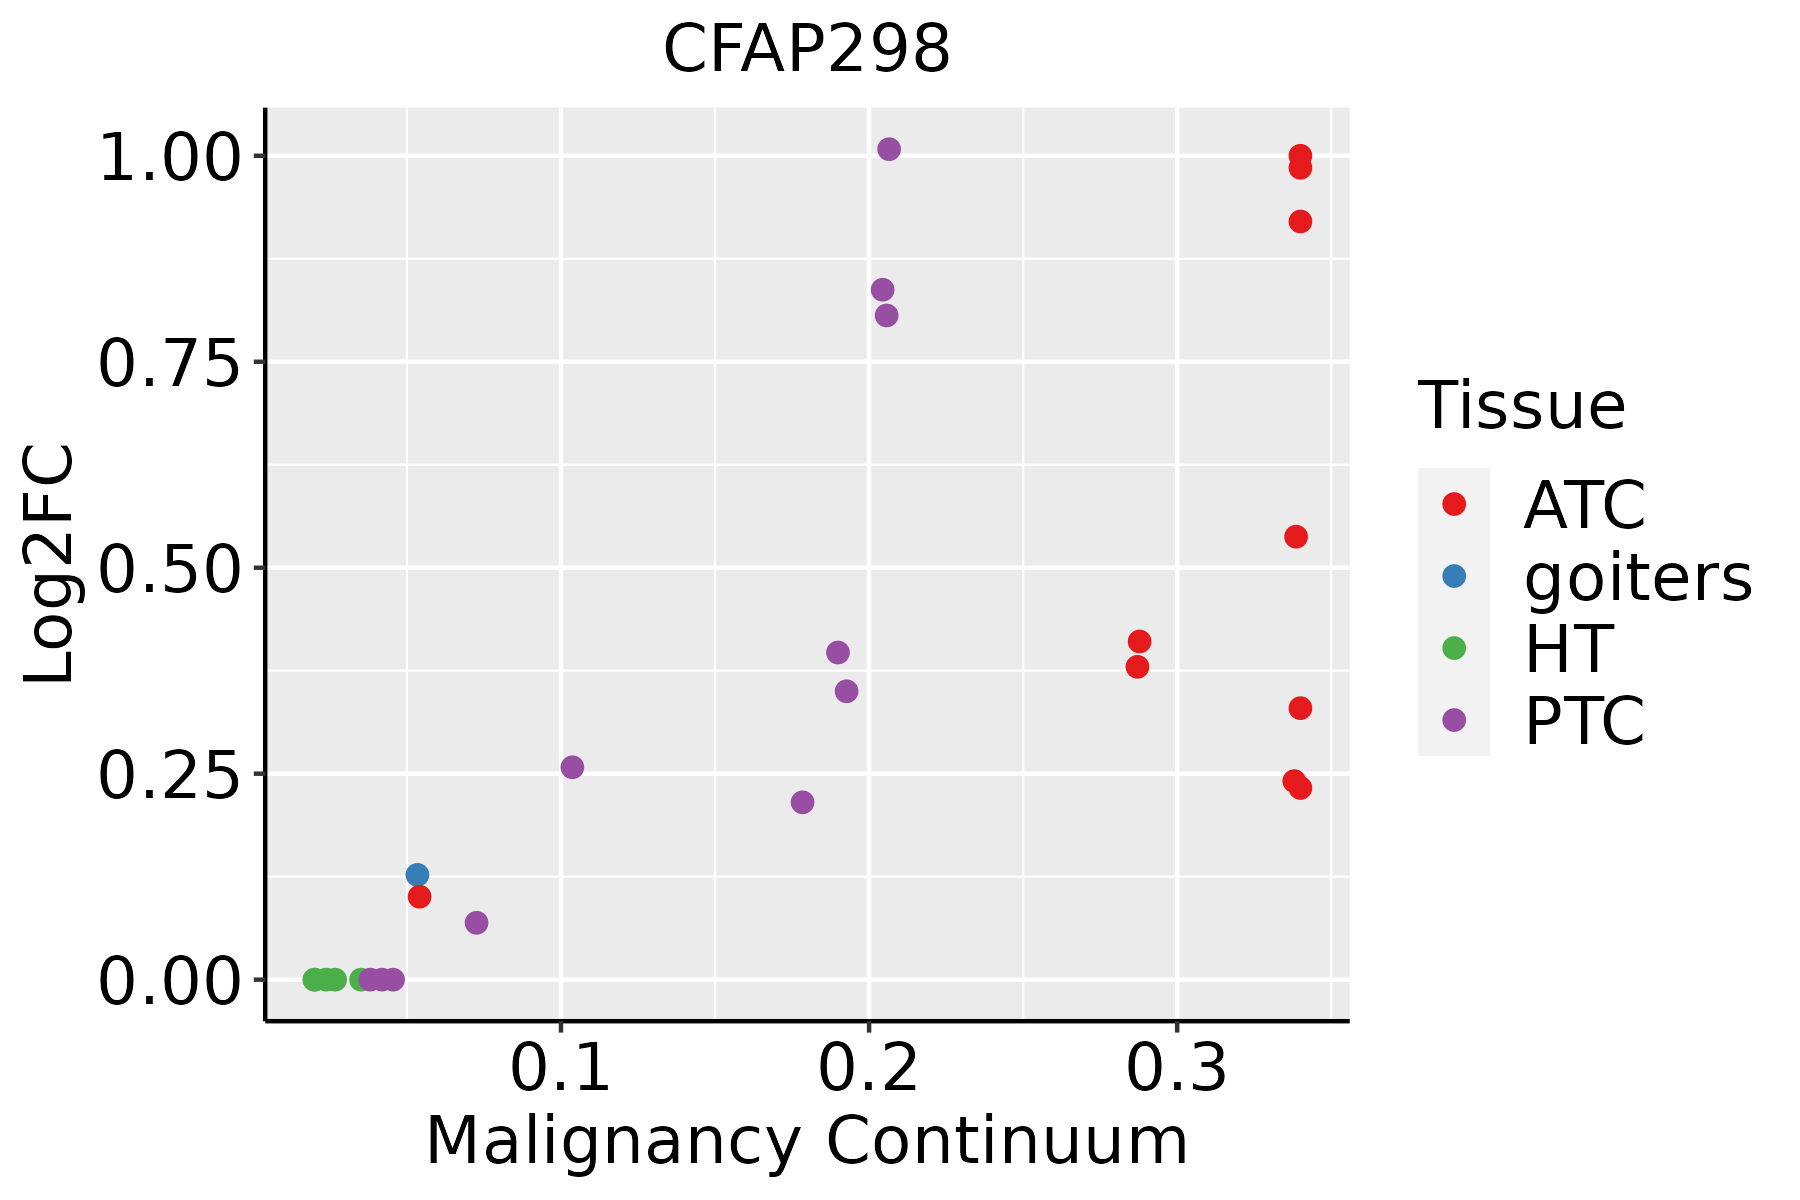 | ATC: Anaplastic thyroid cancer |
| HT: Hashimoto's thyroiditis | ||
| PTC: Papillary thyroid cancer |
| ∗log2FC in expression of this searched gene in stem-like cells from each diseased tissue sample relative to stem-like cells in normal samples in each tissue plotted against the malignancy continuum. Samples are colored based on if they are from different disease stage. |
Top |
Malignant transformation related pathway analysis |
| Find out the enriched GO biological processes and KEGG pathways involved in transition from healthy to precancer to cancer |
| Tissue | Disease Stage | Enriched GO biological Processes |
| Liver | Cyst |  |
| Lung | IAC |  |
| Lung | AIS |  |
| Lung | AAH |  |
| Lung | MIAC |  |
| ∗Top 15 enriched GO BP terms are showed in the bar plot of each disease state in each tissue. Each row represents a significant GO biological process which is colored according to the -log10(p.adjust). |
| Page: 1 2 3 4 5 6 7 8 9 |
| GO ID | Tissue | Disease Stage | Description | Gene Ratio | Bg Ratio | pvalue | p.adjust | Count |
| GO:00328864 | Esophagus | ESCC | regulation of microtubule-based process | 134/8552 | 240/18723 | 9.44e-04 | 4.80e-03 | 134 |
| GO:0032886 | Liver | HCC | regulation of microtubule-based process | 123/7958 | 240/18723 | 3.69e-03 | 1.64e-02 | 123 |
| GO:00328866 | Thyroid | PTC | regulation of microtubule-based process | 105/5968 | 240/18723 | 6.91e-05 | 6.03e-04 | 105 |
| GO:003288613 | Thyroid | ATC | regulation of microtubule-based process | 114/6293 | 240/18723 | 5.17e-06 | 5.59e-05 | 114 |
| Page: 1 |
| Pathway ID | Tissue | Disease Stage | Description | Gene Ratio | Bg Ratio | pvalue | p.adjust | qvalue | Count |
| Page: 1 |
Top |
Cell-cell communication analysis |
| Identification of potential cell-cell interactions between two cell types and their ligand-receptor pairs for different disease states |
| Ligand | Receptor | LRpair | Pathway | Tissue | Disease Stage |
| Page: 1 |
Top |
Single-cell gene regulatory network inference analysis |
| Find out the significant the regulons (TFs) and the target genes of each regulon across cell types for different disease states |
| TF | Cell Type | Tissue | Disease Stage | Target Gene | RSS | Regulon Activity |
| ∗The dot plots of a searched regulon are shown for all cell subpopulations in each disease state of each tissue based on the regulon specific score inferred using pySCENIC and by calculating the average expression. |
| Page: 1 |
Top |
Somatic mutation of malignant transformation related genes |
| Annotation of somatic variants for genes involved in malignant transformation |
| Hugo Symbol | Variant Class | Variant Classification | dbSNP RS | HGVSc | HGVSp | HGVSp Short | SWISSPROT | BIOTYPE | SIFT | PolyPhen | Tumor Sample Barcode | Tissue | Histology | Sex | Age | Stage | Therapy Types | Drugs | Outcome |
| Page: 1 |
Top |
Related drugs of malignant transformation related genes |
| Identification of chemicals and drugs interact with genes involved in malignant transfromation |
| (DGIdb 4.0) |
| Entrez ID | Symbol | Category | Interaction Types | Drug Claim Name | Drug Name | PMIDs |
| Page: 1 |

Copyright 2023-Present -The University of Texas Health Science Center at Houston |